The main Elliott wave count in last analysis expected upwards movement. This is exactly what is happening.
Summary: While price remains above 2,700.68, assume a third wave may be unfolding. The short term target is at 2,824 or 2,915. The mid to longer term target is at 2,922. The final target for this bull market to end remains at 3,616.
Small bearish divergence today from On Balance Volume suggests the pullback may not be over and may continue lower to again test the lilac trend line, or to end about 2,651. A new low now below 2,700.68 would indicate this is likely.
Pullbacks are an opportunity to join the trend. An upwards trend is expected to develop, which has very strong support from new all time highs from the AD line and On Balance Volume.
Always practice good risk management. Always trade with stops and invest only 1-5% of equity on any one trade.
New updates to this analysis are in bold.
The biggest picture, Grand Super Cycle analysis, is here.
Last historic analysis with monthly charts is here, video is here.
ELLIOTT WAVE COUNT
WEEKLY CHART
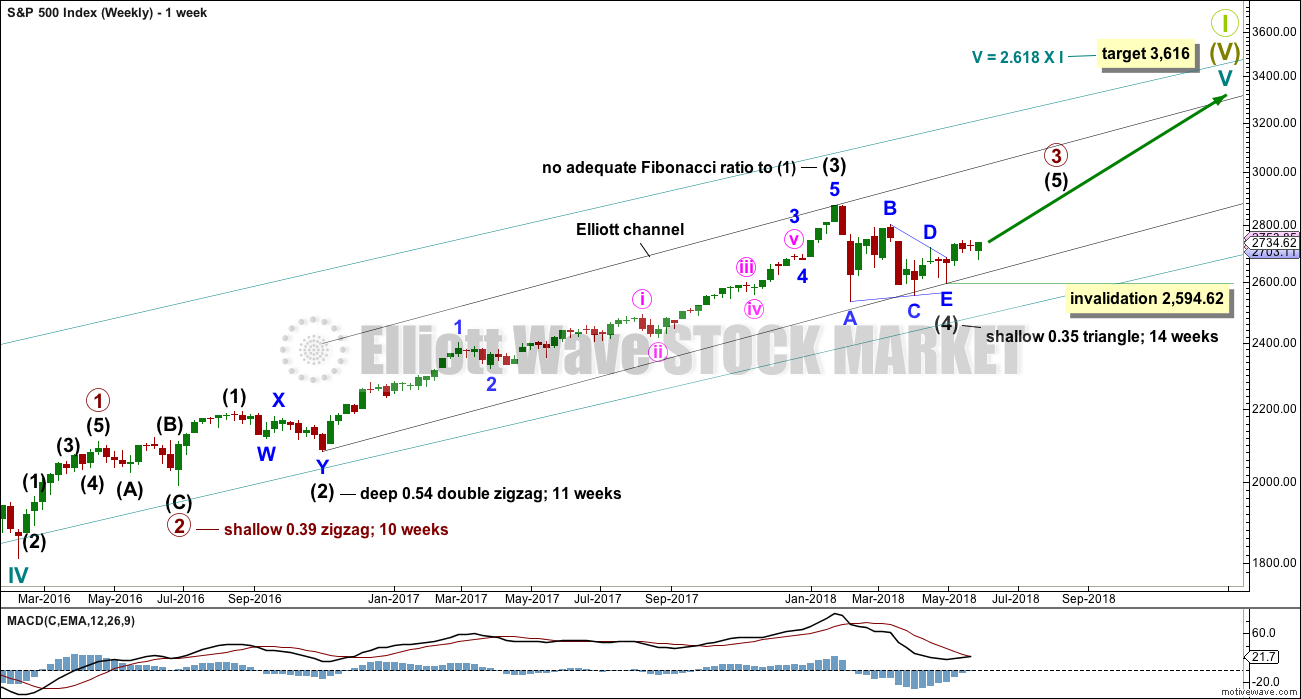
Cycle wave V must complete as a five structure, which should look clear at the weekly chart level and also now at the monthly chart level. It may only be an impulse or ending diagonal. At this stage, it is clear it is an impulse.
Within cycle wave V, the third waves at all degrees may only subdivide as impulses.
Intermediate wave (4) has breached an Elliott channel drawn using Elliott’s first technique. The channel is redrawn using Elliott’s second technique: the first trend line from the ends of intermediate waves (2) to (4), then a parallel copy on the end of intermediate wave (3). Intermediate wave (5) may end either midway within the channel, or about the upper edge.
Intermediate wave (4) may now be a complete regular contracting triangle lasting fourteen weeks, one longer than a Fibonacci thirteen. There is perfect alternation and excellent proportion between intermediate waves (2) and (4).
If intermediate wave (4) were to continue further as either a flat or combination, both possibilities would require another deep pullback to end at or below 2,532.69. With both On Balance Volume and the AD line making new all time highs, that possibility looks extremely unlikely.
If intermediate wave (4) were to continue further, it would now be grossly disproportionate to intermediate wave (2). Both classic technical analysis and Elliott wave analysis now suggest these alternate ideas should be discarded based upon a very low probability.
Within intermediate wave (5), no second wave correction may move beyond the start of its first wave below 2,594.62.
DAILY CHART
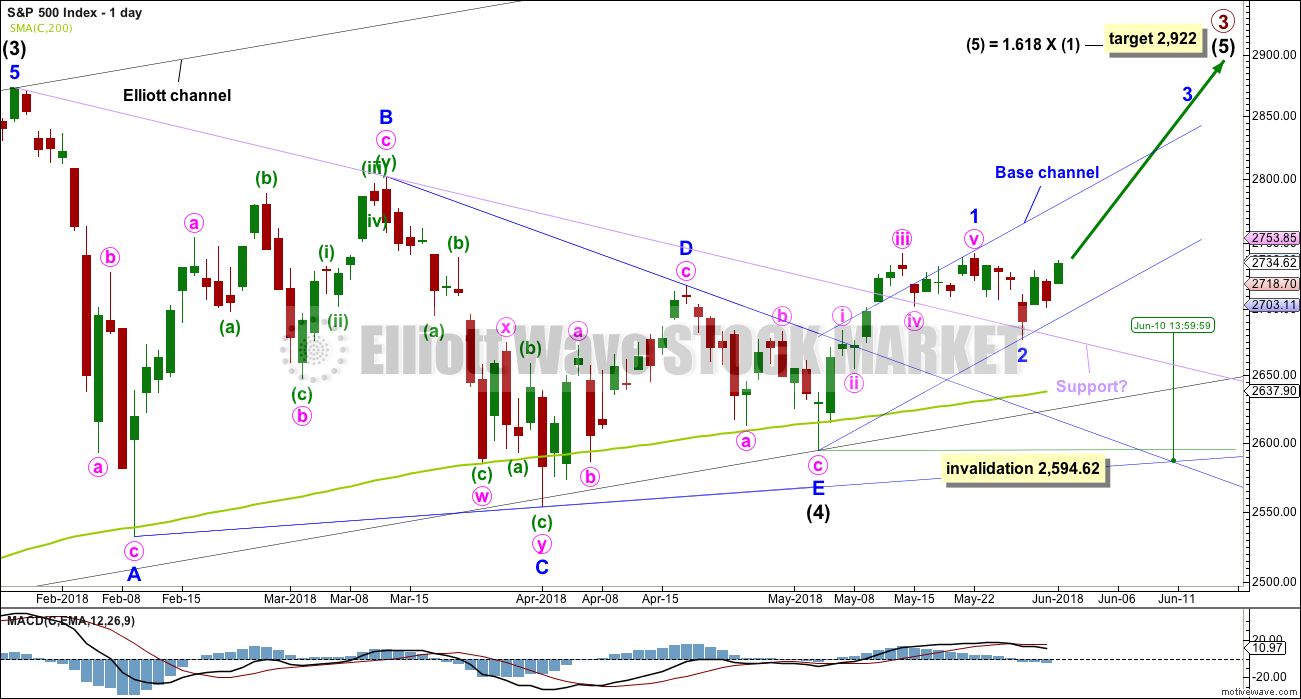
It is possible that intermediate wave (4) is a complete regular contracting triangle, the most common type of triangle. Minor wave E may have found support just below the 200 day moving average and ending reasonably short of the A-C trend line. This is the most common look for E waves of triangles.
Intermediate wave (3) exhibits no Fibonacci ratio to intermediate wave (1). It is more likely then that intermediate wave (5) may exhibit a Fibonacci ratio to either of intermediate waves (1) or (3). The most common Fibonacci ratio would be equality in length with intermediate wave (1), but in this instance that would expect a truncation. The next common Fibonacci ratio is used to calculate a target for intermediate wave (5) to end.
Price has clearly broken out above the upper triangle B-D trend line. This indicates that it should now be over if the triangle is correctly labelled.
A trend line in lilac is added to this chart. It is the same line as the upper edge of the symmetrical triangle on the daily technical analysis chart. Price has found support about this line at the last two small swing lows. The suppport at this line has reasonable technical significance now that it has been tested twice, and this line should be assumed to continue to provide support until proven otherwise.
Sometimes the point at which the triangle trend lines cross over sees a trend change. A trend change at that point may be a minor one or a major one. That point is now about the 10th of June.
Minor wave 3 may only subdivide as an impulse, and within it the subdivisions of minute waves ii and iv may show up as one or more red daily candlesticks or doji. So far the last red daily candlestick may be minute wave ii.
HOURLY CHART
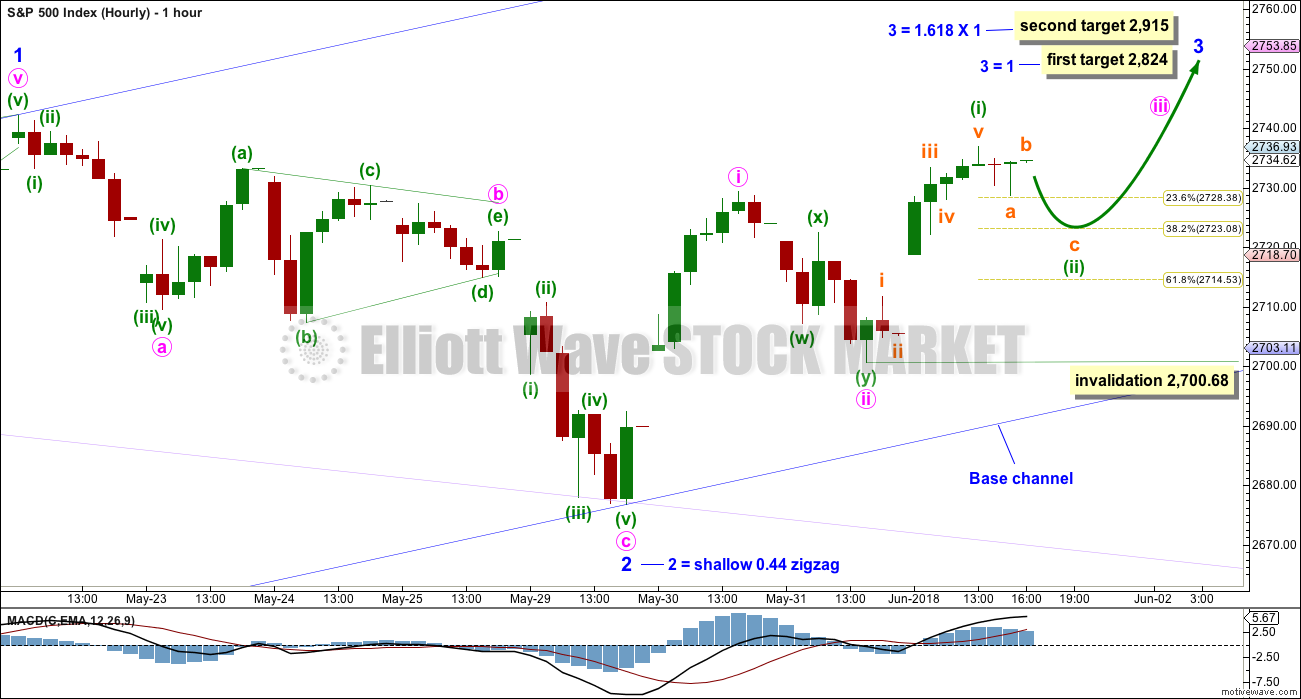
Minor wave 2 may be a complete zigzag. There is no adequate Fibonacci ratio between minute waves a and c.
The daily chart is on a semi-log scale. This hourly chart is on an arithmetic scale, and this is why the lilac trend line sits slightly differently on each chart. On this hourly chart, price perfectly found support at the lilac trend line. Minor wave 2 ends with a strong bullish engulfing candlestick pattern.
A base channel is added to minor waves 1 and 2: draw the first trend line from the start of minor wave 1 on the low of the 3rd of May, to the end of minor wave 2, then place a parallel copy on the end of minor wave 1. Corrections should find support about the lower edge of this base channel as minor wave 3 unfolds along the way up.
Minor wave 2 was relatively shallow, less than 0.5 of minor wave 1. Look out for corrections now within minor wave 3 to possibly be more shallow than otherwise expected. For this reason the preferred target for minuette wave (ii) may be the 0.382 Fibonacci ratio of minuette wave (i).
There may be almost complete three first and second waves. If this wave count is correct, then next week may see an increase in upwards momentum.
Two targets are given for minor wave 3 to end, and both fit with the higher target for primary wave 3 to end on the daily chart. If price keeps on rising after the first target has been reached, or the structure is incomplete, then the second target will be used.
FIRST ALTERNATE HOURLY CHART
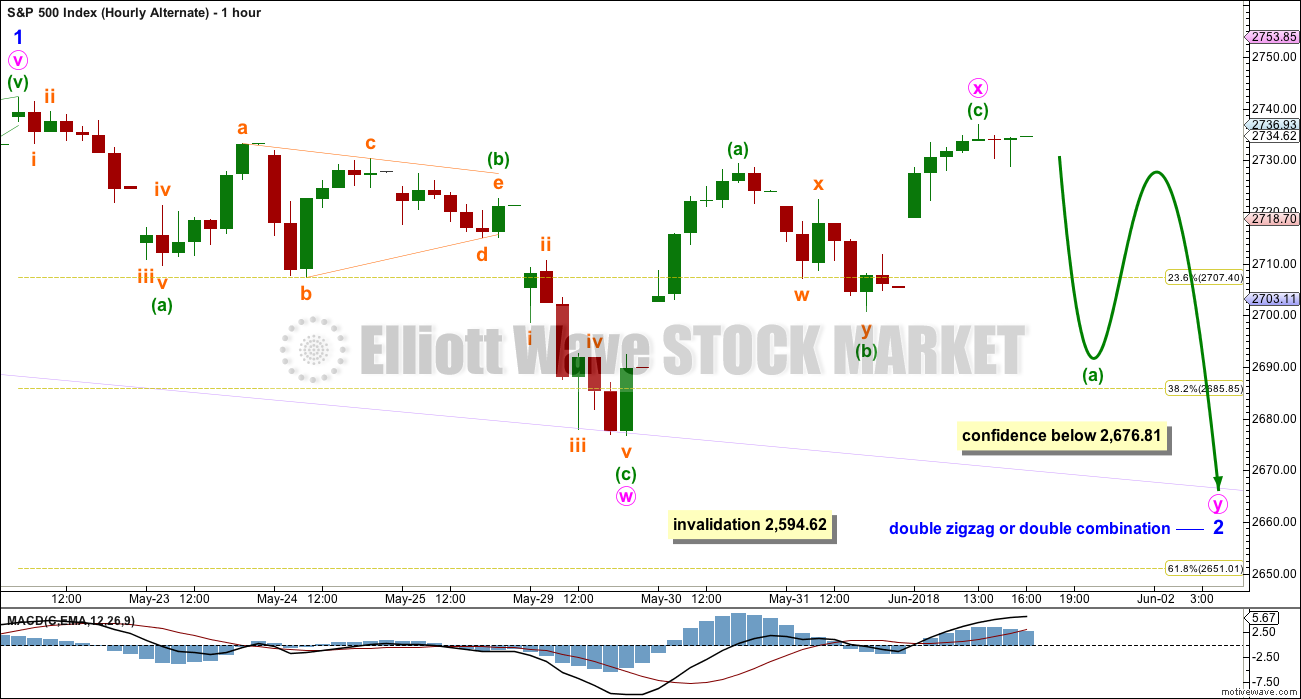
Minor wave 2 may be continuing lower as a double zigzag or sideways as a double combination. The double may be joined by a complete three in the opposite direction, a zigzag labelled minute wave x, which moved higher on Friday. If minor wave 2 is a double zigzag, then minute wave y within it should deepen the correction to achieve its purpose, ending below minute wave w at 2,676.81; note that it may find support about the lilac trend line. If minor wave 2 is a double combination, then minute wave y may be a flat or triangle, moving price sideways and ending close to the same level as minute wave w at 2,676.81.
If the target at the 0.618 Fibonacci ratio is wrong, it may still be too low. The lilac trend line has so far offered strong support, and it may continue to do so. If price moves lower to again touch this trend line, and if minute wave y that may be complete, then it may end there.
Minor wave 2 may not move beyond the start of minor wave 1 below 2,594.62.
SECOND ALTERNATE HOURLY CHART
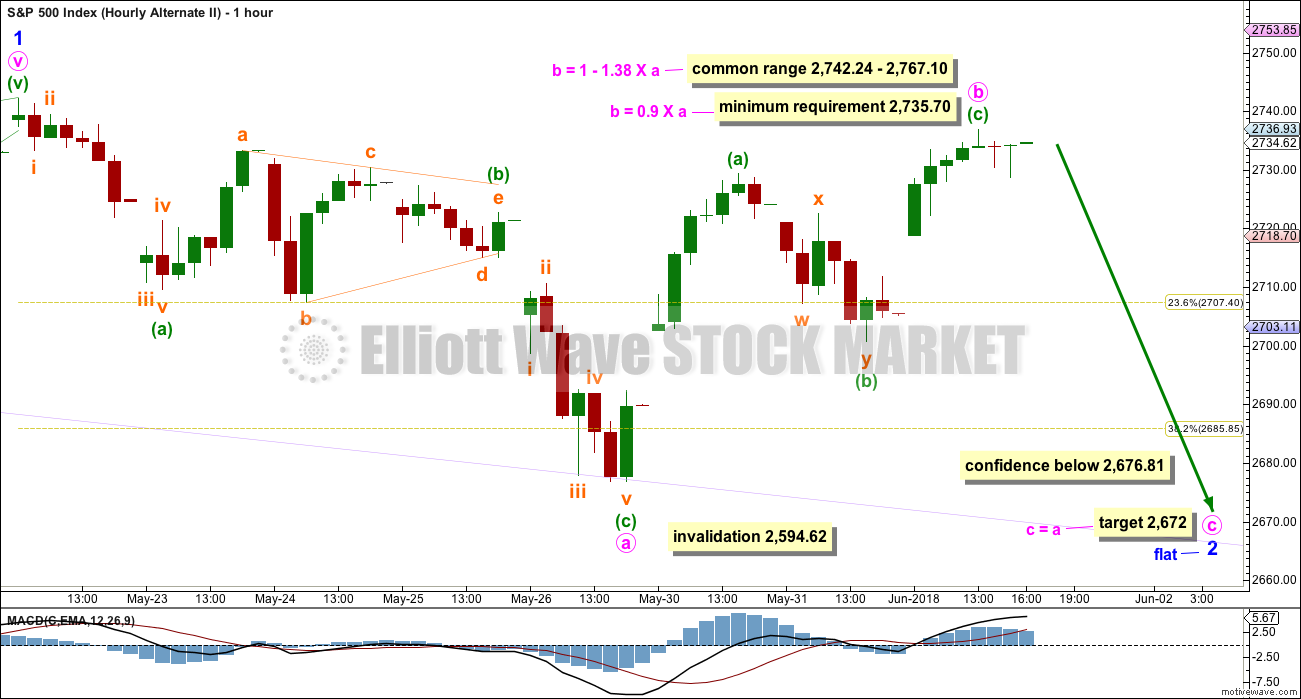
Minor wave 2 may be continuing further as a flat correction, and within it minute wave a may be a complete three, a double zigzag. Minute wave b may now also be a complete three, a zigzag, meeting the minimum requirement of a 0.9 length of minute wave a. If minute wave b is over at Friday’s high, then it would be a 0.92 length of minute wave a, which indicates a regular flat correction. Regular flats most commonly exhibit C waves that are about even in length with their A waves, so a target for minute wave c is calculated to expect this most common tendency.
This wave count would see minor wave 2 continue further for several days.
It is possible still that minute wave b could continue higher. If it does, a flat correction would remain valid. If upwards movement continues and exhibits reasonable weakness, then this wave count may then be favoured.
TECHNICAL ANALYSIS
WEEKLY CHART
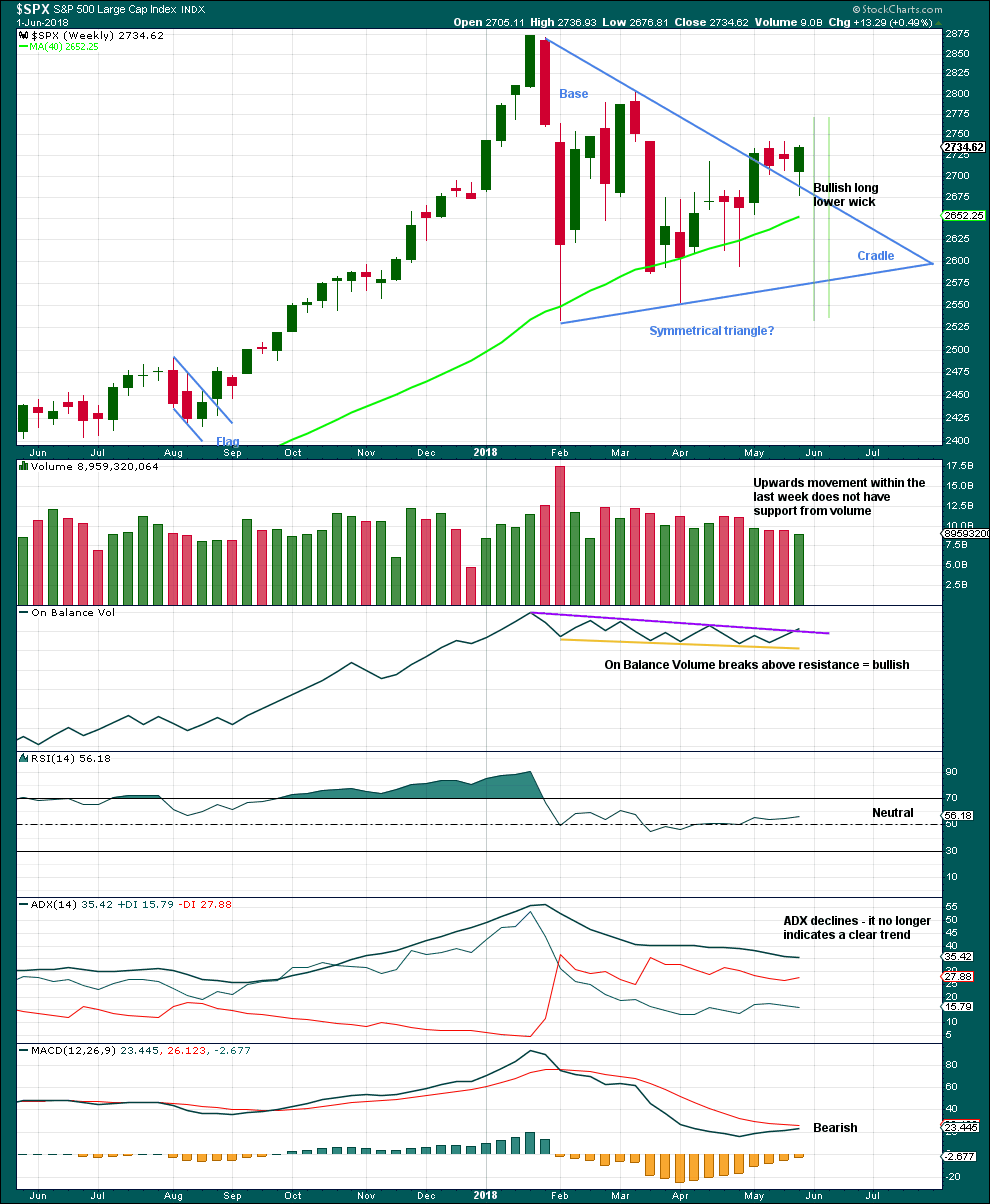
Click chart to enlarge. Chart courtesy of StockCharts.com.
From Dhalquist and Kirkpatrick on trading triangles:
“The ideal situation for trading triangles is a definite breakout, a high trading range within the triangle, an upward-sloping volume trend during the formation of the triangle, and especially a gap on the breakout.”
For this example, the breakout may have now happened. There was a high trading range within the triangle, but volume declined. This week may be the end of the pullback, with a long lower wick slightly overshooting the triangle trend line.
The bullish signal from On Balance Volume this week is reasonable, but really does need to be clearer for confidence. If next week continues upwards, it would be clear and then should be given reasonable weight.
DAILY CHART
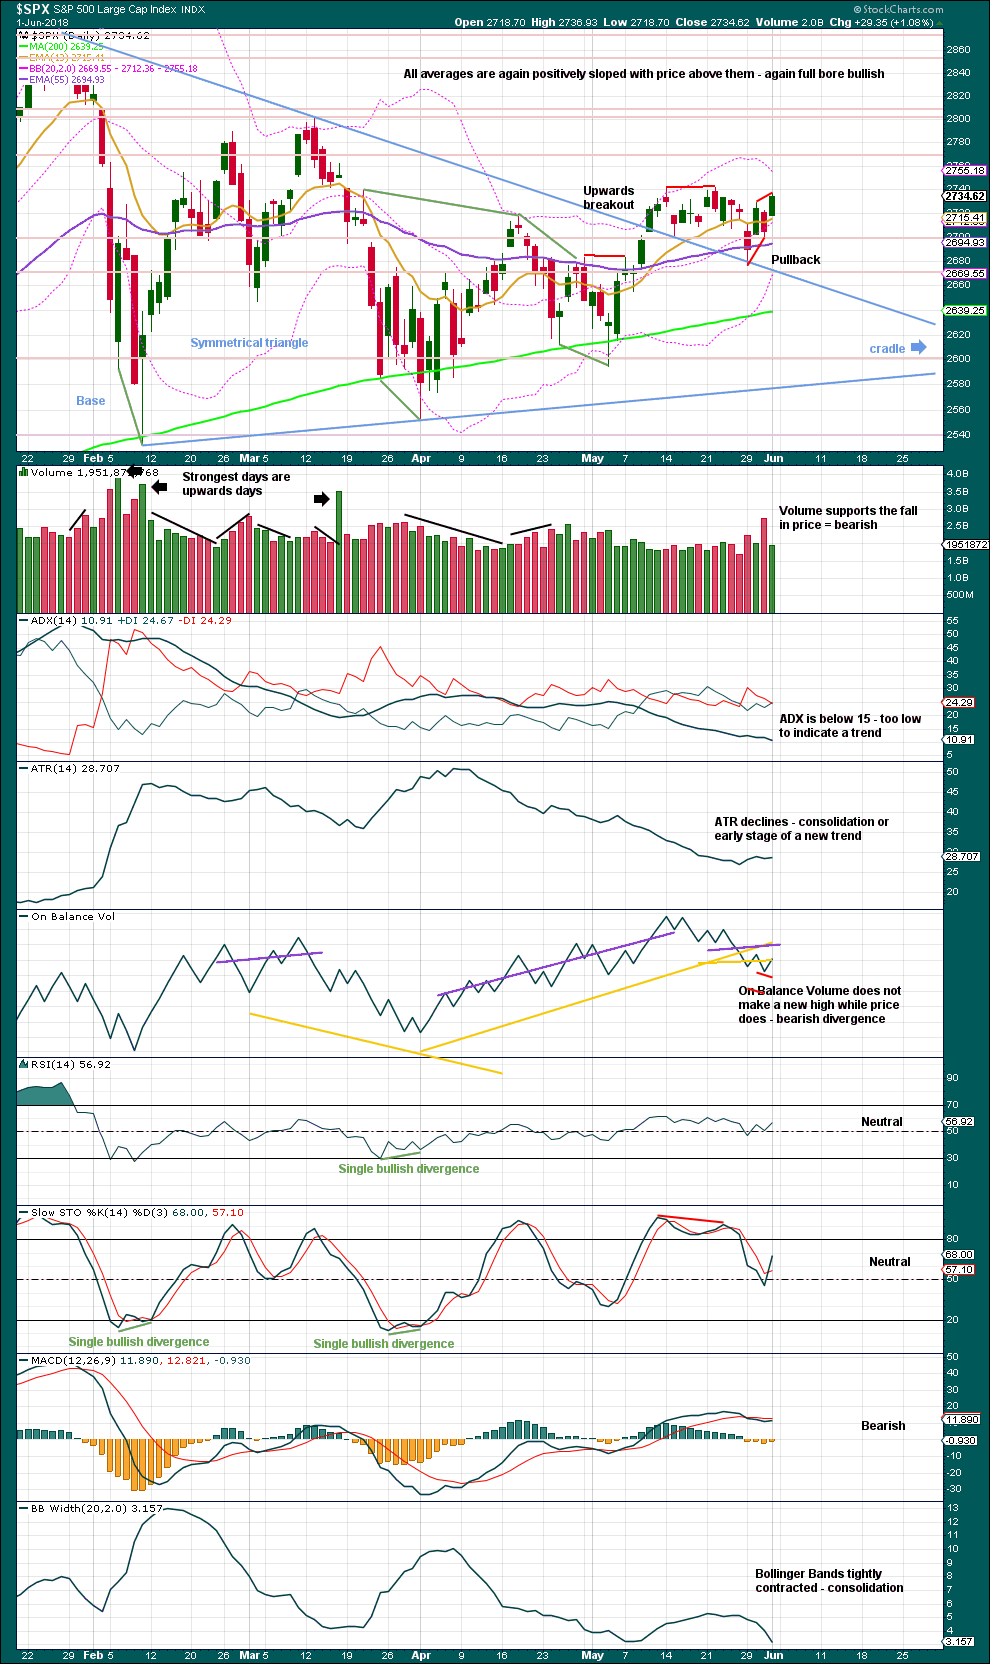
Click chart to enlarge. Chart courtesy of StockCharts.com.
The symmetrical triangle may now be complete, and price has completed an upwards breakout. There may be some small cause for concern that the upwards breakout does not have support from volume. However, in current market conditions only some small concern is had here. Rising price on light and declining volume has been a feature of this market for years, yet price continues to rise.
After an upwards breakout, pullbacks occur 59% of the time. The pullback looks typical, but it is concerning that at the end of this week there are two bearish signals at the daily chart level from On Balance Volume. On the 31st of May On Balance Volume made a slight new low, but price did not. Now on the 1st of June price has made a slight new high above the high two sessions prior, but On Balance Volume has not made a corresponding new high. This suggests the pullback may not be quite over. The triangle trend line may be tested again.
On the 14th of May On Balance Volume made a new all time high at the daily chart level. This signal remains overall very bullish.
Symmetrical triangles suffer from many false breakouts. If price returns back into the triangle, then the breakout will be considered false and the triangle trend line will be redrawn.
The base distance is 340.18. Added to the breakout point of 2,704.54 this gives a target at 3,044.72. This is above the Elliott wave target at 2,922, so the Elliott wave target may be inadequate.
VOLATILITY – INVERTED VIX CHART
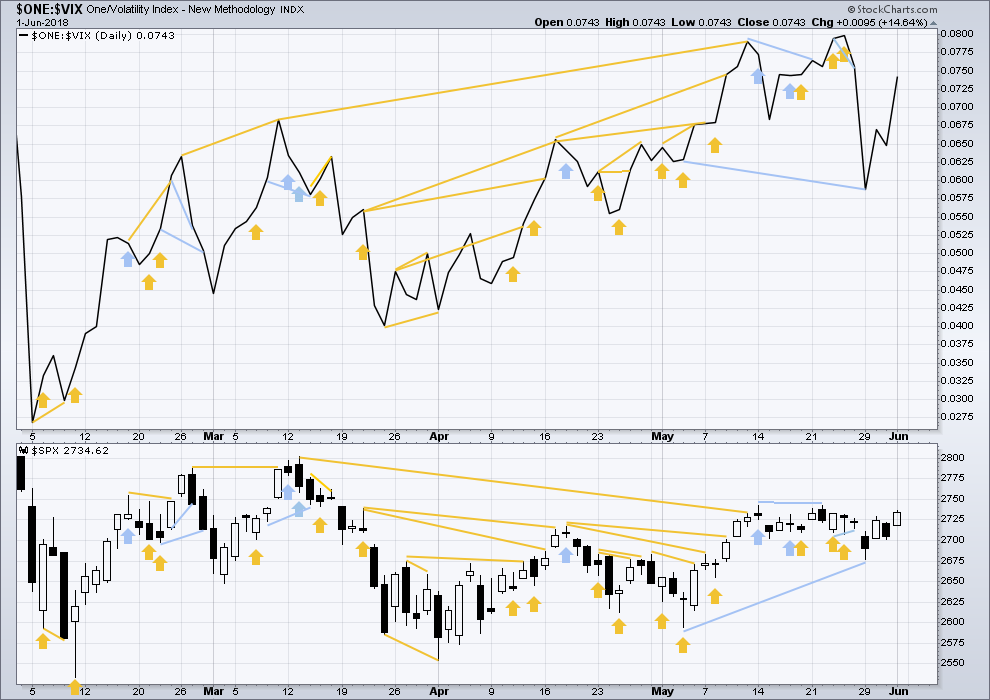
Click chart to enlarge. Chart courtesy of StockCharts.com. So that colour blind members are included, bearish signals
will be noted with blue and bullish signals with yellow.
Normally, volatility should decline as price moves higher and increase as price moves lower. This means that normally inverted VIX should move in the same direction as price.
Both price and inverted VIX moved higher on Friday. There is no new divergence.
BREADTH – AD LINE
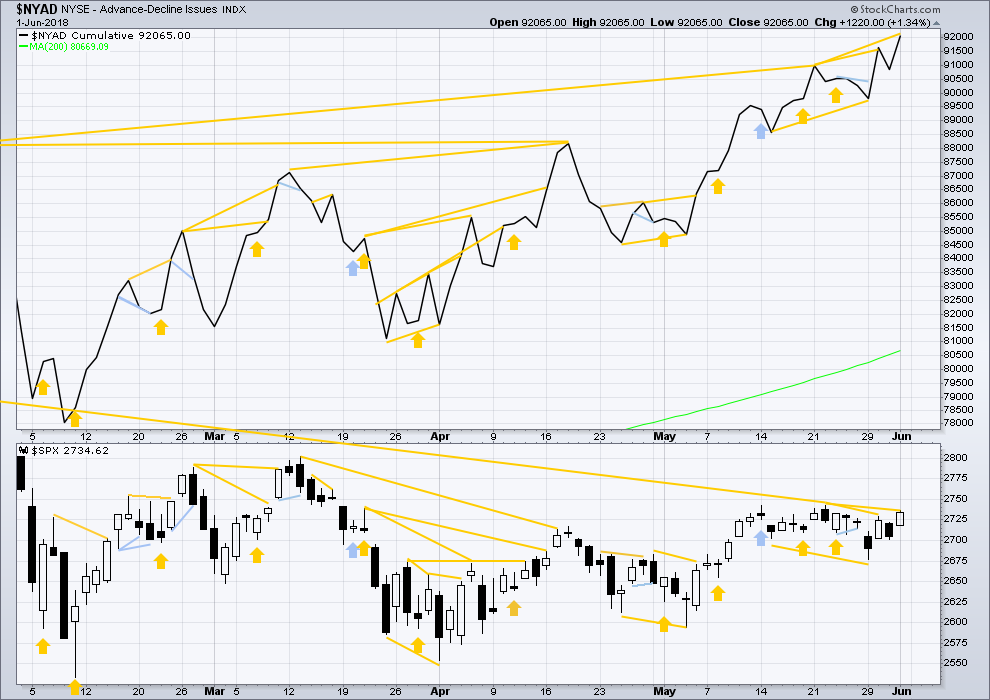
Click chart to enlarge. Chart courtesy of StockCharts.com.
There is normally 4-6 months divergence between price and market breadth prior to a full fledged bear market. This has been so for all major bear markets within the last 90 odd years. With no longer term divergence yet at this point, any decline in price should be expected to be a pullback within an ongoing bull market and not necessarily the start of a bear market. New all time highs from the AD line means that any bear market may now be an absolute minimum of 4 months away. It may of course be a lot longer than that. My next expectation for the end of this bull market may now be October 2019.
Small caps have made another new all time high, but mid and large caps have yet to do so. This divergence may be interpreted as bullish. Small caps may now be leading the market.
Breadth should be read as a leading indicator.
The AD line continues to move strongly higher to new all time highs. This is extremely bullish. While there may be some small uncertainty on short term movements, reasonable confidence may be had in the larger upwards trend. It is extremely likely that price may follow the AD line to its own new all time highs.
DOW THEORY
The following lows need to be exceeded for Dow Theory to confirm the end of the bull market and a change to a bear market:
DJIA: 23,360.29.
DJT: 9,806.79.
S&P500: 2,532.69.
Nasdaq: 6,630.67.
At this stage, only DJIA has made a new major swing low. DJT also needs to make a new major swing low for Dow Theory to indicate a switch from a bull market to a bear market. For an extended Dow Theory, which includes the S&P500 and Nasdaq, these two markets also need to make new major swing lows.
Charts showing each prior major swing low used for Dow Theory may be seen at the end of this analysis here.
Published @ 03:33 a.m. EST on 2nd June, 2018.

Just an FYI, there are multiple turn windows between June 04 to June 07. This would imply turn down for major markets with low expected into mid July. Let’s see how that plays as I did pick some shorts today.
Why couldn’t it be a turn up instead of down?
Turn dates are suggesting change in trend. Since we are in upward trend, the next change will be downward move.
Updated hourly chart:
On the five minute chart minuette (iv) fits nicely as a small triangle which may now be complete, minuette (v) may have begun.
If this labelling is correct then minuette (iii) is shorter than minuette (i). A core EW rule states that third waves may not be the shortest. So this count has a limit for minuette wave (v) of no longer than equality in length with minuette (iii), the limit is at 2,763.92.
Minute wave iii therefore has a limit at 2,762.92. Minute iv must begin prior to this point, if this count is correct.
That would allow minute iii to be longer than minute i, and so minute v would not be limited.
I hope that makes sense to newer members!
If our bullish count is correct, we should be seeing some real upward momentum this week. And price should not come back below 2729.34, the high of the minuette i (now exceeded by the minuette iii). I’m waiting patiently…okay not so patiently, but I’m waiting!!! I remain mildly suspicious just because. “Trust but verify” and all that.
Break from rising wedge after impulse down in ES….
Vol on sale. These people are silly…! 🙂
Selling June 13, 2018 11.0/13.00 strike VIX bull put spread for 0.35 , 200 contracts.
I just got off the phone with Schwab tech support. Apparently there are 90 symbols that are not trading at the moment. UPRO is one of them. Strangest dang thing…
Seems to be resolved now.
Impulse down off ES highs.
Exited massive SPY bear call credit spread executed at open and holding long calls ( 275) just in case I am wrong. Less than zero cost basis! That was fast!!!
Will the important and formidable gap at 2742 to 2750 dating back to March 16th be closed today? The preferred wave count has said yes. This is along with the Breath-AD line and OBV; both of which have made new ATH’s. The open has brought us right up against it. We shall see.
Minor 3 of intermediate 5 lives!!
Most traders detest triangles.
I love ’em!
The minute you get the inkling one might be unfolding, deploying credit spreads is a very powerful strategy for taking advantage of the predictable short term trend changes as each leg of the triangle unfolds. I have previously posted about this in great detail including several real time trades using the strategy so I will not bore members by repeating myself.
There are two additional obvious strategies for trading triangles that are probably more familiar. They would certainly be considered by most less complicated, if not more conservative than credit spreads.
Personally, my own view is that there is nothing more conservative than being paid to enter a trade, but I digress.
The triangle breakout can be considered when the five zig zag legs of the triangle can be clearly seen, the B/D trendline is breached by upward movement, preferably with a successful backtest, AND, the upward breach comes with an increase in volume. Some traders will also look for confirmation momentum indicators like MACD, PPO, and PMO. One approach is trade entry on upward breach of the B/D trendline via a buy-stop order, buying after a CLOSE above the D wave high, or most conservative, waiting for a successful backtest of the B/D trendline with a buy -stop order there AFTER the initial upward breach.
Clearly, it goes without saying that this all hinges on the
triangle’s being correctly labelled! More on that in a moment.
My favorite way to trade triangles is to catch the end of the E wave.
E wave reversals can be as explosive as third waves and in my opinion represent on of the most potentially lucrative set-ups in all of trading.
How does one deal with uncertainty?
In trading obviously NOTHING is ever certain, except that there WILL be losses. There are ways however to reduce uncertainty. Take the present possible triangle for example. The size and duration of this sideways coil strongly suggests that the break from it will be absolutely a rocket ship. I had drawn a potential A/C trendline with a contingency buy order just above to try and catch the end of E, but never got fillled. I have a certain % above that line that I have found works almost perfectly in catching the turn.
In addition to the brevity of E, the low volume of the last movement up was something unexpected. I had long calls from old credit spreads which I decided to exit due to other bearish signs on Friday.
Did I miss the turn?
Possibly.
The target for upwards movement now makes it easy fo me to patiently wait for a close aboce the critical pivot of 2750 to get positioned for the move higher.
Have a great trading week everyone!
Gold (GLD here) is fairly well set up. May not go…but it’s set up. 5 wave down on daily, initiation of what could be a 1-2 back up. Tons of energy showing at ALL time frames, monthly, weekly and daily (only daily shown here). I’m waiting for the combination of the trend line break and the polarity inversion (a higher high after what could be a higher low, i.e. the bottom of the minuette ii). I will stop on any/all positions on any break of the current lows. I will also be quick to take 1/2 profit and de-risk the trade: it is counter-trend (neutral at monthly/weekly, down at daily) and counter-momentum (down in every timeframe). So I have some concern that any pop up here might be short lived.
A 4 time frame view of SPX, monthly, weekly, daily, hourly clockwise from the top left focused on trend.
The monthly trend never broke stride through the intermediate 4 and stayed “up” throughout. And just this last month moved from “mild up” to “strongly up”. It’s against this context that we have to interpret lower tf action. The weekly is still showing a mild downtrend, but appears ready to roll to neutral with any further upward movement. The daily has just moved from down to neutral and will also switch to up with any further rise. The hourly is up. Trend changes start at the smallest time frames and work their way up. You can see the process in mid stride (early mid-stride) right here. The situation is extremely bullish as I see it based on this evidence.
Also note the tremendous fractal energy reading on the monthly. That’s fuel for price expansion, and everything about the charts screams expansion upward.
Not to say there isn’t more minor 2 coming next week. But the bigger picture of this trend view points strongly up, in line with Lara’s weekly level EW roadmap.
I use a combination of CCI and ADX to generate the trend readings.
here’s a better close up view. The up/down arrows show price breaks of the recent pivot support/resistance prices.
The price action out of the presumed completed triangle does give me pause. Fourth wave triangles are penultimate waves, with a very distinct characteristic, and that is a very sharp reversal off the completed E wave. The size and duration of this coil suggests to me that its conclusion should have seen a much more powerful upward trajectory. Often the tag of the top boundary of the triangle occurs intraday, with an even more energetic bounce off it upwards. My experience with triangles is akin to my experience with third waves. If it is presumed a triangle and there is any doubt about the E wave’s completion, it is possible that one or both are not true.
I eyeballed some cycle analysis on an SPX weekly, and without any tweeking took a look at the result on the daily, and this is what came up. It’s kind of interesting, and as I assess it rather bullish.
The big cycle is past it’s 1/2 way point…but in strong up trends there’s commonly “right translation”, with the price peak of the cycle coming very late or even hardly at all. Supporting this possibility are the two smaller cycle states, both of which are in the early stages of their up trending cycle period, which is in turn consistent with the short term overall daily movement for the last several days. It appears the smaller cycles are “gearing” the right translation of the largest cycle and together should continue to drive prices upward here.
Additionally, the 21 ema provided support, though more credit may properly belong with the R3 pivot high; almost a perfect hit. The fractal energy (choppiness index) is very high; there’s juice to drive this market fast, one way or the other (and maybe both in rapid succession even). The daily trend has moved from down to finish the week at neutral, with any more up movement likely to switch it to up.
All that said, I won’t believe a word of the bull case until the market yells it at me by breaking up through the two 2742 pivots with authority!! When that happens, there could a stampede. Should price move below the S1 pivot, look out below, though as noted in another post, there’s tons of support around 2650.
Thanks Lara. Have a great weekend.
I noticed on the hourly chart that over the past few weeks we have formed an inverted head and shoulders pattern from roughly 2676 to 2740. If this is accurate and a breakout occurs, we have a rough target of 2800. However, I tend to agree that inverted H&S patterns come at the conclusion of a down trend. Since the past few weeks have been a sideways consolidation, the H&S pattern is suspect.