
Both VIX and the AD line today give the same signal, suggesting the direction for tomorrow.
Summary: A short term Elliott wave target is 2,744. A short term classic analysis target is 2,811. At about one of these points a small consolidation or pullback may be expected.
For the short term, divergence today between price and VIX and the AD line suggests a downwards day tomorrow. A target would be about 2,651, finding support about the upper edge of the triangle trend line.
The long to mid term Elliott wave target is at 2,922, and a classic analysis target is now at 3,045.
Corrections are an opportunity to join the trend.
New all time highs this week, from both the AD line and On Balance Volume, give a high level of confidence to the expectation that price is likely to follow through to new all time highs.
Always practice good risk management. Always trade with stops and invest only 1-5% of equity on any one trade.
New updates to this analysis are in bold.
The biggest picture, Grand Super Cycle analysis, is here.
Last historic analysis with monthly charts is here. Video is here.
An alternate idea at the monthly chart level is given here at the end of this analysis.
An historic example of a cycle degree fifth wave is given at the end of the analysis here.
ELLIOTT WAVE COUNT
WEEKLY CHART
Click chart to enlarge.
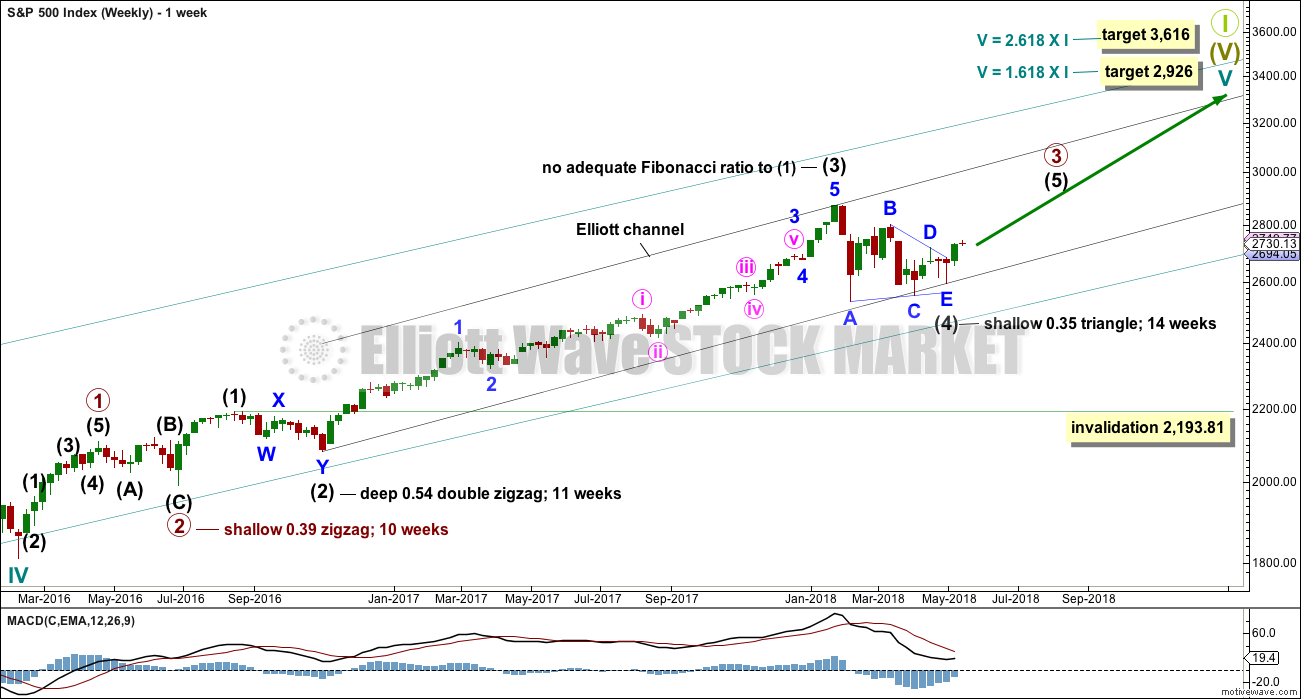
Cycle wave V must complete as a five structure, which should look clear at the weekly chart level. It may only be an impulse or ending diagonal. At this stage, it is clear it is an impulse.
Within cycle wave V, the third waves at all degrees may only subdivide as impulses.
Intermediate wave (4) has breached an Elliott channel drawn using Elliott’s first technique. The channel is redrawn using Elliott’s second technique: the first trend line from the ends of intermediate waves (2) to (4), then a parallel copy on the end of intermediate wave (3). Intermediate wave (5) may end either midway within the channel, or about the upper edge.
Intermediate wave (4) may now be a complete regular contracting triangle lasting fourteen weeks, one longer than a Fibonacci thirteen. There is perfect alternation and excellent proportion between intermediate waves (2) and (4).
If intermediate wave (4) were to continue further as either a flat or combination, both possibilities would require another deep pullback to end at or below 2,532.69. With both On Balance Volume and the AD line making a new all time highs, that possibility looks extremely unlikely.
If intermediate wave (4) were to continue further, it would now be grossly disproportionate to intermediate wave (2). Both classic technical analysis and Elliott wave analysis now suggest these alternate ideas should be discarded based upon a very low probability.
DAILY CHART
Click chart to enlarge.
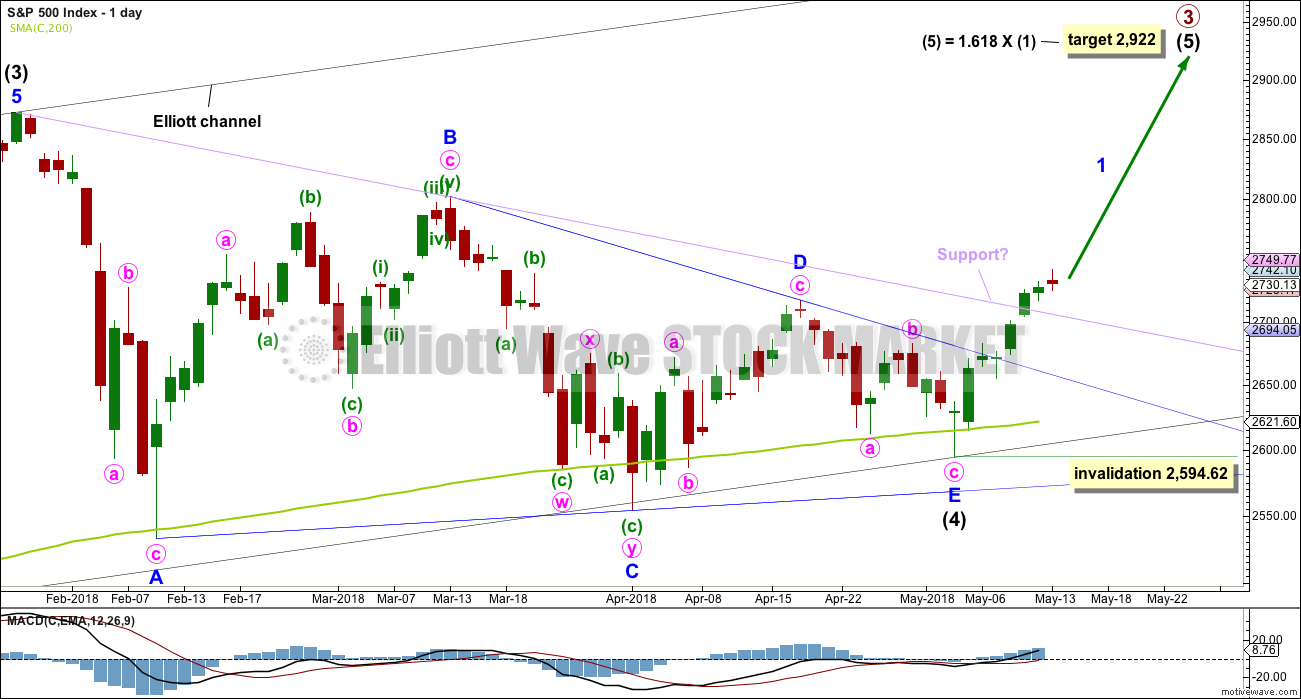
It is possible that intermediate wave (4) is a complete regular contracting triangle, the most common type of triangle. Minor wave E may have found support just above the 200 day moving average and ending reasonably short of the A-C trend line. This is the most common look for E waves of triangles.
Intermediate wave (3) exhibits no Fibonacci ratio to intermediate wave (1). It is more likely then that intermediate wave (5) may exhibit a Fibonacci ratio to either of intermediate waves (1) or (3). The most common Fibonacci ratio would be equality in length with intermediate wave (1), but in this instance that would expect a truncation. The next common Fibonacci ratio is used to calculate a target for intermediate wave (5) to end.
Price has clearly broken out above the upper triangle B-D trend line. This indicates that it should now be over if the triangle is correctly labelled.
A resistance line in lilac is added to this chart. It is the same line as the upper edge of the symmetrical triangle on the daily technical analysis chart. Upwards movement has sliced cleanly through this line, finding no resistance before breaking it. This line may offer some support for any pullbacks.
Sometimes the point at which the triangle trend lines cross over sees a trend change. A trend change at that point may be a minor one or a major one. That point is now about the 5th of June.
FIRST HOURLY CHART
Click chart to enlarge.
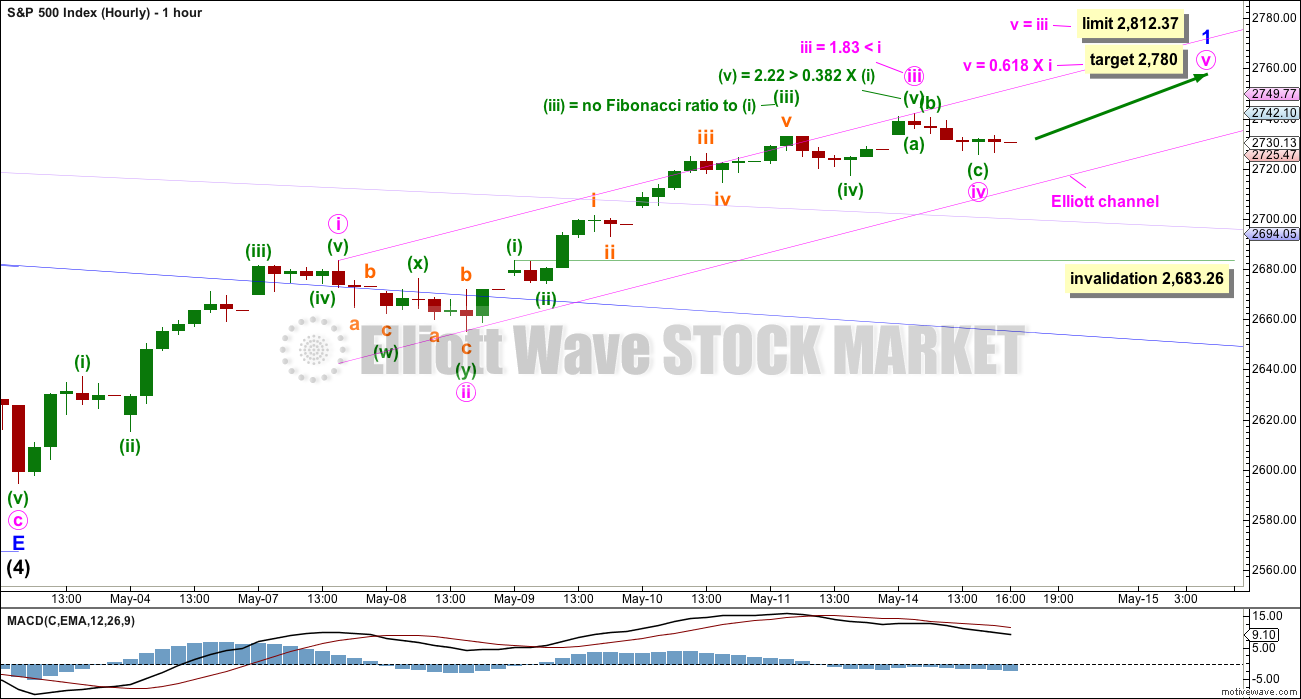
Intermediate wave (5) must subdivide as either an impulse or an ending diagonal. An impulse is much more common and that shall be how this is labelled, until price shows otherwise.
So far minor wave 1 may be incomplete and subdividing as an impulse.
Within minor wave 1, minute waves i, ii, iii and now iv may all be complete. Only minute wave v upwards may now be needed to complete a five wave impulse. However, minute wave iii is slightly shorter than minute wave i, so minute wave v is limited to no longer than equality in length with minute wave iii (so that the core Elliott wave rule stating a third wave may never be the shortest is met).
Redraw the channel about upwards movement as shown using Elliott’s first technique. If minute wave iv continues sideways and lower when markets open tomorrow, then it should find support about the lower edge of this channel. Minute wave iv may not move into minute wave i price territory below 2,683.26.
If minute wave iv moves lower, then the target of minute wave v to end must also move correspondingly lower.
SECOND HOURLY CHART
Click chart to enlarge.
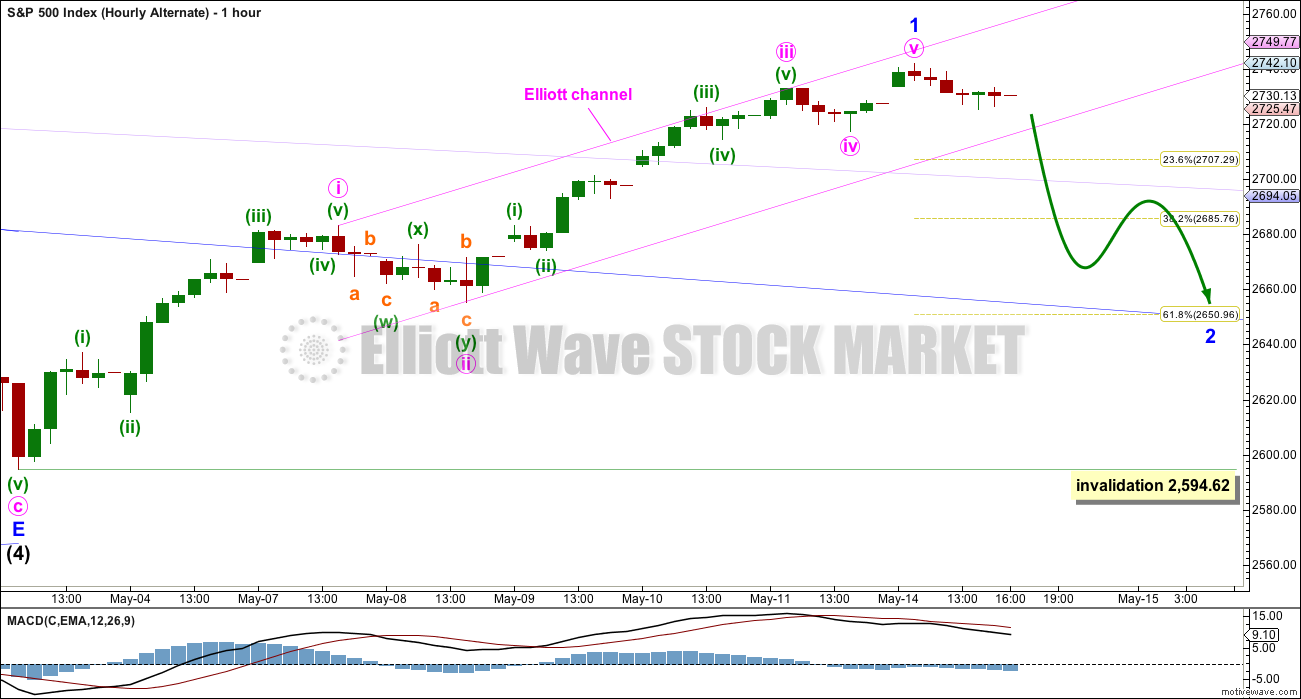
It is also possible today that minor wave 1 is a complete five wave impulse. The middle portion of minuette wave (iii) does not have as good a look for this wave count as the first wave count, but the S&P does not always have good looking impulses.
This second hourly wave count today has support from classic technical analysis. Bearish divergence between price and VIX and the AD line suggests a pullback about here.
Minor wave 1 may have lasted seven days. Minor wave 2 may be expected to last about three to eight days to have reasonable proportion to minor wave 1. Targets for minor wave 2 may be the 0.382 and 0.618 Fibonacci ratios, with the 0.618 Fibonacci ratio slightly favoured, which is also where price may find support: at the blue triangle trend line copied over from the daily chart.
TECHNICAL ANALYSIS
WEEKLY CHART
Click chart to enlarge. Chart courtesy of StockCharts.com.
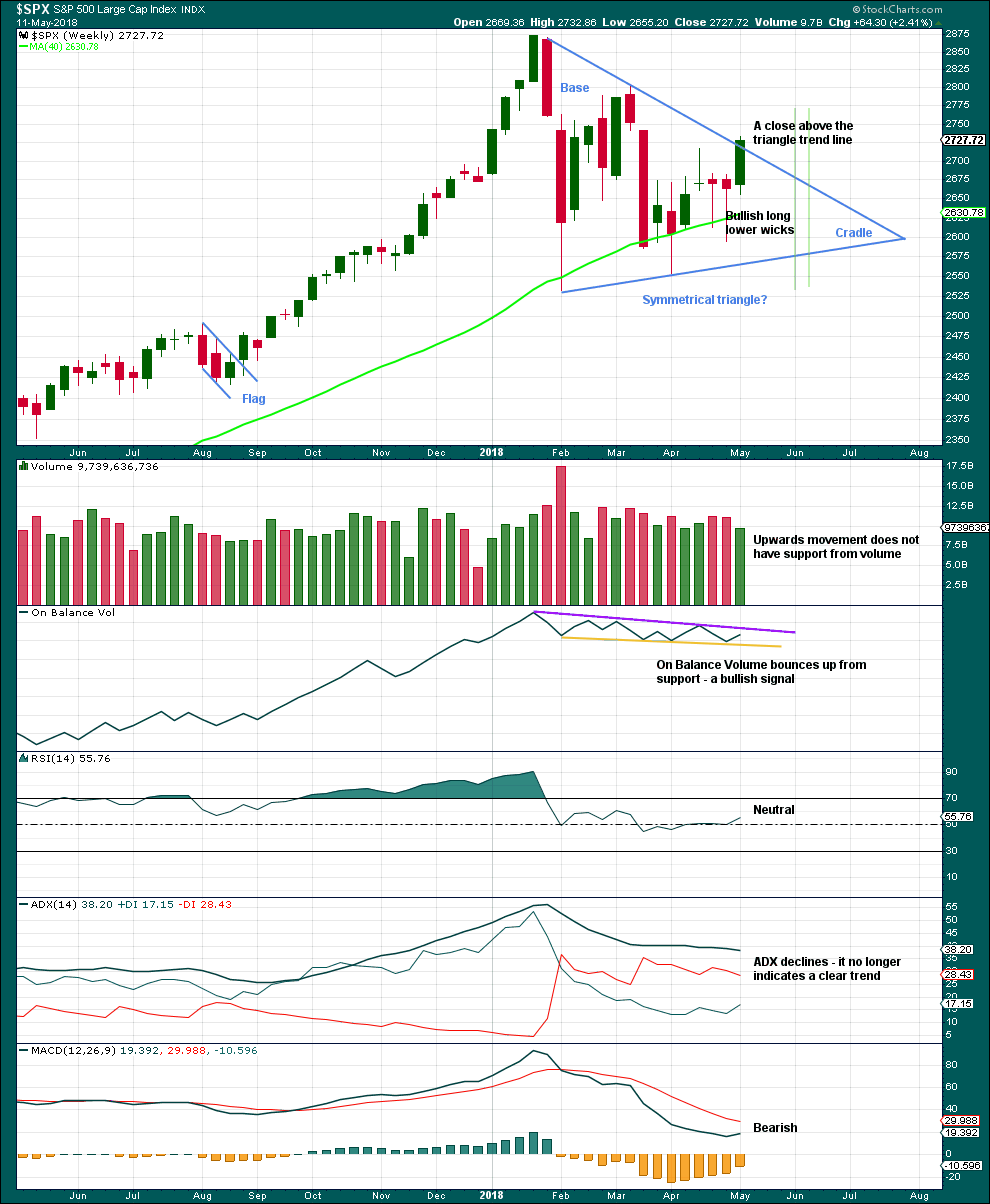
A classic symmetrical triangle pattern may be forming. These are different to Elliott wave triangles. Symmetrical triangles may be either continuation or reversal patterns, while Elliott wave triangles are always continuation patterns and have stricter rules.
The vertical green lines are 73% to 75% of the length of the triangle from cradle to base, where a breakout most commonly occurs.
From Dhalquist and Kirkpatrick on trading triangles:
“The ideal situation for trading triangles is a definite breakout, a high trading range within the triangle, an upward-sloping volume trend during the formation of the triangle, and especially a gap on the breakout.”
For this example, the breakout may have happened last week. There is a high trading range within the triangle, but volume is declining.
DAILY CHART
Click chart to enlarge. Chart courtesy of StockCharts.com.
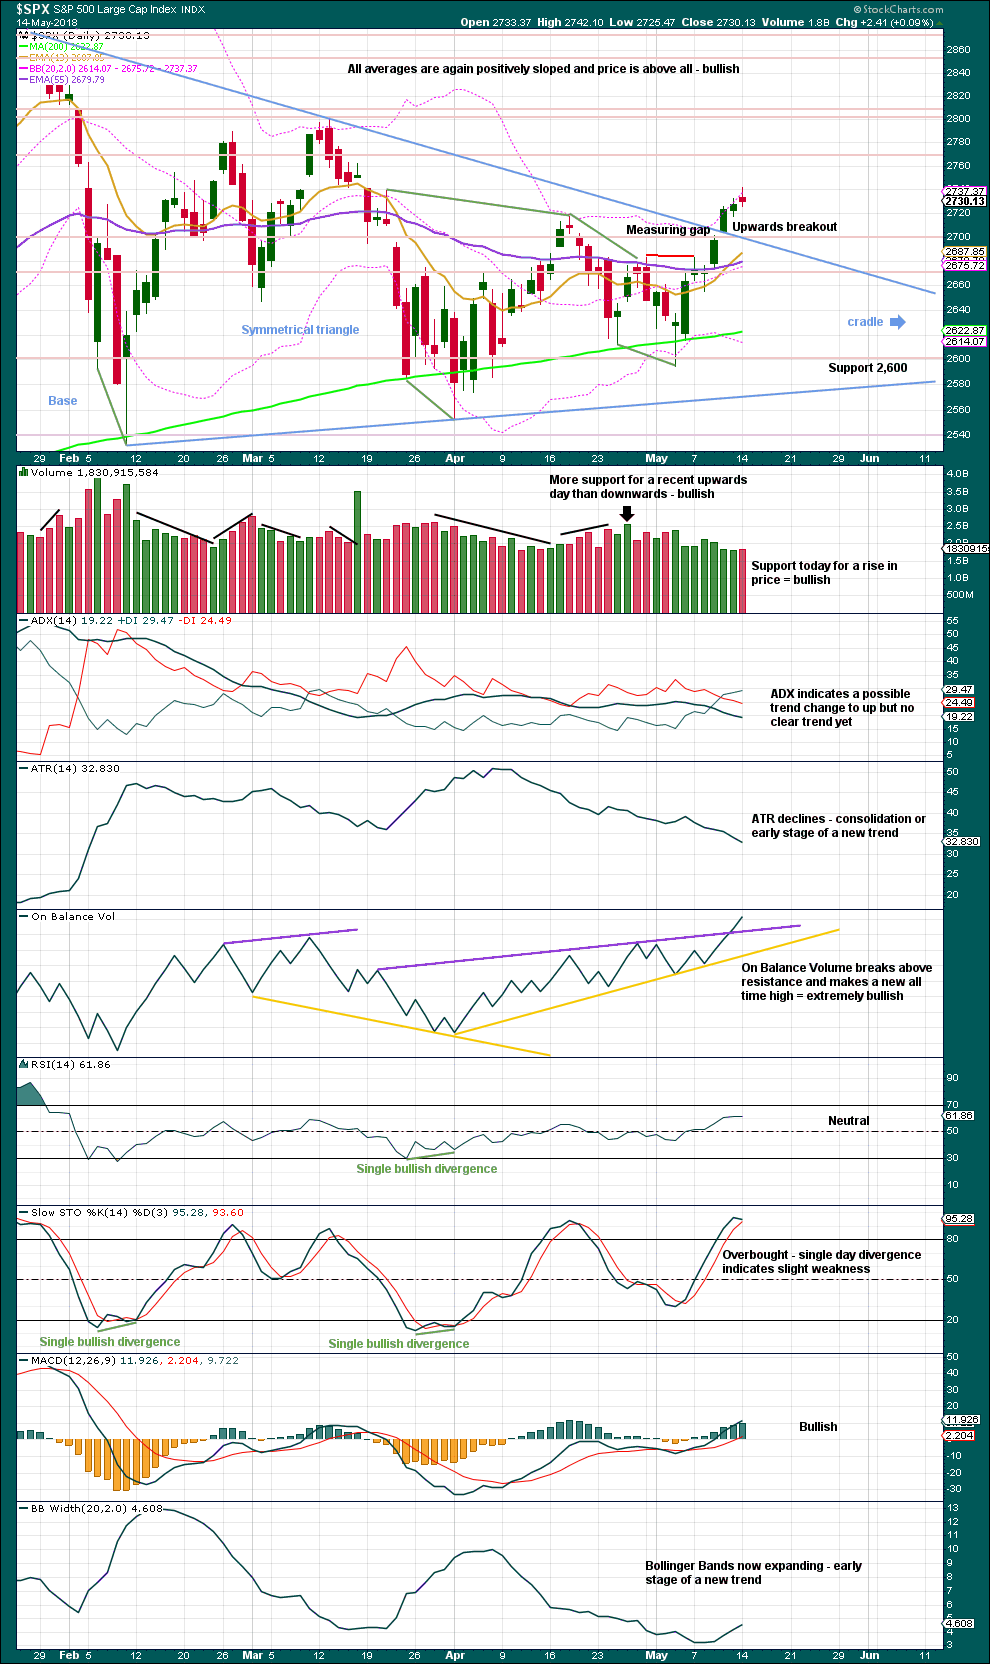
The symmetrical triangle may now be complete, and price has completed an upwards breakout. There may be some small cause for concern that the upwards breakout does not have support from volume. However, in current market conditions only some small concern is had here. Rising price on light and declining volume has been a feature of this market for many months, yet price continues to rise.
After an upwards breakout, pullbacks occur 59% of the time. A pullback may find support at the upper triangle trend line and may be used as an opportunity to join a trend.
The base distance is 340.18. Added to the breakout point of 2,704.54 this gives a target at 3,044.72. This is above the Elliott wave target at 2,922, so the Elliott wave target may be inadequate.
For the short term, the next smaller consolidation or pullback may come about 2,811. This shorter term target is calculated using the measuring gap. That gap may now provide support and may be used to pull up stops on long positions.
On Balance Volume has made a new all time high, providing a very strong bullish signal; expect price to follow.
Volume supports upwards movement and On Balance Volume makes another new all time high at this time frame. This is very bullish.
VOLATILITY – INVERTED VIX CHART
Click chart to enlarge. Chart courtesy of StockCharts.com.
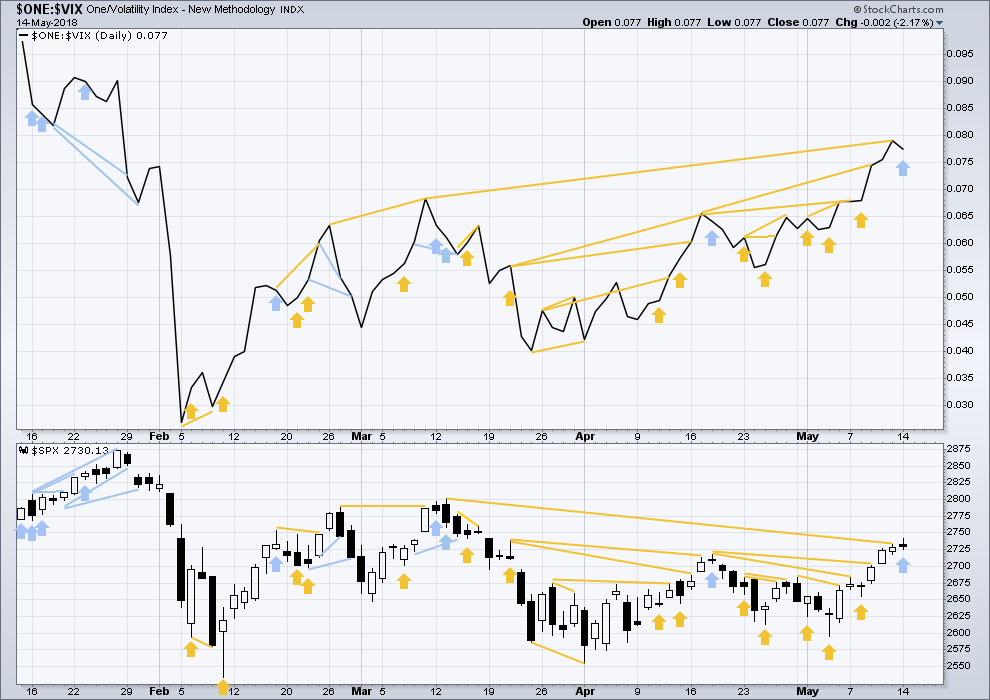
So that colour blind members are included, bearish signals will be noted with blue and bullish signals with yellow.
Normally, volatility should decline as price moves higher and increase as price moves lower. This means that normally inverted VIX should move in the same direction as price.
There is still a cluster of bullish signals on inverted VIX. Overall, this may offer support to the main Elliott wave count.
Inverted VIX is much higher than the prior swing high of the 9th / 13th March, but price is not yet. Reading VIX as a leading indicator, this divergence is bullish.
Price moved higher today, with a higher high and a higher low, but inverted VIX has moved lower. This divergence is bearish and suggests a downwards day tomorrow.
BREADTH – AD LINE
Click chart to enlarge. Chart courtesy of StockCharts.com.
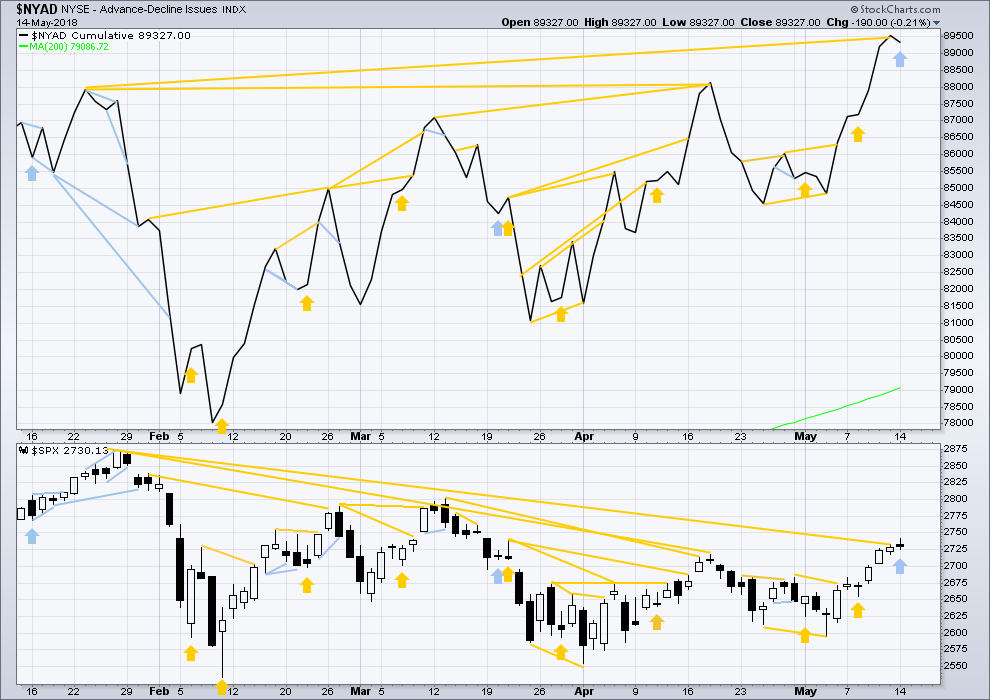
There is normally 4-6 months divergence between price and market breadth prior to a full fledged bear market. This has been so for all major bear markets within the last 90 odd years. With no longer term divergence yet at this point, any decline in price should be expected to be a pullback within an ongoing bull market and not necessarily the start of a bear market. New all time highs from the AD line means that any bear market may now be an absolute minimum of 4 months away. It may of course be a lot longer than that. My next expectation for the end of this bull market may now be October 2019.
Small caps have made a new all time high last week, but mid and large caps have yet to do so. This divergence may be interpreted as bullish. Small caps may now be leading the market.
Breadth should be read as a leading indicator.
There has been a cluster of bullish signals from the AD line in the last few weeks. This also overall offers good support to the main Elliott wave count.
The AD line has made another new all time high. This is a very strong bullish signal, and is one reason today why the more bearish Elliott wave counts are discarded. It is extremely likely now that price shall follow with a new all time high.
Price moved higher today, with a higher high and a higher low, but the AD line has declined. This divergence is bearish and suggests a downwards day tomorrow.
DOW THEORY
The following lows need to be exceeded for Dow Theory to confirm the end of the bull market and a change to a bear market:
DJIA: 23,360.29.
DJT: 9,806.79.
S&P500: 2,532.69.
Nasdaq: 6,630.67.
At this stage, only DJIA has made a new major swing low. DJT also needs to make a new major swing low for Dow Theory to indicate a switch from a bull market to a bear market. For an extended Dow Theory, which includes the S&P500 and Nasdaq, these two markets also need to make new major swing lows.
Charts showing each prior major swing low used for Dow Theory may be seen at the end of this analysis here.
Published @ 08:40 p.m. EST.
If there really is such a thing as the “smart money” phenomenon, it might as well be screaming in our faces right now. On balance volume making a new ATH yesterday, and the theme for every down day the past several weeks has been “sell the open, buy the close.”
Only for the prior 7 days Bo. And the runs up over the entire year have typically been 5-8 days (one was 10). Tones of pent up market energy, and it’s going to go…somewhere. Do not be surprised by a 2 here that takes price to 2650-2530. And we have to accept that a move like the March12-April 1 downmove of 8% or more COULD HAPPEN RIGHT HERE. It absolutely could. This market has not yet proven it’s back in the “old mode” of low volatility and consistent upward grinding. So we have to give a lot of credence to the potential of the immediate future having high commonality with the immediate past. Best of luck!
In what scenario could a 2 lead us anywhere near 2530? I don’t see how the labeling would work. As it is, the invalidation for Lara’s main count is 2683.
Never say never I guess, and sure anything could happen, but the odds say this is not a bear market, and that means a return to ATHs sooner rather than later. I was scolded here a week or two ago for implying that a breakout from the triangle might not herald a decisive move (to ATHs or bear market territory). This has been a rather long “correction”, and if it goes on much longer I think we’re going to have to start asking questions about the weekly wave count. At 16 weeks it’s already longer than any corrections in this market save for 2011 and 2015, which the main count assumes are the respective 2 and 4 of this whole bull market. 2011 itself bottomed out at merely 23 weeks. I expect if we do head back down and have a full bar close below the 200dma, Lara will have to put an alternate in play that sees the Grand Super Cycle V as already complete.
Sorry, typo, that was meant to be 2650-30. 2’s sometimes go deep.
As for “correction”, it’s a perfectly normal intermediate 4 correction. Look at the monthly level; that will put it in proper proportion. A mere blip on the ride up, really. HOWEVER, the blips start coming now at a faster rate and larger: the next will be a PRIMARY 4, and it can start up just about anytime after the market reaches a new ATH.
It absolutely can go back down to that 200 MA or below and still be a perfectly reasonable intermediate 4. “Don’t walk backwards and let the future break over your head” is how an old boss of mine once coached me. I always liked that! Have a plan for every scenario. G’luck!
interestingly (to me anyway), my stochRSI triggered LONG on the first full hourly bar of today’s session, and has NOT fired back to short. Doesn’t mean it’s not going to open down and fall like a rock tomorrow, though. In which case, my last moment SPY put’s (friday expiry) give me a little downside cash payment for the joy of watching the minor 2.
HI Kevin
As per Lara’s last update can Wave B retract 50% of the recent high and today’s low?
Thank You
It can do more than that. It could (“in the worst case”) an expanding flat correction, and the B wave will exceed the recent high. Then right back down to below today’s lows.
I think the thing to be concerned about isn’t an ABC correction here. That would be “expected”. The thing to be concerned about here is the question of whether another big ABC up is complete (start of April to middle of May), just like the ABC from mid February to mid March completed. Followed by a massive 10% selloff to the downside. IT COULD HAPPEN HERE AGAIN. That said, I fully expect “merely a 2”, but a 2 can still take price down to 2625 and have everybody going nutso, before it turns. It’s a fun time…
Thank You Kevin
So what your saying if i understand you correctly we can possibly rally above the recent high then theres that possibility that the market can then correct 10% after that?
I would agree about the 2625 level.
I suppose that’s possible Eric, but in the context of this correction (a minute 2) I was talking about it structurally possibly being an expanded flat (instead of say, a zig-zag), and if so, price could go above the high a day ago, then down again to say 2655…and everything is legit. It’s “just a 2”. A hell of a whipsaw 2, but just an expanded flat 2, nontheless.
Updated alternate hourly chart:
This downwards move looks too big to be part of the last wave up, this looks like a new wave. So it looks like minor 2 has arrived.
So far I can see a five down. Now for minute b which may bounce or move sideways. Then another five down for minute c.
A zigzag would be the most common structure for a second wave correction. Look for support at the blue and lilac triangle trend lines copied over from the daily chart. They may sit slightly differently as my daily chart is on a semi-log scale, and the hourly is arithmetic. Look at both.
Remarkable support at the TA triangle trend line. I’m not quite seeing how the wave structure of this pull-back might be labeled.
expanding flat off the first peak on May 11 (looking at 15 min tf)? just an idea.
More downside on the way. We now have a full hourly candlestick below and not touching the pink Elliott channel on the hourly charts. I think the second hourly chart will prove correct that we are now in Minor 2 headed to the targets Lara outlined, as follows:
—————————————————————————————————
“Targets for minor wave 2 may be the 0.382 and 0.618 Fibonacci ratios, with the 0.618 Fibonacci ratio slightly favoured, which is also where price may find support: at the blue triangle trend line copied over from the daily chart.”
—————————————————————————————————
I think we have completed minute a and b of a zig-zag down. Of course, Minor 2 can morph into a variety of Elliott corrective wave patterns.
Have a great day all.
Probably right. But until price drops below 2700 I’m not sold on it (though I’ve taken a defensive short), even with the break of the channel; that’s not definitive. One model of the action here is the Feb 20-22 pullback. A bit larger 4/longer 4, then the wave 5 up, just like Feb 23/26.
BTW, a possibility the combo is back in play Rodney….though I’d gladly give up the $ to see the market turn up and run!!
There is a lot of support just below. The 2700 mark as you indicate plus the triangle trendline as drawn from the January high to the Minor B high in March. In addition, the hourly chart show SPX right at the lower BB.
The retest of the TA triangle line is here. The bullish case intermediate term pretty much demands that price doesn’t keep plunging, as I see it. If it does, at the daily level the upmove we’ve viewed as a new motive wave appears as an abc up, and now price initiates another deep leg down well back into the triangle structure (probably back to the lower BB/Keltner area around 2630). The canonical “fake breakout”. It’s crux time as I see it.
The flat action in SPX and NDX suggests to me that another big sell off may be right around the corner today…I don’t like a market that “bottoms” in a flat way. Very often not a bottom at all, but merely a pause area. The small beacon of bullish hope I see is the relative strength of RUT. But it may just tumble with them all.
so iv is 4 times longer than ii now….. when do we start to think its not a iv ?
thanks in advance
Not seeing that myself. Here’s how I see it. Still a 4 unless/until it cuts below the high of the (circle) 1 at 2681.
you r correct…. i need some more coffee
Important to note that with this count, wave 3 is shorter than 1, implying 5 cannot be longer than 3. IF this is the correct count, and IF the low of the 4 is in….then the max price for completion of the 5 is….2791 I believe. Though I wouldn’t be surprised by a real shorty that ending just above 2760. THEN we get a minor 2. So overall…the current situation is only marginally bullish in the short term, and bearish in the intermediate term, per this count. If on the other hand this is the start of the minor 2…well, that speaks for itself.
At this point, this appears to be the minute 4, not the start of a minor 2. But…that said, it ain’t over until it’s over (new highs above yesterday’s). The current bounce area is in the zone of 2 fibo’s, so I think it’s a potential bottom.
It might have bottomed out, but looking at the 5-minute chart, I rather expect one more small stab down.
SPY opening gap down. Continuation of minor wave iv as expected per Lara’s analysis. Anticipating SPX support below to be either today or tomorrow.
*minute wave iv as shown on Lara’s First Hourly Chart above
It is all looking so good. And that gives me some concerns. Lara has repeatedly written,
——————————————————————————————————–
“The vertical green lines are 73% to 75% of the length of the triangle from cradle to base, where a breakout most commonly occurs.
From Dhalquist and Kirkpatrick on trading triangles:
“The ideal situation for trading triangles is a definite breakout, a high trading range within the triangle, an upward-sloping volume trend during the formation of the triangle, and especially a gap on the breakout.” ”
——————————————————————————————————-
This triangle we have as completed Intermediate 4 broke out much sooner than 73% and did so without an increase in volume or an upward sloping volume trend during the triangle. We did have gaps at the B-D line and the 0-B line.
So, I continue to have some lingering doubts. I suppose only a new ATH will confirm the triangle and erase any lingering doubts. Right now I am looking for the start and end of Minor 2 to open the second half of my long positions (long term account). My short term account is looking at other markets.
Before today’s open, SPX and Gold both look to be down sharply. Good
Your concern is warranted Rod. We have an island reversal. That is your experience talking… 🙂
Holding deep in the money bear call spreads…big trade!!
well played as usual Verne!!
US Dollar Index sharply approaching 93. VIX up slightly. Starting the day with a short position while minor wave iv continues. Watching the lower channel within Lara’s lilac base channel on the Hourly Chart.
*minute wave iv as shown on Lara’s First Hourly Chart above