Upwards movement was expected for Monday. A higher high and a higher low fits the definition of upwards movement for Monday’s session, although the range was small.
Summary: The target is now at 2,922. For the short term, be alert for the possibility that the current small consolidation could be relatively brief and shallow, and that it could even be over at today’s low.
Traders with a lower risk appetite may set stops just below Friday’s low. For those comfortable with the possibility of an underwater position for a few days, stops may be just below 2,553.80.
A more cautious approach here may be to wait for an upwards breakout above the triangle B-D trend line before entering a long position.
Always practice good risk management. Always trade with stops and invest only 1-5% of equity on any one trade.
New updates to this analysis are in bold.
The biggest picture, Grand Super Cycle analysis, is here.
Last historic analysis with monthly charts is here. Video is here.
An alternate idea at the monthly chart level is given here at the end of this analysis.
An historic example of a cycle degree fifth wave is given at the end of the analysis here.
MAIN ELLIOTT WAVE COUNT
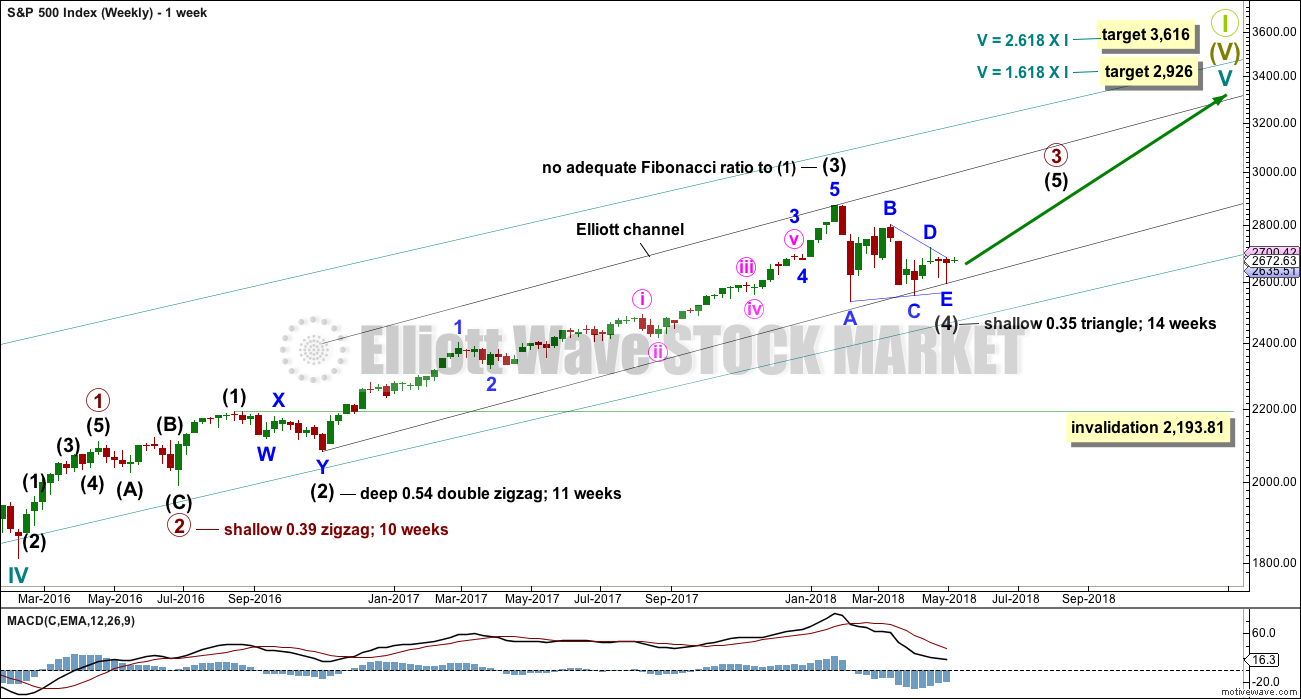
WEEKLY CHART
Cycle wave V must complete as a five structure, which should look clear at the weekly chart level. It may only be an impulse or ending diagonal. At this stage, it is clear it is an impulse.
Within cycle wave V, the third waves at all degrees may only subdivide as impulses.
Intermediate wave (4) has breached an Elliott channel drawn using Elliott’s first technique. The channel is redrawn using Elliott’s second technique: the first trend line from the ends of intermediate waves (2) to (4), then a parallel copy on the end of intermediate wave (3). Intermediate wave (5) may end either midway within the channel, or about the upper edge.
It is possible still that a low may not be in place; intermediate wave (4) could still continue further. Intermediate wave (4) may not move into intermediate wave (1) price territory below 2,193.81. However, it would be extremely likely to remain within the wider teal channel (copied over from the monthly chart) if it were to be reasonably deep. This channel contains the entire bull market since the low in March 2009, with only two small overshoots at the end of cycle wave IV. If this channel is breached, then the idea of cycle wave V continuing higher would be discarded well before the invalidation point is breached.
Intermediate wave (4) may now be a complete regular contracting triangle lasting fourteen weeks, one longer than a Fibonacci thirteen. There is perfect alternation and excellent proportion between intermediate waves (2) and (4).
At this stage, there are still three possible structures for intermediate wave (4): a triangle, a combination, and a flat correction. All three will be published. The triangle is preferred because that would see price find support about the 200 day moving average. While this average provides support, it is reasonable to expect it to continue (until it is clearly breached).
The triangle may be complete now, but the other two possibilities of a flat and combination may be incomplete.
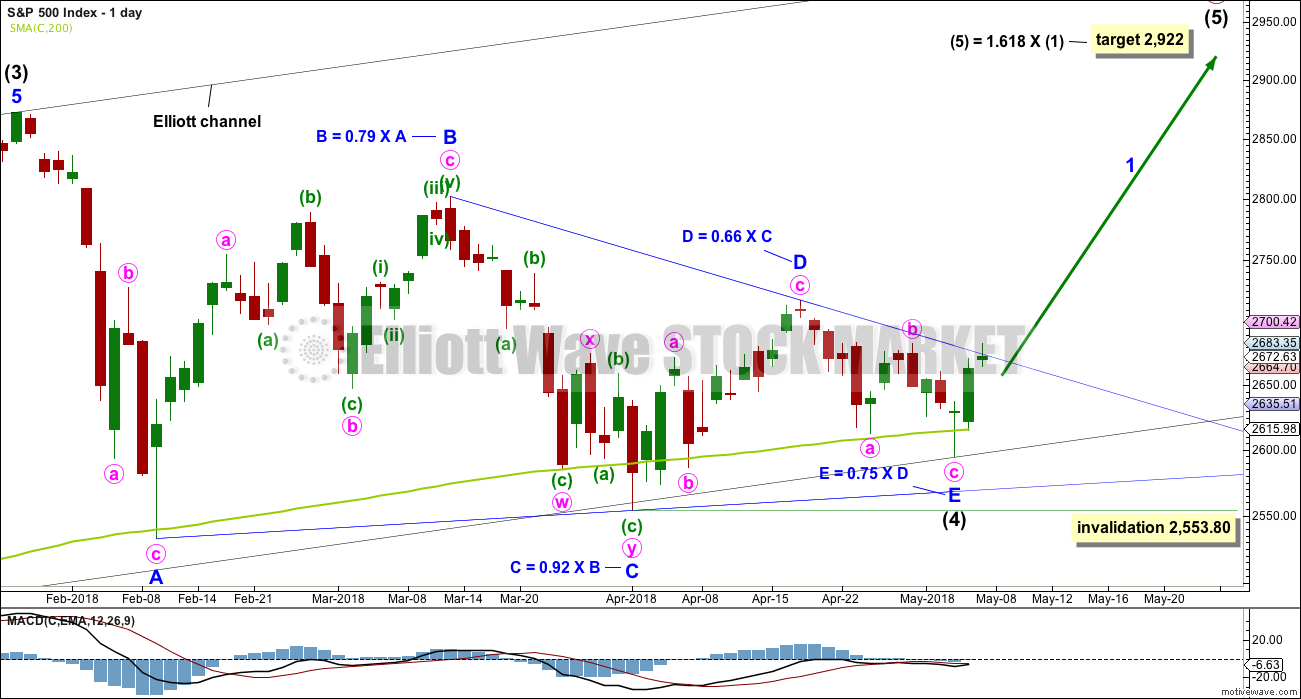
DAILY CHART
It is possible that intermediate wave (4) is a complete regular contracting triangle, the most common type of triangle. Minor wave E may have found support just above the 200 day moving average and ending reasonably short of the A-C trend line. This is the most common look for E waves of triangles.
Intermediate wave (3) exhibits no Fibonacci ratio to intermediate wave (1). It is more likely then that intermediate wave (5) may exhibit a Fibonacci ratio to either of intermediate waves (1) or (3). The most common Fibonacci ratio would be equality in length with intermediate wave (1), but in this instance that would expect a truncation. The next common Fibonacci ratio is used to calculate a target for intermediate wave (5) to end.
It must still be accepted that the risk with this wave count is that a low may not yet be in place; intermediate wave (4) could continue lower. For this triangle wave count, minor wave E may not move beyond the end of minor wave C below 2,553.80.
When price has clearly broken out above the upper triangle B-D trend line, then the invalidation point may be moved up to the end of intermediate wave (4). The upper edge of the candlestick is above the trend line today. A clear breach requires a full daily candlestick above and not touching the trend line.
Sometimes the point at which the triangle trend lines cross over sees a trend change. A trend change at that point may be a minor one or a major one. That point is about the 3rd of June.
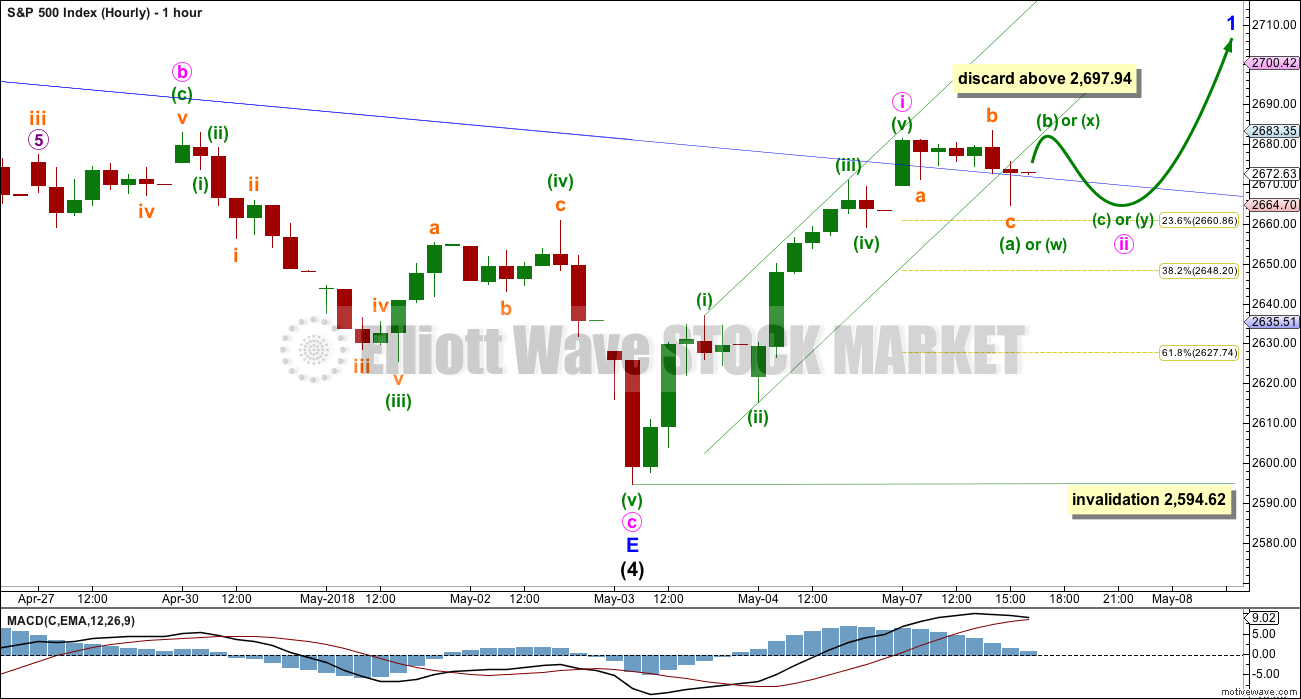
HOURLY CHART
A five up may now be complete; it is labelled minute wave i. Minute wave ii may have begun on Monday, and it is possible it may continue sideways or lower for the next one to few days as a flat, combination or double flat correction. All of these are sideways structures except expanded flats, which may move price reasonably lower.
The first structure in a possible flat or double is labelled minuette wave (a) or (w). This structure is an expanded flat.
If minute wave ii is continuing further as a flat correction labelled minuette waves (a)-(b)-(c), then within it minuette wave (b) is very unlikely to be more than twice the length of minuette wave (a). At 2,697.94 minuette wave (b) would reach twice the length of minuette wave (a). The idea of an expanded flat continuing should be discarded above this point. The same principle will be applied to the possibility of a combination continuing.
Minute wave ii may not move beyond the start of minute wave i below 2,594.62.
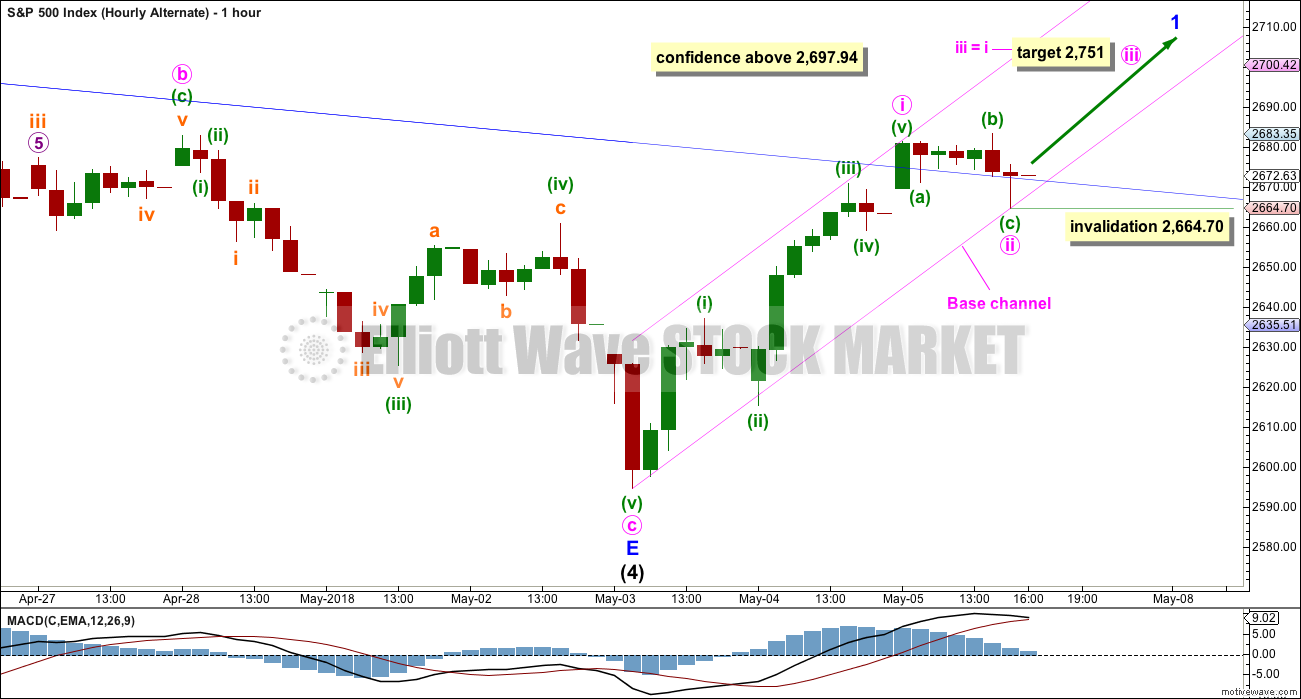
ALTERNATE HOURLY CHART
It is possible that minute wave ii is over at today’s low as a relatively brief and shallow correction. This has been a feature of this bull market for some time, from the low on the 4th of November 2016. It may be so again.
No second wave correction may move beyond the start of its first wave below 2,664.70 within minute wave iii.
The target for minute wave iii to end is calculated at only equality in length with minute wave i due a shallow correction for minute wave ii.
ALTERNATE WAVE COUNTS
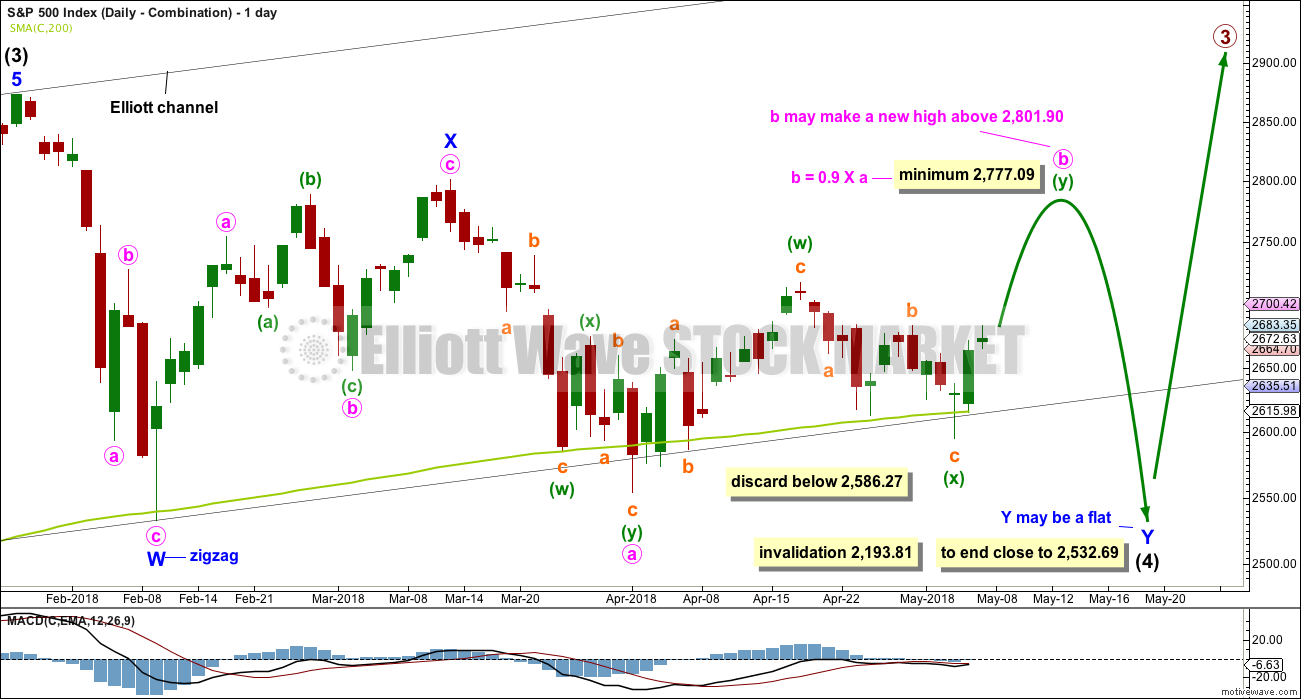
DAILY CHART – COMBINATION
I have charted a triangle a great many times over the years, sometimes even to completion, only to see the structure subsequently invalidated by price. When that has happened, the correction has turned out to be something else, usually a combination. Therefore, it is important to always consider an alternate when a triangle may be unfolding or complete.
Double combinations are very common structures. The first structure in a possible double combination for intermediate wave (4) would be a complete zigzag labelled minor wave W. The double should be joined by a three in the opposite direction labelled minor wave X, which may be a complete zigzag. X waves within combinations are typically very deep; if minor wave X is over at the last high, then it would be a 0.79 length of minor wave W, which is fairly deep giving it a normal look. There is no minimum nor maximum requirement for X waves within combinations.
The second structure in the double would most likely be a flat correction labelled minor wave Y. It may also be a triangle, but at this stage the expected direction for that idea does not differ now from the main wave count.
A flat correction would subdivide 3-3-5. Minute wave a must be a three wave structure, most likely a zigzag. It may also be a double zigzag.
Minute wave b must now reach a minimum 0.90 length of minute wave a. Minute wave b may be unfolding as a double zigzag. Within a double zigzag, the second zigzag exists to deepen the correction when the first zigzag did not move price deep enough. Double zigzags normally have a strong slope like single zigzags. To achieve a strong slope the X wave within a double zigzag is normally brief and shallow, most importantly shallow (it rarely moves beyond the start of the first zigzag). A new low now below 2,586.27 should see the idea of a double zigzag for minute wave b discarded.
The purpose of combinations is to take up time and move price sideways. To achieve this purpose the second structure in the double usually ends close to the same level as the first. Minor wave Y would be expected to end about the same level as minor wave W at 2,532.69. This would require a strong overshoot or breach of the 200 day moving average, which looks unlikely but does have precedent in this bull market.
Minute wave b may make a new high above the start of minute wave a if minor wave Y is an expanded flat. There is no maximum length for minute wave b, but there is a convention within Elliott wave that states when minute wave b is longer than twice the length of minute wave a the idea of a flat correction continuing should be discarded based upon a very low probability. That price point would be at 3,050. However, if price makes a new all time high and upwards movement exhibits strength, then this idea would be discarded at that point. Minute wave b should exhibit obvious internal weakness, not strength.
At this stage, the very bullish signal from the AD line making a new all time high puts substantial doubt on this wave count. It has very little support from classic technical analysis.
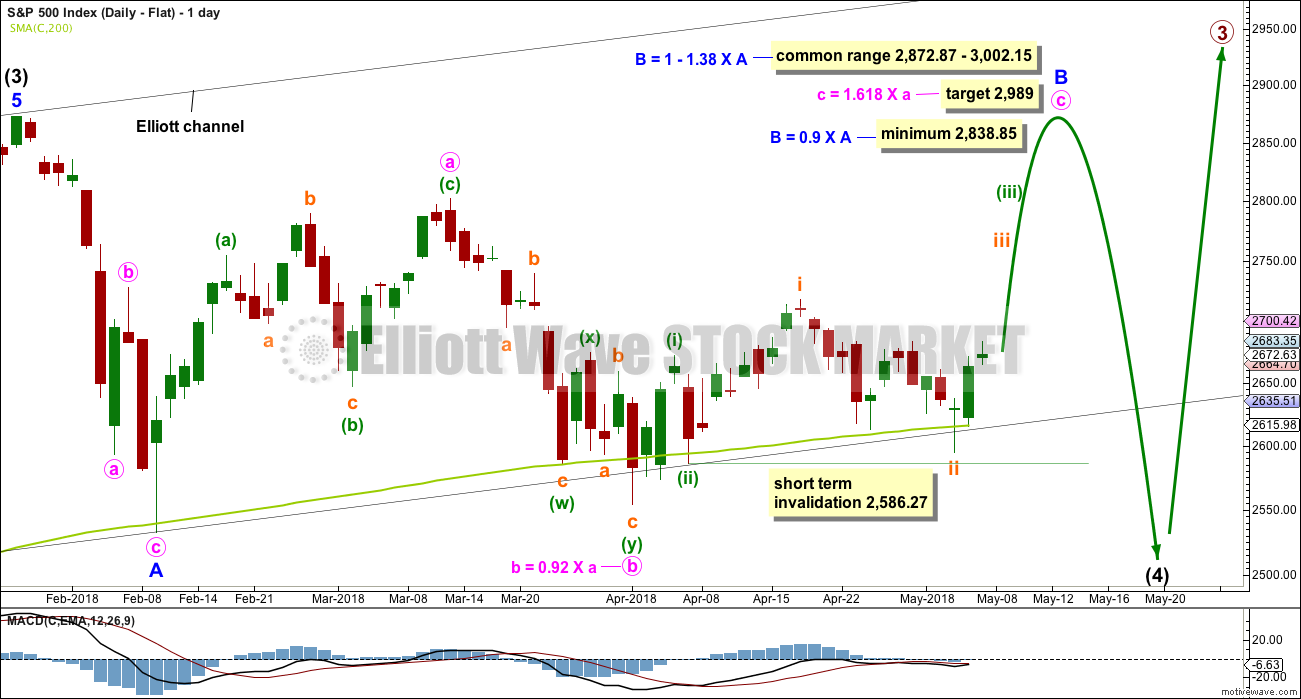
DAILY CHART – FLAT
Flat corrections are very common. The most common type of flat is an expanded flat. This would see minor wave B move above the start of minor wave A at 2,872.87.
Within a flat correction, minor wave B must retrace a minimum 0.9 length of minor wave A at 2,838.85. The most common length for minor wave B within a flat correction would be 1 to 1.38 times the length of minor wave A at 2,872.87 to 3,002.15. An expanded flat would see minor wave B 1.05 times the length of minor wave A or longer, at 2,889.89 or above. A target is calculated for minor wave B to end, which would see it end within the common range.
Minor wave B may be a regular flat correction, and within it minute wave a may have been a single zigzag and minute wave b may have been a double zigzag. This has a very good fit.
However, minute wave c must be a five wave structure for this wave count and now the depth and duration of subminuette wave ii looks wrong. The probability that minute wave c upwards is unfolding as an impulse is now reduced. It is possible that it could be a diagonal, but that too has a relatively low probability as the diagonal would need to be expanding to achieve the minimum price target for minor wave B, and expanding ending diagonals are not very common.
At its end minor wave B should exhibit obvious weakness. If price makes a new all time high and exhibits strength, then this wave count should be discarded.
This wave count would require a very substantial breach of the 200 day moving average for the end of intermediate wave (4). This is possible but may be less likely than a smaller breach. The bullish signal from the AD line making a new all time high puts substantial doubt on this wave count.
TECHNICAL ANALYSIS
WEEKLY CHART
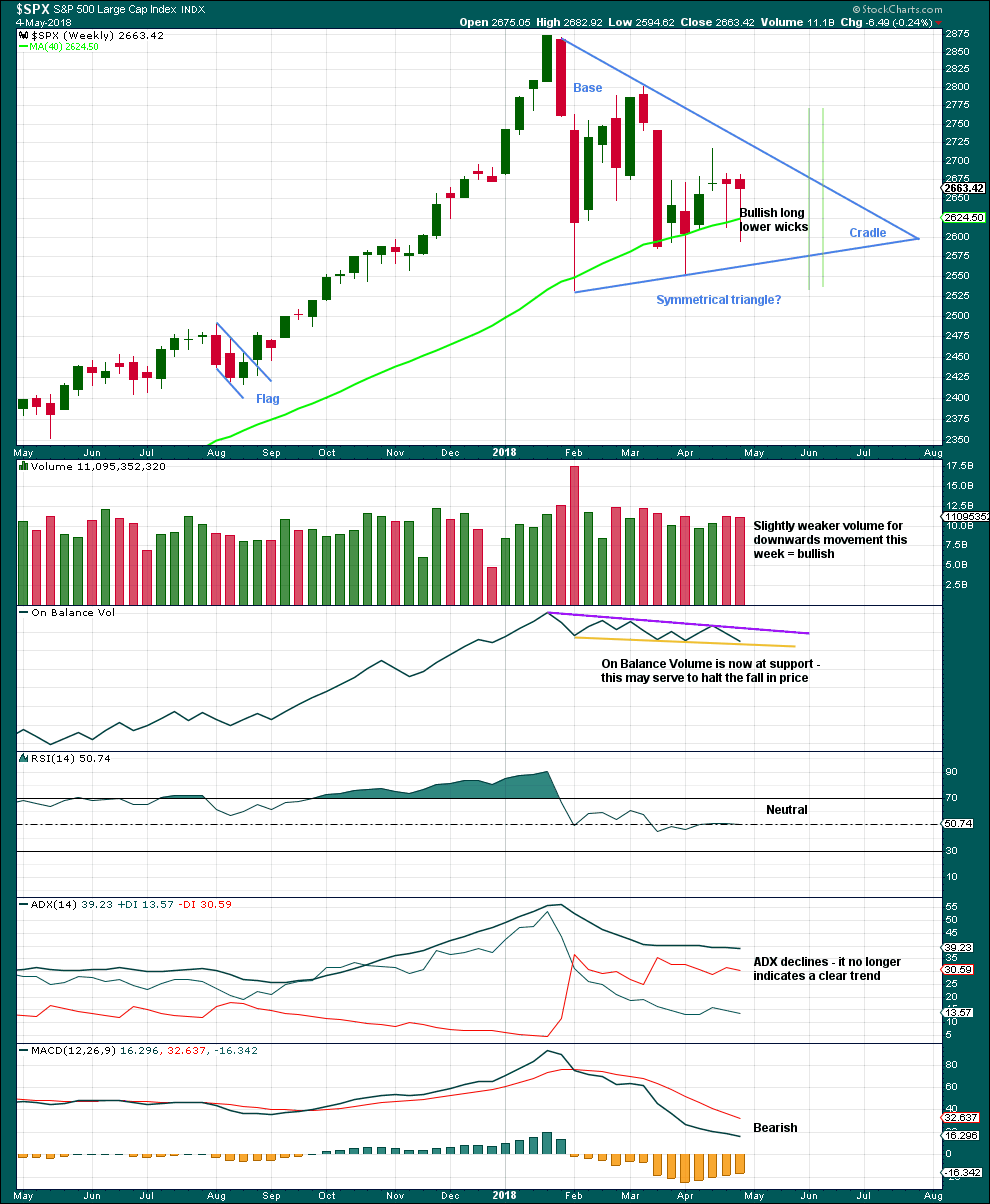
Click chart to enlarge. Chart courtesy of StockCharts.com.
A classic symmetrical triangle pattern may be forming. These are different to Elliott wave triangles. Symmetrical triangles may be either continuation or reversal patterns, while Elliott wave triangles are always continuation patterns and have stricter rules.
The vertical green lines are 73% to 75% of the length of the triangle from cradle to base, where a breakout most commonly occurs.
From Dhalquist and Kirkpatrick on trading triangles:
“The ideal situation for trading triangles is a definite breakout, a high trading range within the triangle, an upward-sloping volume trend during the formation of the triangle, and especially a gap on the breakout.”
For this example, the breakout has not yet happened. There is a high trading range within the triangle, but volume is declining.
The triangle may yet have another 5 – 6 weeks if it breaks out at the green lines.
Now two bullish long lower wicks are complete, and the second wick is even longer so more bullish. On Balance Volume is at support, which may halt the fall in price. The resistance line on On Balance Volume is slightly adjusted to have stronger technical significance.
DAILY CHART
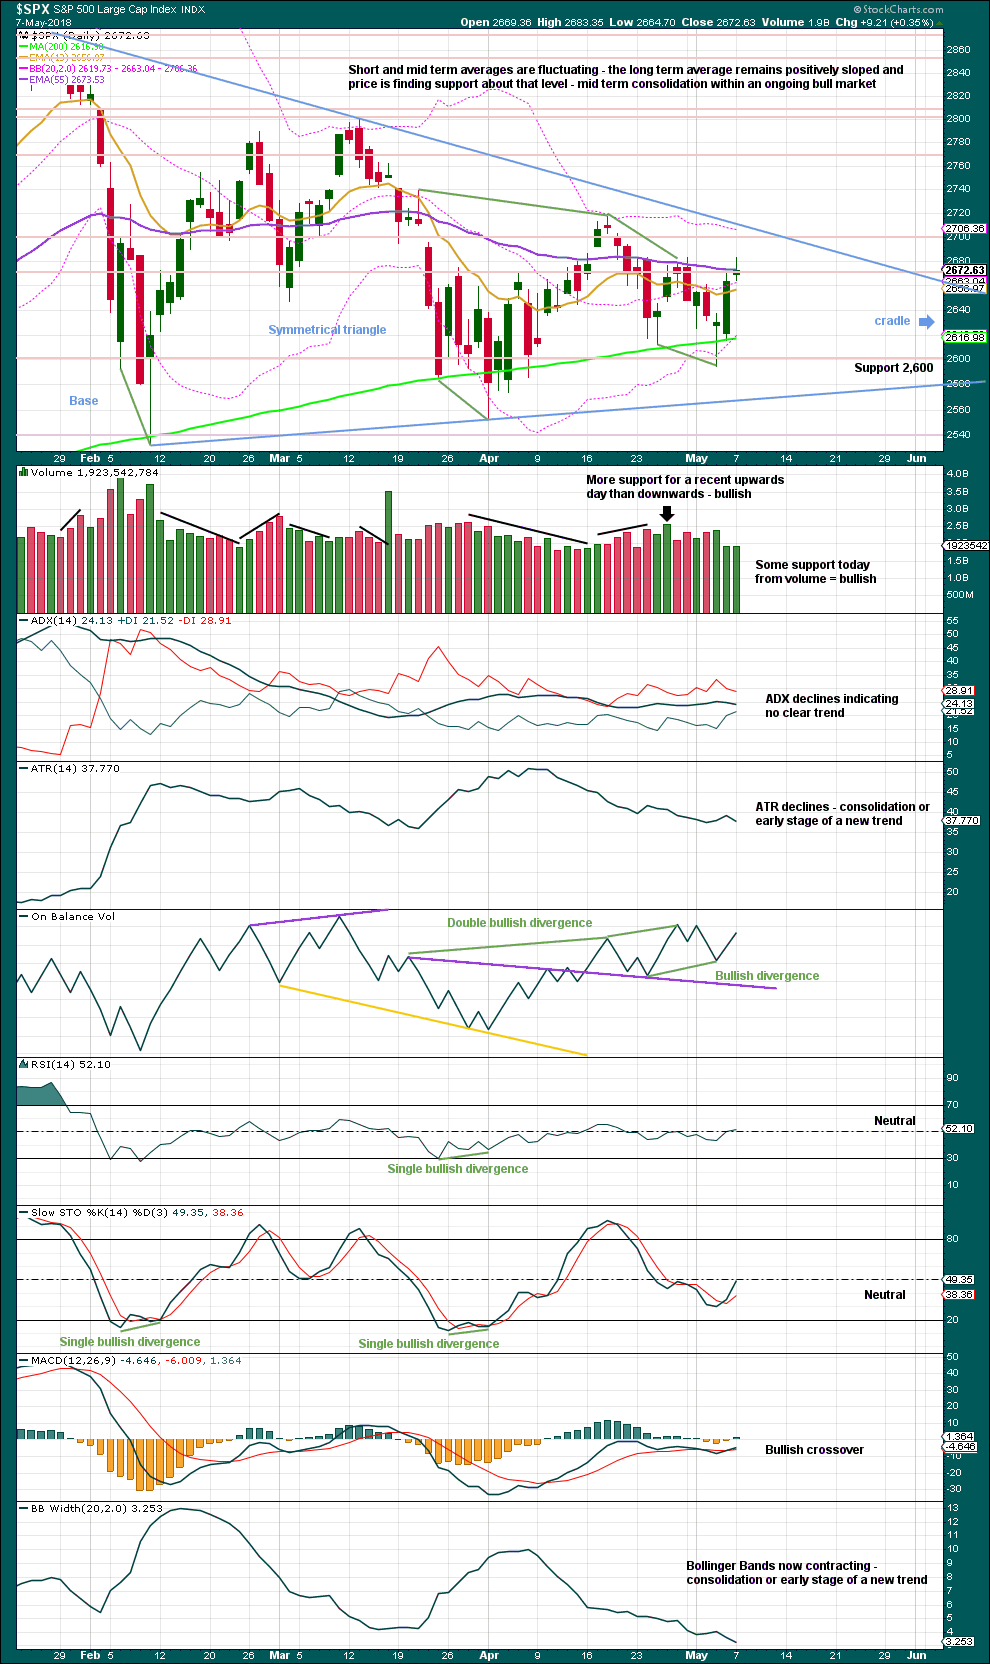
Click chart to enlarge. Chart courtesy of StockCharts.com.
During this large consolidation, there are two green daily candlesticks with strongest volume:
1. the 6th of February was a downwards day, but it closed green and the balance of volume that day was upwards; this has the strongest volume during the consolidation.
2. the 16th of March was an inside day, which closed green and has the balance of volume upwards; this has the next strongest volume.
This market has been range bound since the last all time high. Volume suggests an upwards breakout is more likely than downwards. With price coiling in an ever decreasing range, it looks like a classic symmetrical triangle is forming. These are similar but not completely the same as Elliott wave triangles. Symmetrical triangles may be either continuation or reversal patterns while Elliott wave triangles are always continuation patterns.
Breakouts from symmetrical triangles most commonly occur from 73% to 75% of the length from base to cradle. In this instance, that would be in another 17 to 19 sessions. A breakout should be a close above or below the triangle trend lines, and an upwards breakout should have support from volume for confidence.
After an upwards breakout, pullbacks occur 59% of the time. After a downwards breakout, throwbacks occur 37% of the time.
After a breakout, the base distance (the vertical distance between the initial upper and lower reversal point prices) may be added to the breakout price point to calculate a target. Here, the base distance is 320.28 points.
There are now two instances of recent bullish divergence between price and On Balance Volume. Price has made a new swing low below the prior low of the 25th of April, but On Balance Volume has not. This indicates weakness in price and is bullish.
A little support now from volume, and On Balance Volume remaining bullish, support the main Elliott wave count today.
VOLATILITY – INVERTED VIX CHART
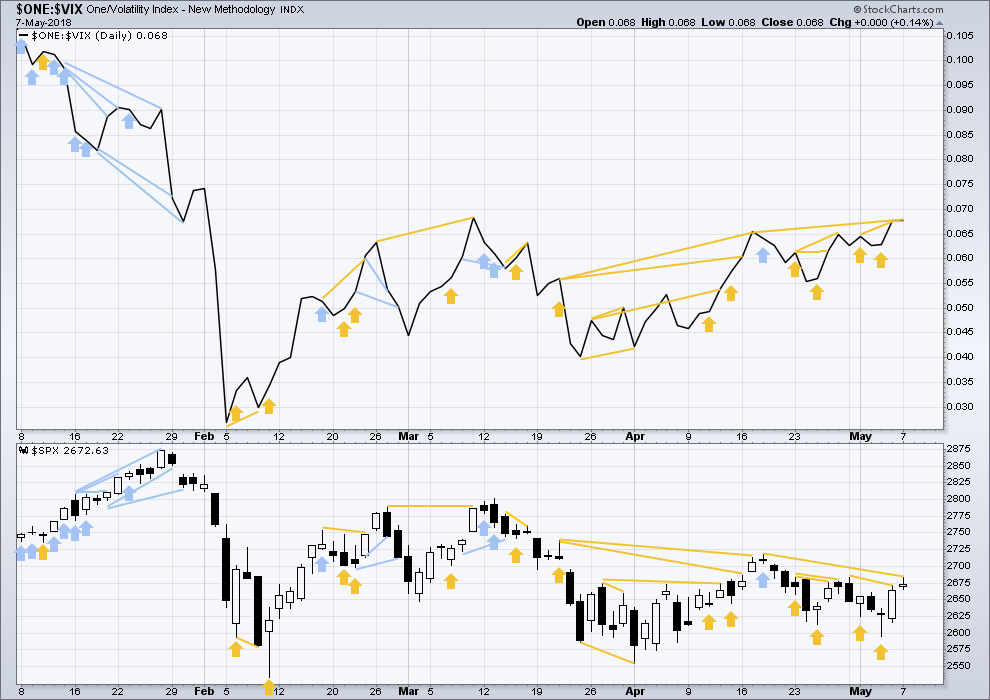
Click chart to enlarge. Chart courtesy of StockCharts.com.
So that colour blind members are included, bearish signals will be noted with blue and bullish signals with yellow.
Normally, volatility should decline as price moves higher and increase as price moves lower. This means that normally inverted VIX should move in the same direction as price.
There is still a cluster of bullish signals on inverted VIX. Overall, this may offer support to the main Elliott wave count.
The last bullish signal from inverted VIX has been followed by an upwards day. Inverted VIX remains above its high of the 17th of April, but price does not. The bullish divergence remains.
BREADTH – AD LINE
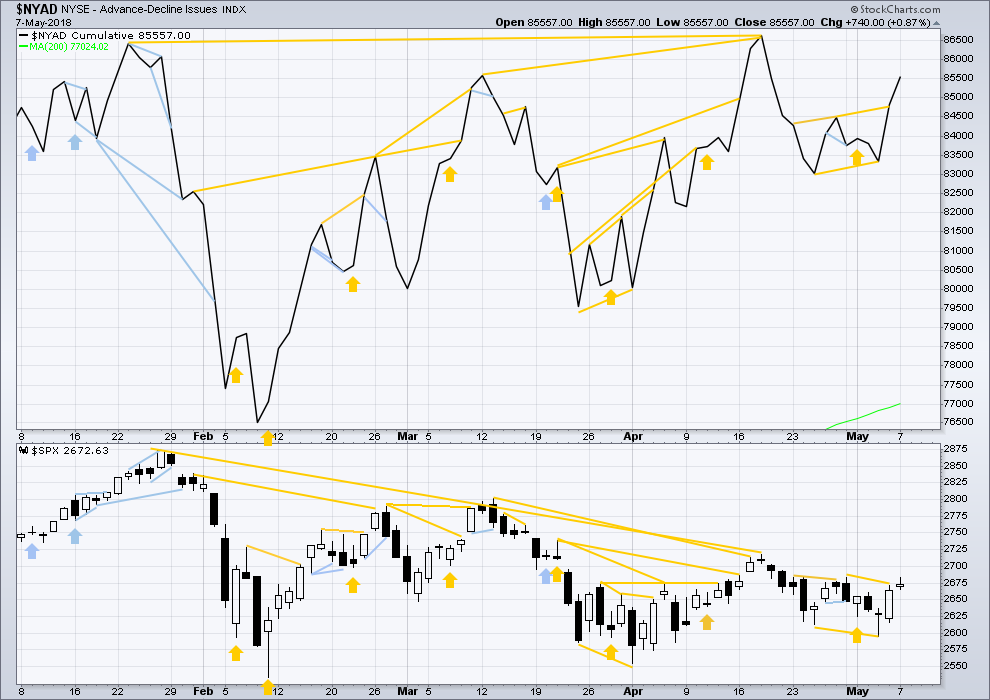
Click chart to enlarge. Chart courtesy of StockCharts.com.
There is normally 4-6 months divergence between price and market breadth prior to a full fledged bear market. This has been so for all major bear markets within the last 90 odd years. With no longer term divergence yet at this point, any decline in price should be expected to be a pullback within an ongoing bull market and not necessarily the start of a bear market. A new all time high from the AD line this week means that any bear market may now be an absolute minimum of 4 months away.
For most recent days, both mid and small caps have now made new small swing highs above the prior highs of the 30th of April (mid caps) and the 26th of April (small caps). Only large caps have not yet made new small swing high above the 30th of April. Small and mid caps may be leading the market. This divergence is interpreted as bullish.
Breadth should be read as a leading indicator.
The new all time high from the AD line remains very strongly bullish and supports the main Elliott wave count. This new all time high from the AD line will be given much weight in this analysis. This is the piece of technical evidence on which I am relying most heavily in expecting a low may be in place here or very soon.
There has been a cluster of bullish signals from the AD line in the last few weeks. This also overall offers good support to the main Elliott wave count.
Last noted bullish divergence has been followed by an upwards day. Price and the AD line both moved higher today, with the AD line moving very strongly higher, which is very bullish.
DOW THEORY
The following lows need to be exceeded for Dow Theory to confirm the end of the bull market and a change to a bear market:
DJIA: 23,360.29.
DJT: 9,806.79.
S&P500: 2,532.69.
Nasdaq: 6,630.67.
At this stage, only DJIA has made a new major swing low. DJT also needs to make a new major swing low for Dow Theory to indicate a switch from a bull market to a bear market. For an extended Dow Theory, which includes the S&P500 and Nasdaq, these two markets also need to make new major swing lows.
Charts showing each prior major swing low used for Dow Theory may be seen at the end of this analysis here.
Published @ 10:28 p.m. EST.

Updated main hourly chart:
It looks like minute i may have been over at the high and minute ii may be a double zigzag.
And minute ii should now be over, if this labelling is correct.
I think we are going to get a dragon-fly doji on the close with a lower low, and lower high. I for one would be very careful…
Have a great evening all…see ya tomorrow! 🙂
Took a small wad by closing SPY ratio backspread…a bird in the hand and all that. “Being careful…” If the market charges up tomorrow, there’ll be plenty of opportunity to generate income sans that trade.
Good afternoon! Only 1pm and time to play in the city by the bay!!!
They have driven VIX sharply off the highs with even a nice wick, but hey, that is nothing new. We are still seeing green. Not at all in keeping with smart traders piling into calls as you would expect with a reversal…….
I can’t wait to see how she closes….yikes!
VIX still not signaling all clear….watching……
You would be surprised at what can happen in the last hour of trading…. 🙂
If we are not done yet and this move up is corrective, we fall hard into the close so get ready…
One of the things I’m using to gauge the action….these are 10 min bars. No hit on the 38% fibo yet, the low is in no-fibo-land. Possible as a low, but a bit on the “not as likely” side. Is this a ending diagonal “c” wave down on a flat 4?? Because I thought flats were 3-3-5, and otherwise, this isn’t anything resembling a 5.
Mixed signals. Long shadow on last candle and gap higher on 1 minute chart but VIX still waving a caution flag. A green print could be conclusive….
Boom! 🙂
Or should that be….Ka-Pow!!?
starting to look like a real 2 down now.
They’re still slamming VIX hard, but we will see low 20s very soon, if not much higher. I layered in the past few days and will sit back and enjoy the show.
It is amaaaaazing….!
Wow! The bears stepped right up and sold it, and I mean hard.
As if to say, “Nope! Not today you don’t!”
This is a riot! 🙂
Hahahaha! Did you guys just see that??? 🙂
I must say this is very very fun…..
And then some…!! 🙂
I know they are not going to listen to me but the PPT needs to save its firepower to defend the 200 day. As Judge Ellis said…”C’Mon Man!” 🙂
Oh My! The buying in futures is starting to take on the appearance of outright panic.
They may as well let Mr. Market find his level and save their money…lol! 🙂
Not the closure of last Friday’s gap at 2666.62
Selling in futures starting to pick up a head of steam. Look at the size of those candles. Looks to me like some heavy hitters are on the field!
A dive there could presage the conclusion to today’s meandering journey….
Presage …. great word
Exited EMB short calls today for another great trade from an instrument I have been affectionately calling “Old Faithful”
The hammer today means we could get a two or three day bounce but I suspect this ATM will keep on rolling to the downside as per Chris’ comments earlier! MFM! 🙂
Yeah Verne, look at the COT reports on the commercial side for MSCI EM…..you’ll laugh pretty hard after seeing the updated positioning.
It is quite funny. I guess you heard about that fight Musk picked with all the TSLA short sellers and the way he threatened then with “Unreal Carnage”
Considering he is in hock to Goldman and Morgan Stanley for some 800 M PERSONALLY, he used to prop up shares of TSLA, his going out and spending another 10M to supposedly rout the short sellers had me rolling on the floor in fits of laughter! Some carnage! 🙂
A rejection at the 50 day might require more consolidation or possibly even a visit back toward lower B band prior to getting up a sufficient head of steam to overcome that formidable resistance. Most prior encounters had that exact outcome.
Indeed. The hourly action over the last 4 or so looks alot like the April 30 action, and April 19 action. The pause before the more serious fall. I don’t buy a 2 that only has retraced 23.6%. It’s possible…but not super common. If the market pushes up here I’d tend to say we’ve just completed the 4 of the 5 up, rather than a 2 after a completed 5. So I’m very very suspicious now that 2pm brings a serious sell off, with SPX getting to at least 2650, and possibly 2628. Could be wrong…I’ll wait for the sell triggers. Then I’ll be on it.
I have a few contingent orders that will trigger exactly at SPX 2650! 🙂
Wow… go time ?
Tease time! Though I do have green bars at the 5 minute now, while my hourly bars are still gray (neutral trend). What I liiiike is the ongoing fall in TLT (and strong uptrend in TBT).
Looking like the bottom of the 4 is in…though I’m more than a little worried about what the market does come 2pm EDT.
My GS that I promoted as an excellent long setup over the weekend is ripping.
What happens at 2pm.?
The person acting as the president of the US announces his intentions to break (or not break or partially break) the US multi-national nuclear non-proliferation treaty with Iran.
That deal was absolutely hilarious. Rumor has it that quite a few of those billions of dollars we forked over to Iran found their way into the coffers of the French and German governments, or at least into the pockets of some of their politicians, in addition to all the deals companies from those respective countries inked with the Mullahs. No wonder Macron and Merkel came scurrying to the WH to plead with Trump to keep the spigot open. The do have quite a few refugees they have to care for….. 🙂
I abstain from any discussion of politics here, and I urge all to adopt the same policy. I don’t want to read it, I don’t want to mentally engage in it while trading, and I don’t want to debate it (here).
I am leaning to agreeing with you there nowadays Kevin.
The current US political climate is too divisive I think for discussion of it to be had in this forum.
Did I ask you to engage in a discussion Kevin?
We are all adults here and quite free to express a point of view.
You are quite free to simply ignore what I opined, instead of trying to dictate to me what I can express an opinion about. There was a context to what I said, and I frankly take offense at your trying to tell me what I can or cannot say, providing I do it politely.
This is a free country last I checked my friend.
Wassup with waxing VIX? Repeat rapidly ten times! 😀
Guten Morgen!
The rejection of price at the 50 day has to be respected. In combination with the long wick we got a signal of a deeper correction likely ahead. The very shallow smaller fourth wave hinted at the same thing. Based on that evidence I snagged a few SPY 266 puts expiring Wednesday. I will be unloading half at the open and monitoring the bid on the remaining contracts to signal the end of the pullback.
I expect it to be deep. Talking heads will blame Trump’s decision on Iran.
Have a great trading day everyone! May your profits abound!
Nice Verne, many are ignoring the mass exodus from EM equity and EM debt funds, with spreads blowing out and currencies down huge. While, we may get a panic buying spree to a new high, the clock is seriously ticking. With the dollars continued rise eurodollar liquidity is declining rapidly. I’ve never seen so many bearish fundamental, technical, and historical data points line up. Looks like the 3 high of this upwave was breached in SPX futures.
I hear ya Chris. One of my most reliable trades the llast several months has been bear call spreads on EMB. I now refer to it as “Old Faithful”! 🙂