
A small range day moves price lower, which remains above the invalidation point on the main hourly chart.
The AD line gives a signal today, indicating the most likely direction for tomorrow.
Summary: The target for upwards movement is now 2,737. A new high above 2,674.78 would add confidence in an upwards swing. A bullish signal today from the AD line supports this. Price is at support at both a trend line and the 200 day moving average. Expect support to hold until it is breached.
A new low below 2,585.89 would indicate downwards movement has one more low before it is done, and the target would be at 2,561 or 2,521. Bearish On Balance Volume supports this view.
Always practice good risk management. Always trade with stops and invest only 1-5% of equity on any one trade.
New updates to this analysis are in bold.
The biggest picture, Grand Super Cycle analysis, is here.
Last historic analysis with monthly charts is here. Video is here.
An alternate idea at the monthly chart level is given here at the end of this analysis.
An historic example of a cycle degree fifth wave is given at the end of the analysis here.
MAIN ELLIOTT WAVE COUNT
WEEKLY CHART
Click chart to enlarge.
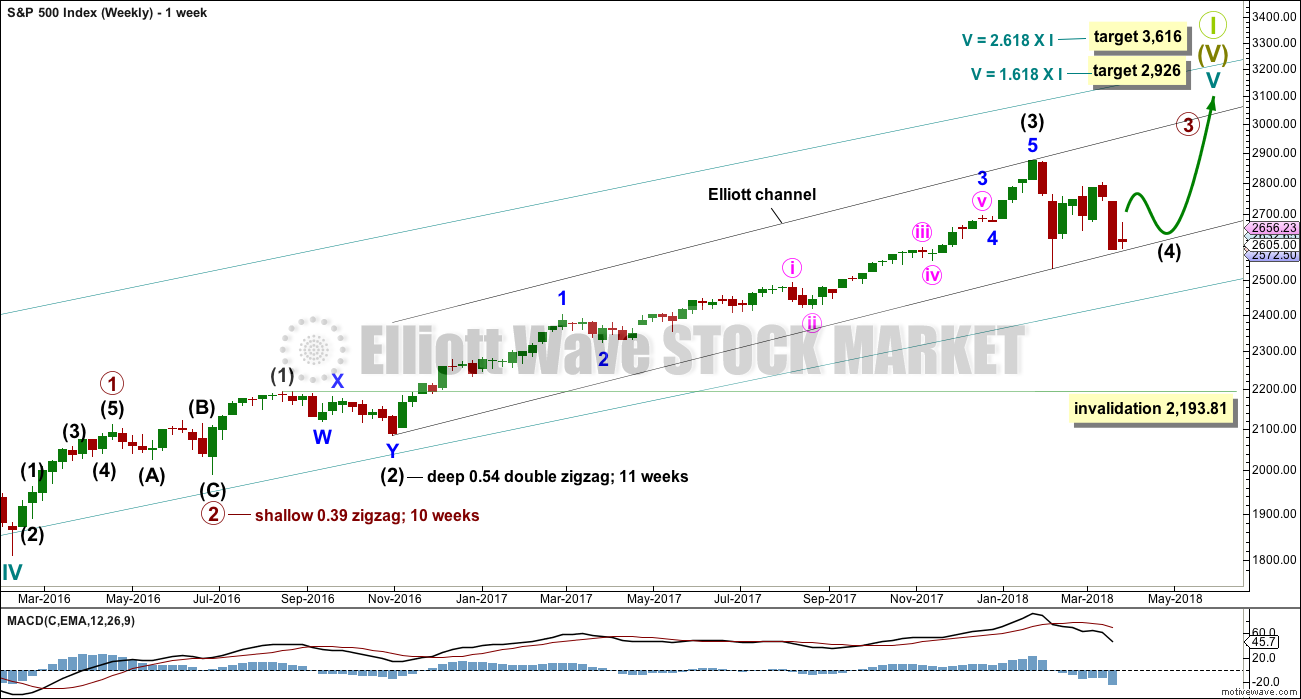
Cycle wave V must complete as a five structure, which should look clear at the weekly chart level. It may only be an impulse or ending diagonal. At this stage, it is clear it is an impulse.
Within cycle wave V, the third waves at all degrees may only subdivide as impulses.
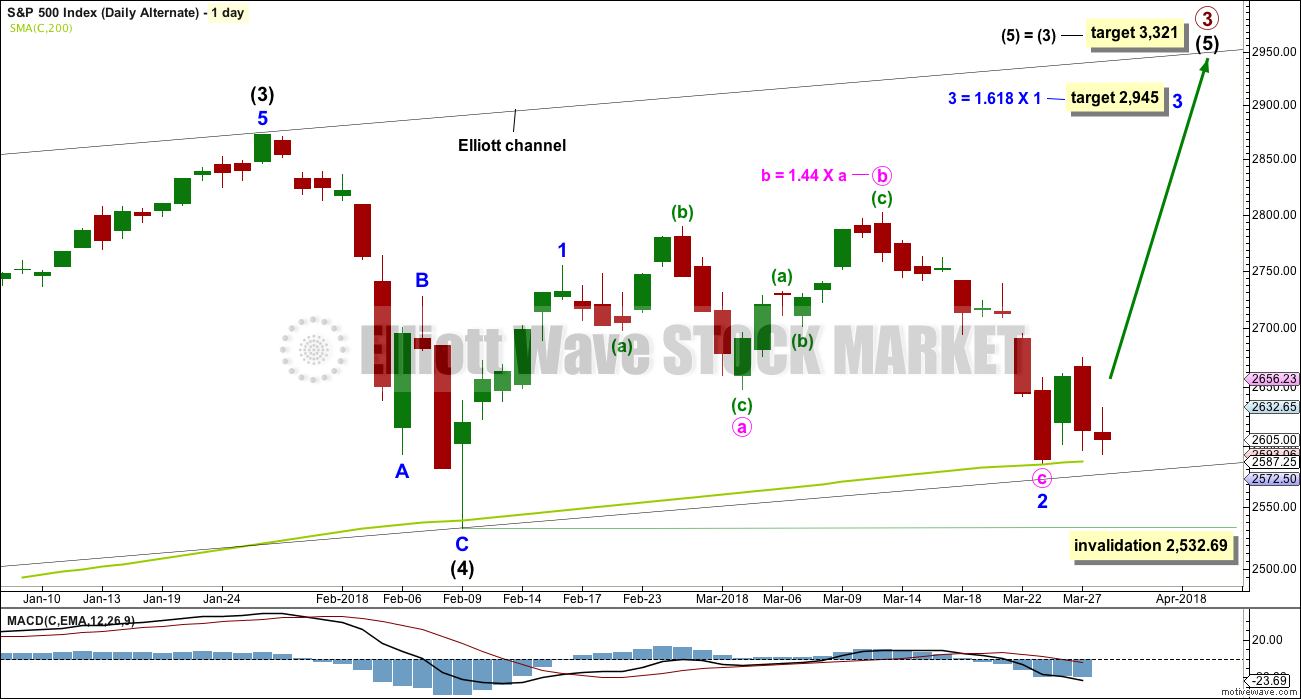
Intermediate wave (4) has breached an Elliott channel drawn using Elliott’s first technique. The channel is redrawn using Elliott’s second technique as if intermediate wave (4) was over at the last low. If intermediate wave (4) continues sideways, then the channel may be redrawn when it is over. The upper edge may provide resistance for intermediate wave (5).
Intermediate wave (4) may not move into intermediate wave (1) price territory below 2,193.81. At this stage, it now looks like intermediate wave (4) may be continuing further sideways as a combination, triangle or flat. These three ideas are separated into separate daily charts. All three ideas would see intermediate wave (4) exhibit alternation in structure with the double zigzag of intermediate wave (2).
A double zigzag would also be possible for intermediate wave (4), but because intermediate wave (2) was a double zigzag this is the least likely structure for intermediate wave (4) to be. Alternation should be expected until price proves otherwise.
DAILY CHART – TRIANGLE
Click chart to enlarge.
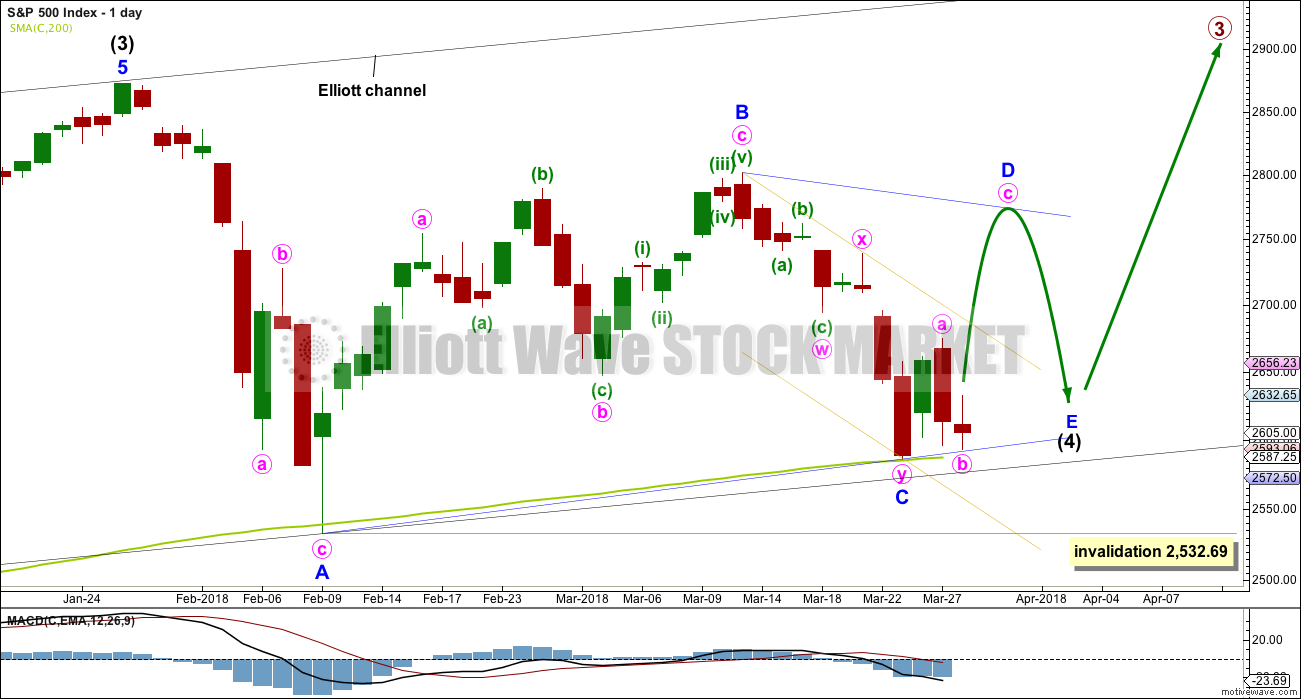
This first daily chart looks at a triangle structure for intermediate wave (4). The triangle may be either a regular contracting or regular barrier triangle. Within the triangle, minor waves A, B and now C may be complete.
If intermediate wave (4) is a regular contracting triangle, the most common type, then minor wave D may not move beyond the end of minor wave B above 2,801.90. Minor wave D would be very likely to end about 0.80 to 0.85 the length of minor wave C.
If intermediate wave (4) is a regular barrier triangle, then minor wave D may end about the same level as minor wave B at 2,801.90. As long as the B-D trend line remains essentially flat a triangle will remain valid. In practice, this means the minor wave D can end slightly above 2,801.90 as this rule is subjective.
When a zigzag upwards for minor wave D is complete, then this wave count would expect a final smaller zigzag downwards for minor wave E, which would most likely fall reasonably short of the A-C trend line.
If this all takes five weeks (including this week) to complete, then intermediate wave (4) may total a Fibonacci 13 weeks and would be just two weeks longer in duration than intermediate wave (2). There would be very good proportion between intermediate waves (2) and (4), which would give the wave count the right look.
The low today has found support right on the A-C trend line. Triangles normally adhere well to their trend lines, and it is common for the trend lines to be tested within triangle sub-waves. This has a typical look.
It is possible that minor wave C is over as per the labelling on this daily chart and the first hourly chart below, but it is also possible that it could continue lower tomorrow. An alternate hourly chart covers that possibility.
The best fit channel about minor wave C is redrawn to be as conservative as possible. It is copied over to the alternate hourly chart below.
HOURLY CHART
Click chart to enlarge.
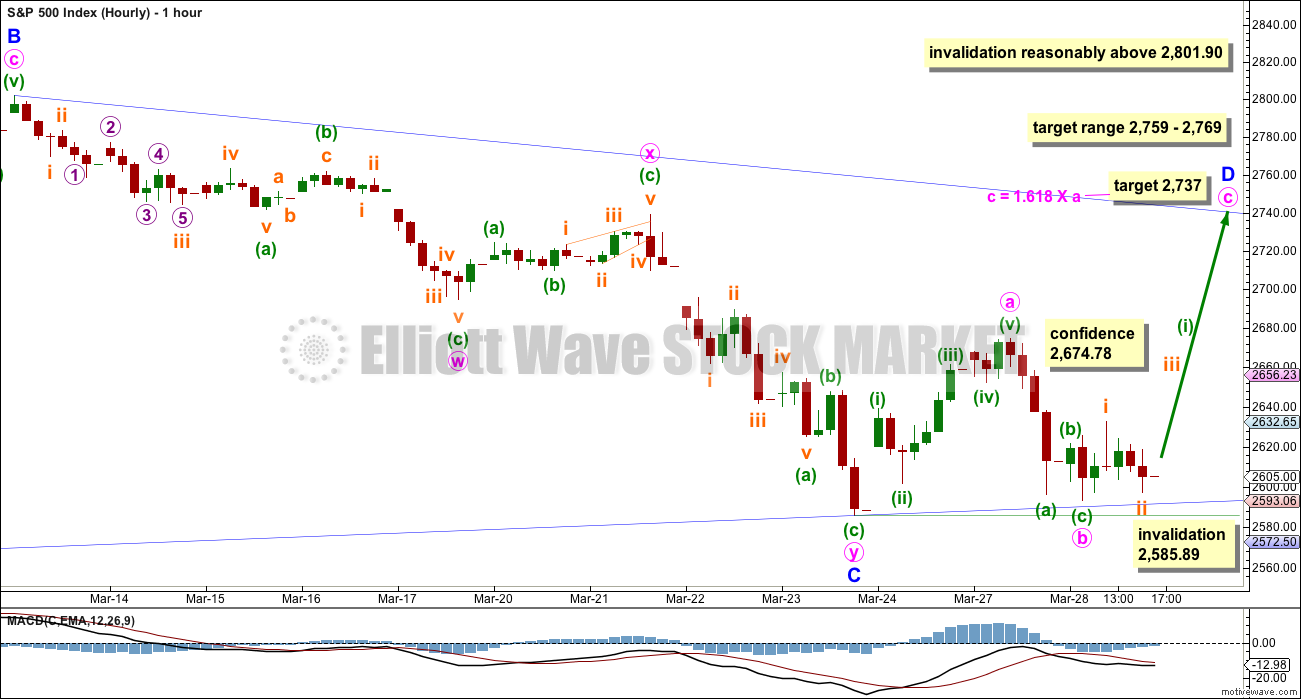
The zigzag downwards may be complete. A new wave up may have begun.
Minor wave D within a triangle should subdivide into a simple A-B-C corrective structure, most likely a simple zigzag.
The target range would see minor wave D reach a very common 0.80 to 0.85 length to minor wave C.
So far minute wave a looks like a five. Minute wave b may have moved a little lower today, now looking more like a zigzag at the hourly chart level.
The target for minute wave c to end would see minor wave D shorter than the common length of 0.8 to 0.85 of minor wave C. This would be acceptable.
Some confidence in this wave count at the hourly chart level may be had if price makes a new high above 2,674.78.
It is possible that minute wave b may move a little lower tomorrow as a double zigzag. If it does, it may not move beyond the start of minute wave a below 2,585.89.
Price has found support now three times at the A-C trend line. If this wave count is correct, then support there should hold.
ALTERNATE HOURLY CHART
Click chart to enlarge.
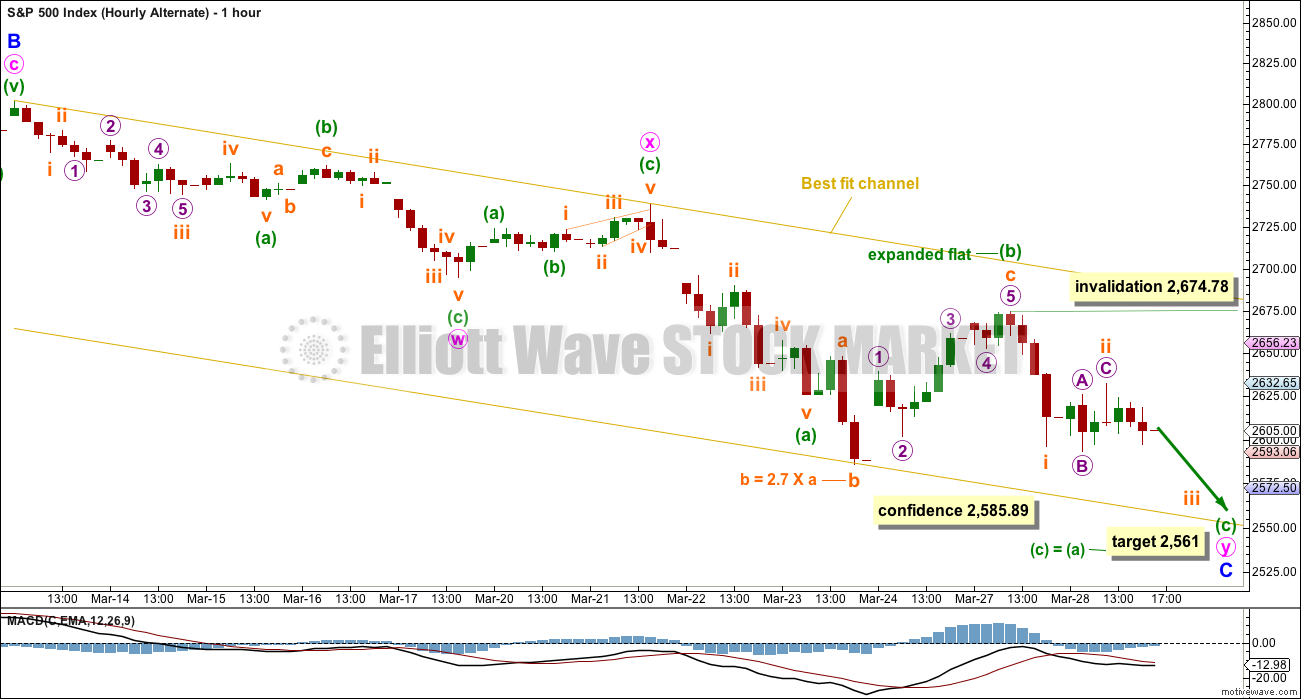
It is also possible that the second zigzag in the double for minor wave C is incomplete.
If the zigzag of minute wave y is continuing, then within it minuette wave (b) must be seen as an expanded flat correction (all subdivisions will fit at the five minute chart level). The problem here though is the length of subminuette wave b within the expanded flat. While there is no rule stating a limit for B waves within flats, there is a convention that states when the B wave is more than twice the length of the A wave the probability of a flat is extremely low. I have seen a few expanded flats where wave B is longer than twice the length of wave A, but they are uncommon.
The probability of this wave count would be reduced for this reason.
If price makes a new low tomorrow below 2,585.89, then the target for the triangle wave count would be at 2,561. This would expect the most common Fibonacci ratio between minuette waves (a) and (c).
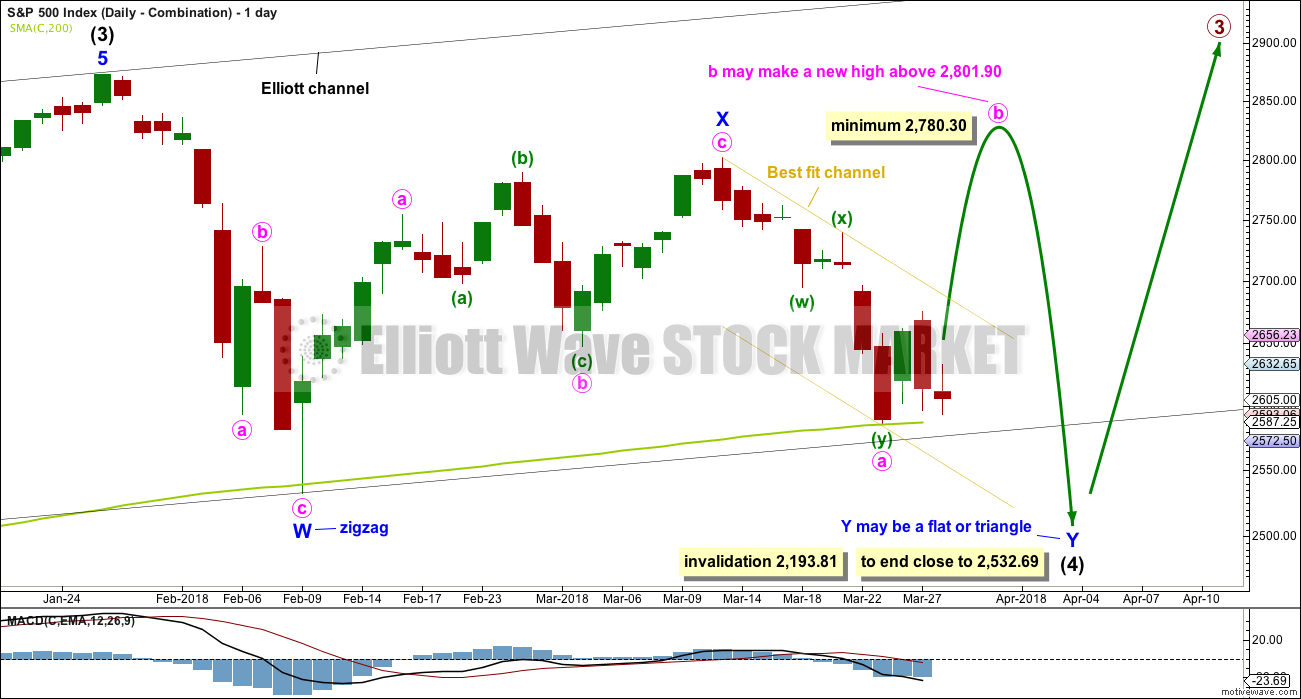
DAILY CHART – COMBINATION
Click chart to enlarge.
Double combinations are very common structures. The first structure in a possible double combination for intermediate wave (4) would be a complete zigzag labelled minor wave W. The double should be joined by a three in the opposite direction labelled minor wave X, which may be a complete zigzag. X waves within combinations are typically very deep; if minor wave X is over at the last high, then it would be a 0.79 length of minor wave W, which is fairly deep giving it a normal look. There is no minimum nor maximum requirement for X waves within combinations.
The second structure in the double would most likely be a flat correction labelled minor wave Y. It may also be a triangle, but in my experience this is very rare, so it will not be expected. The much more common flat for minor wave Y will be charted and expected.
A flat correction would subdivide 3-3-5. Minute wave a must be a three wave structure, most likely a zigzag. It may also be a double zigzag. On the hourly chart, this is now how this downwards movement fits best, and this will now be how it is labelled.
Minute wave b must now reach a minimum 0.90 length of minute wave a. Minute wave b must be a corrective structure. It may be any corrective structure.
The purpose of combinations is to take up time and move price sideways. To achieve this purpose the second structure in the double usually ends close to the same level as the first. Minor wave Y would be expected to end about the same level as minor wave W at 2,532.69. This would require a strong overshoot or breach of the 200 day moving average, which looks unlikely.
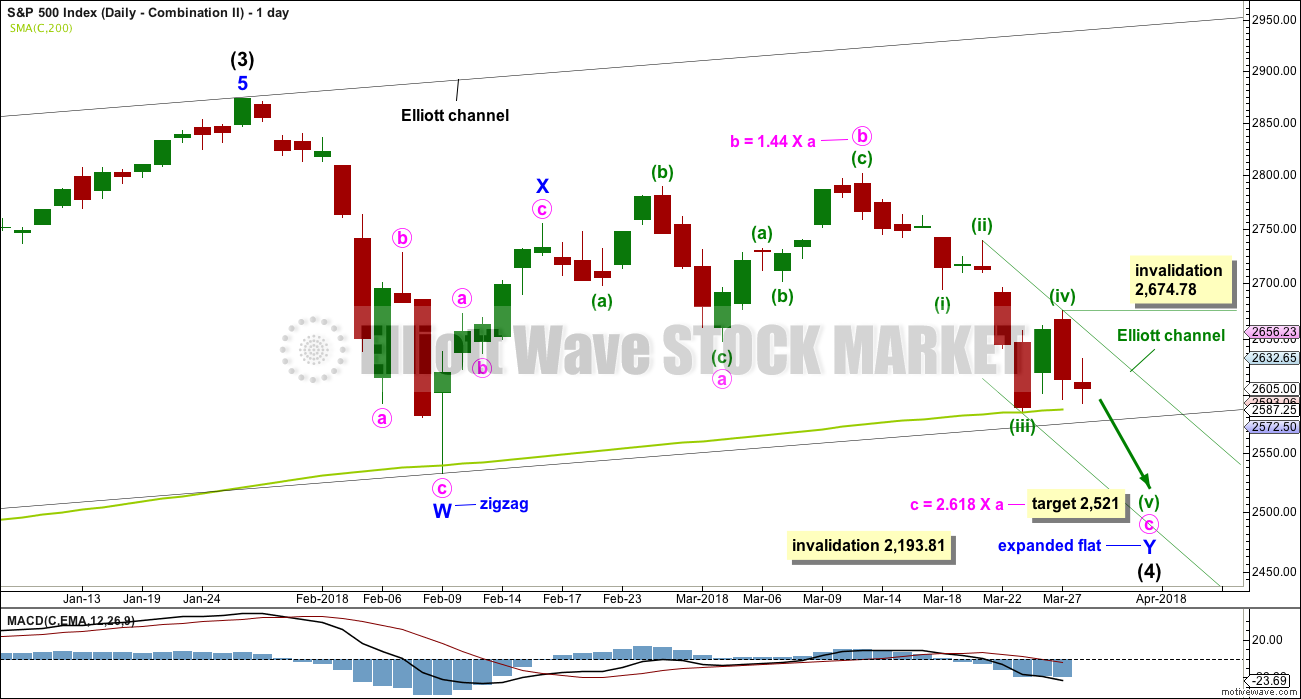
DAILY CHART – COMBINATION II
Click chart to enlarge.
This is another way to label the combination.
Minor wave W is still a zigzag labelled in the same way, over at the first low within intermediate wave (4).
The double is joined by a quick three in the opposite direction labelled minor wave X, subdividing as a zigzag.
Minor wave Y may have begun earlier and may be an almost complete expanded flat correction, and within it minute wave a is a three, itself an expanded flat. Minute wave b is a zigzag and only slightly longer than the most common length of up to 1.38 times the length of minute wave a. Minute wave c downwards must be a five wave structure. It may need a final fifth wave to complete it.
Within minuette wave (v), no second wave correction may move beyond its start above 2,674.78.
The target would see minor wave Y end only slightly below the end of minor wave W. The whole structure for the double combination would move sideways.
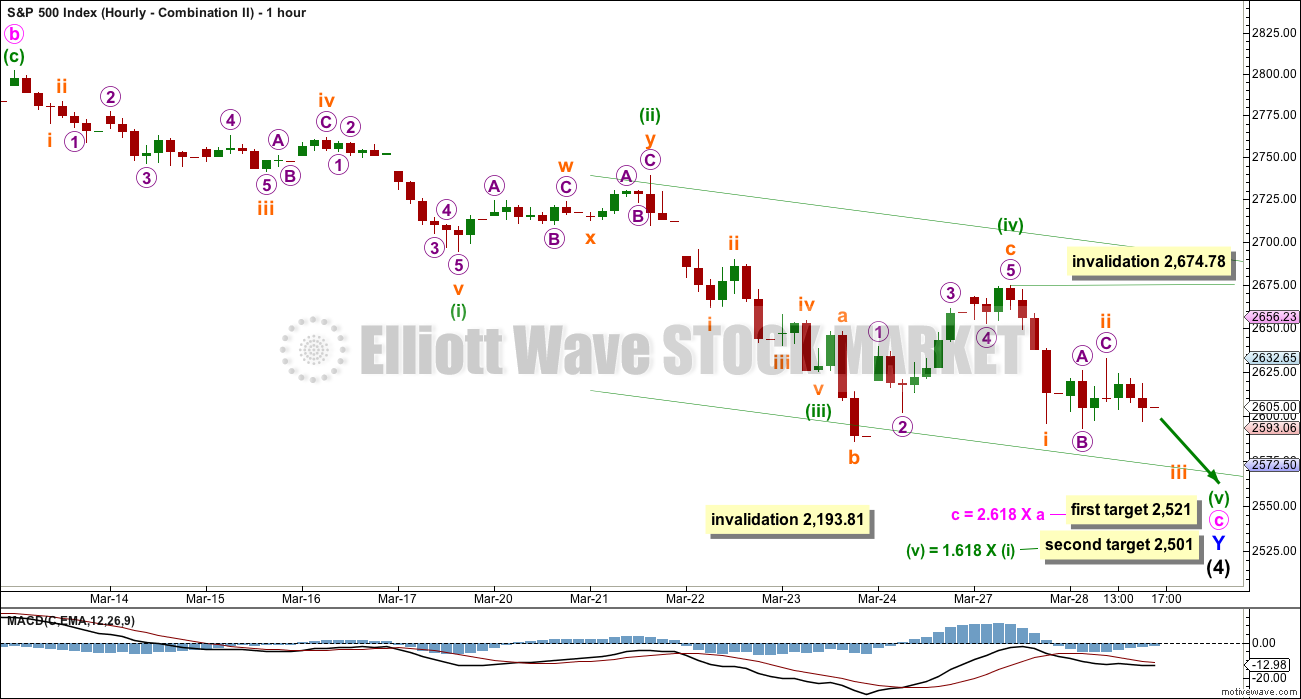
HOURLY CHART – COMBINATION II
Click chart to enlarge.
All hourly charts today show the whole movement from the last swing high on the 13th of March. The first two hourly charts see it as a double zigzag. This alternate idea sees it as a possible impulse.
Minute wave c has passed 1.618 the length of minute wave a, so the next Fibonacci ratio in the sequence is used to calculate a target. This would see a reasonable overshoot of the 200 day moving average, which would be acceptable. If price keeps falling through this first target, then use the second target.
Minuette wave (iii) is longer than minuette wave (i). There is no Fibonacci ratio between them. Minuette wave (v) has passed equality in length with minuette wave (i). The next Fibonacci ratio in the sequence would be 1.618 the length of minuette wave (i), which would be achieved at 2,501.
If subminuette wave ii continues higher, it may not move beyond the start of subminuette wave i above 2,674.78.
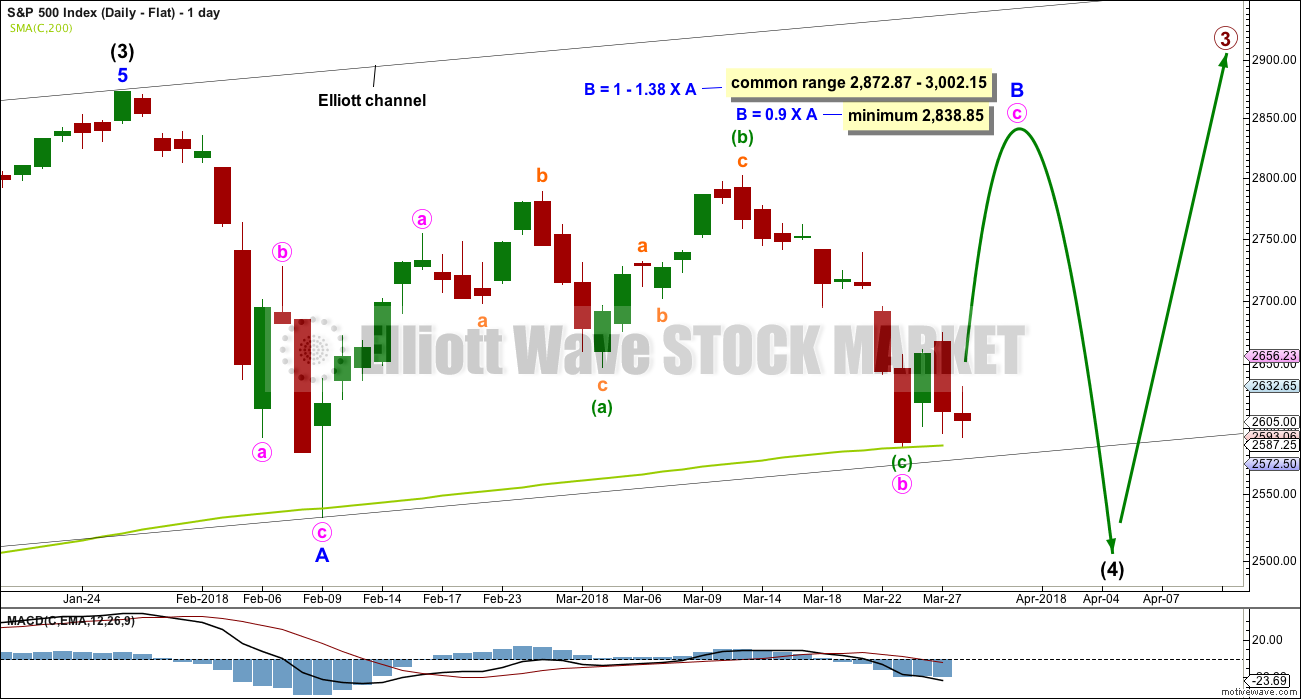
DAILY CHART – FLAT
Click chart to enlarge.
Flat corrections are very common. The most common type of flat is an expanded flat. This would see minor wave B move above the start of minor wave A at 2,872.87.
Within a flat correction, minor wave B must retrace a minimum 0.9 length of minor wave A at 2,838.85. The most common length for minor wave B within a flat correction would be 1 to 1.38 times the length of minor wave A at 2,872.87 to 3,002.15. An expanded flat would see minor wave B 1.05 times the length of minor wave A or longer, at 2,889.89 or above.
Minor wave B may be an incomplete zigzag, and within it minute wave c upwards must now subdivide as a five wave structure. How high minor wave B goes would indicate for this wave count what type of flat correction may be unfolding for intermediate wave (4).
It is also possible for this wave count that minute wave b may not be complete and may move lower.
When minor wave B is a complete corrective structure ending at or above the minimum requirement, then minor wave C downwards would be expected to make a new low below the end of minor wave A at 2,532.69 to avoid a truncation.
This wave count would require a very substantial breach of the 200 day moving average for the end of intermediate wave (4). This is possible but may be less likely than a smaller overshoot. Support at the 200 day average at this stage continues to hold and should be expected to do so until price breaks it.
DAILY CHART – ALTERNATE
Click chart to enlarge.
It is possible still that intermediate wave (4) was complete as a relatively brief and shallow single zigzag.
A new all time high with support from volume and any one of a bullish signal from On Balance Volume or the AD line would see this alternate wave count become the main wave count.
The target for minor wave 3 expects the most common Fibonacci ratio to minor wave 1.
It is also possible that minute wave c may need a final fifth wave down to complete it as per the hourly chart above for the combination. Minor wave 2 may not move beyond the start of minor wave 1 below 2,532.69.
TECHNICAL ANALYSIS
WEEKLY CHART
Click chart to enlarge. Chart courtesy of StockCharts.com.
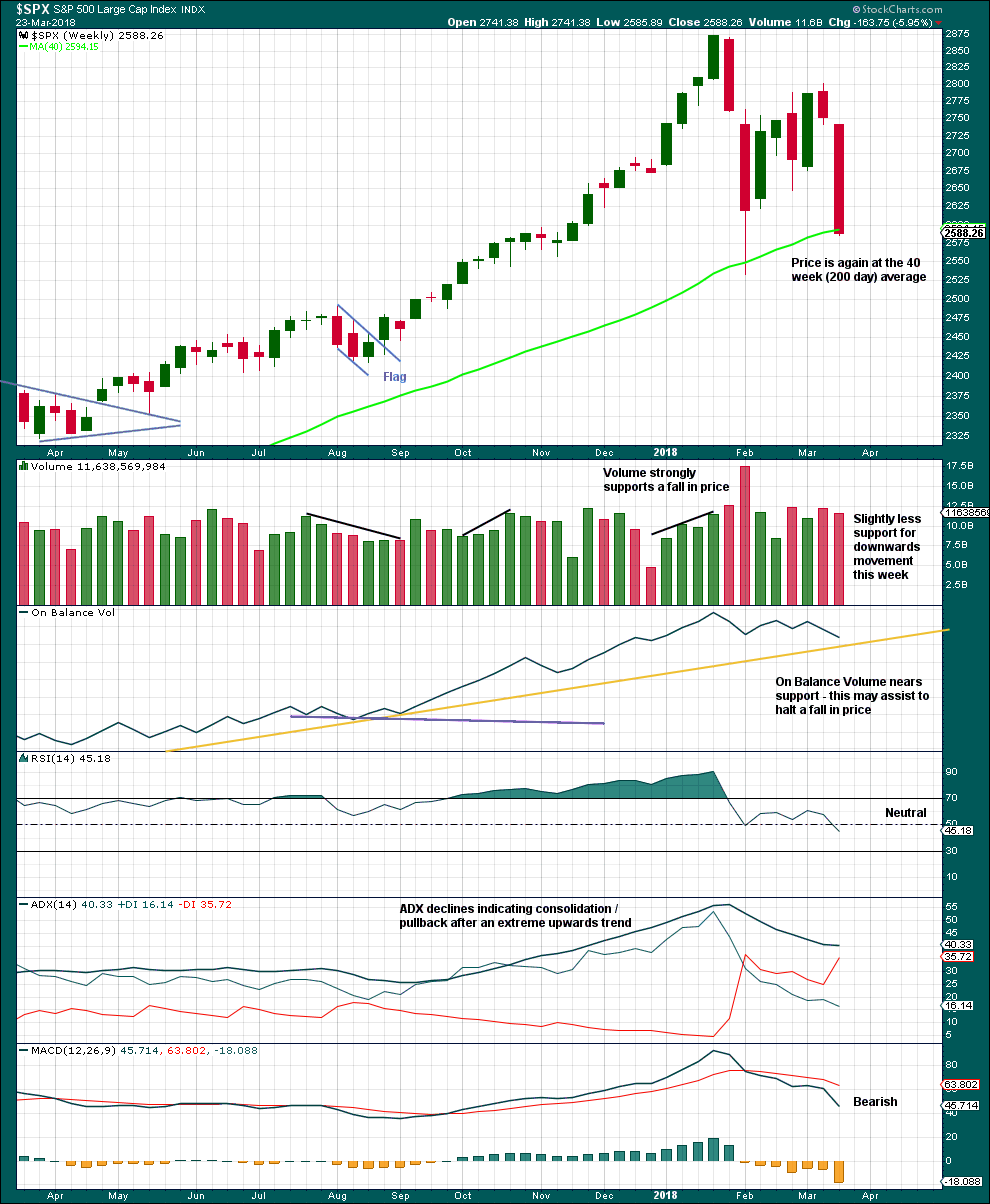
Although a slight decline in volume last week and On Balance Volume nearing support indicate downwards movement may end soon, the close very near to the low and the lack of a long lower wick indicate downwards movement is probably not yet done.
However, at the daily chart level, Monday’s strong upwards session suggests a low may be in place.
DAILY CHART
Click chart to enlarge. Chart courtesy of StockCharts.com.
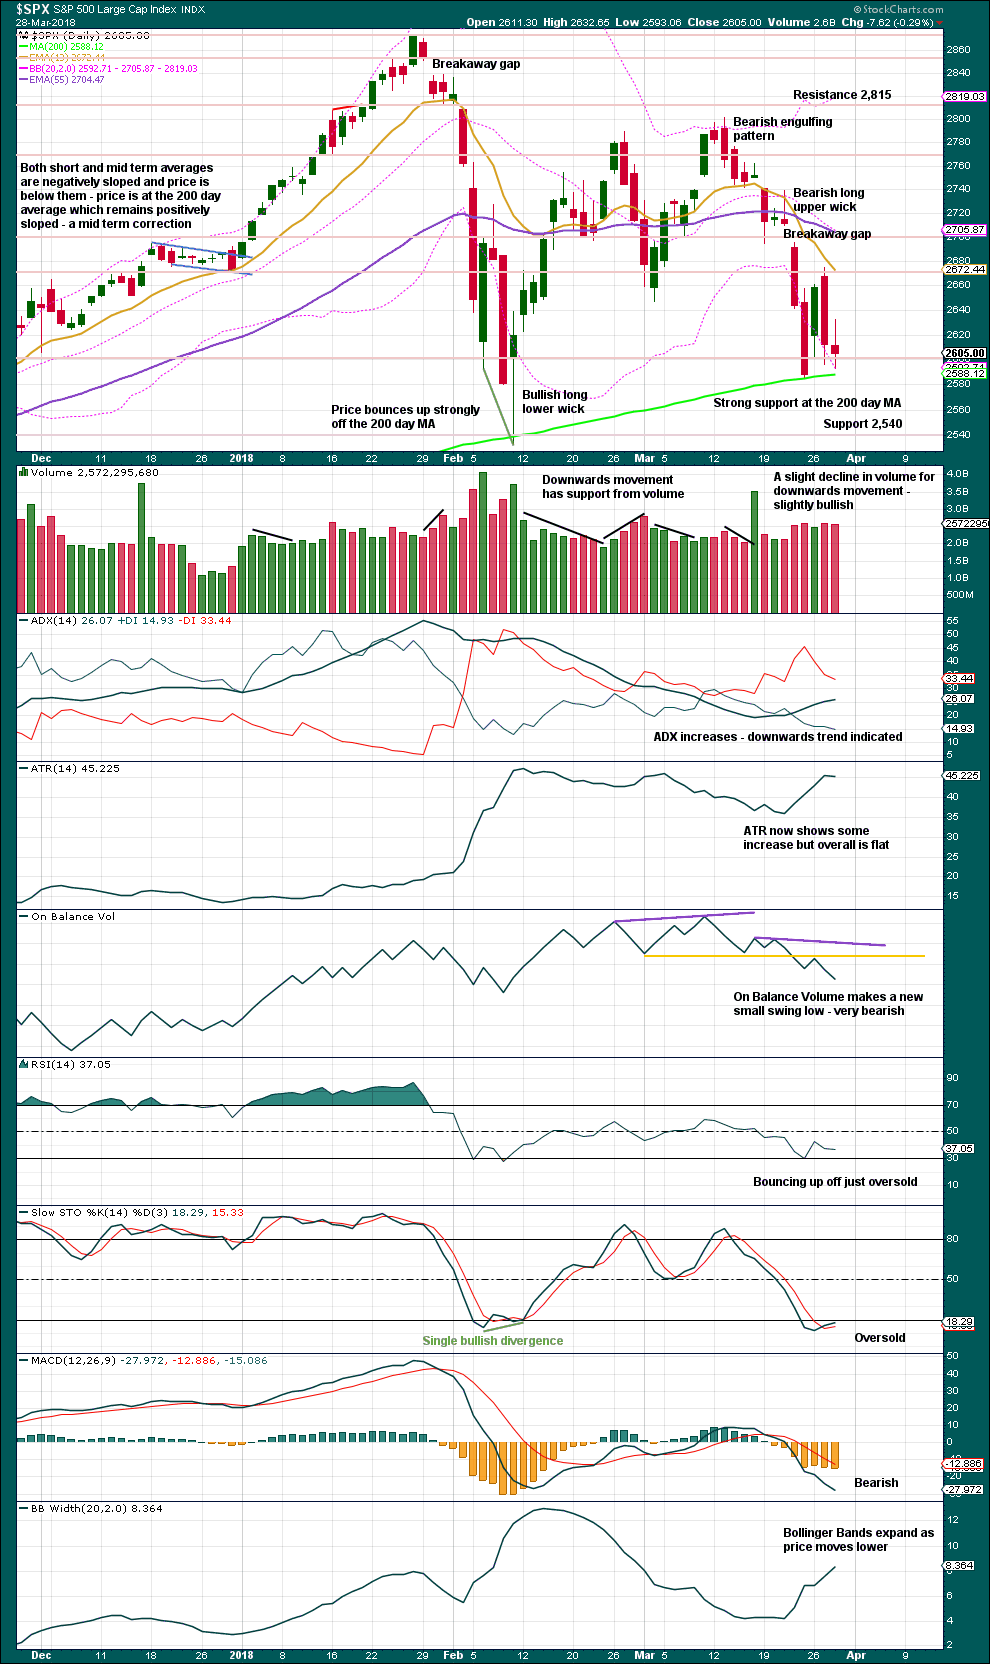
Assume until proven otherwise that the last noted gap is a breakaway gap from a small consolidation, which may provide resistance while it remains open.
This chart remains bearish. A new low today for On Balance Volume is very bearish and supports the hourly chart which sees more downwards movement to a target at 2,521 or 2,501. However, strong support continues at the 200 day moving average. Assume it will hold until it is breached. Next support below is about 2,540.
Looking back at how price has more recently behaved about the 200 day moving average, the last overshoot was on the 27th of June, 2016. The overshoot was by about 30 points. This was the end of primary wave 2 within the Elliott wave count.
Prior to that cycle wave IV spent about half of its duration well below the 200 day moving average, which would be expected for a cycle degree bearish wave to do.
Just prior to the end of cycle wave III the last major correction breached the 200 day moving average on the 13th of October to the 20th of October, 2014. Four full daily candlesticks were printed below it and the breach was by about 83 points.
The next prior breach was in November 2012, for three days by about 37 points.
It seems that this average may be overshot or breached at the beginning and end of a long bull wave. As this wave count now expects a cycle degree fifth wave is coming to an end, an overshoot or indeed a breach here would be entirely acceptable. It does not need to be huge, and it does not need to last very long.
VOLATILITY – INVERTED VIX CHART
Click chart to enlarge. Chart courtesy of StockCharts.com.
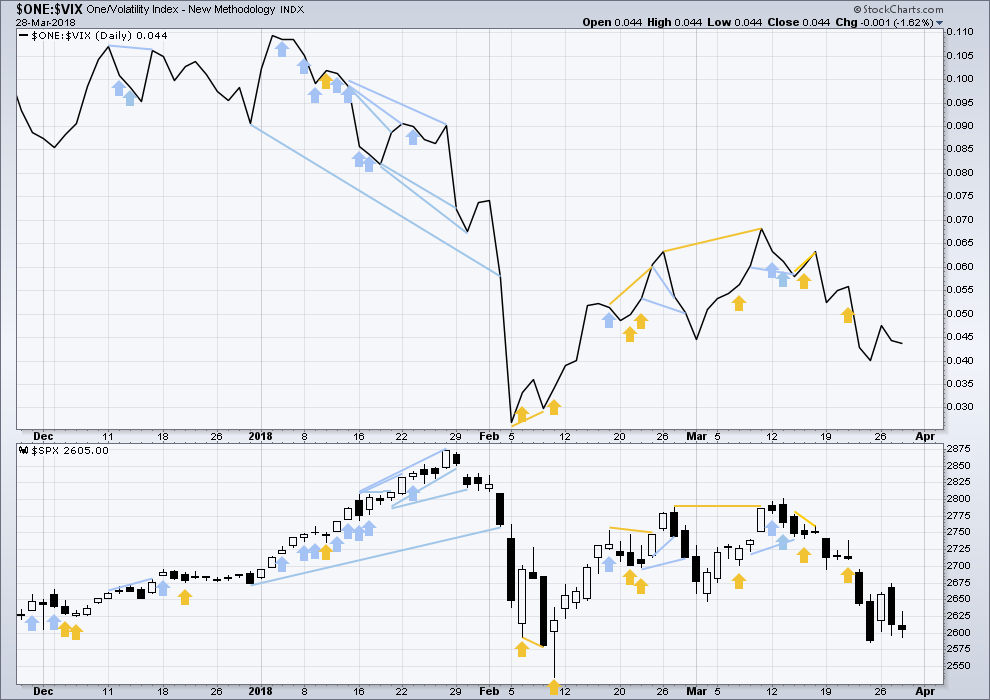
So that colour blind members are included, bearish signals will be noted with blue and bullish signals with yellow.
Normally, volatility should decline as price moves higher and increase as price moves lower. This means that normally inverted VIX should move in the same direction as price.
Downwards movement again has normal corresponding increase in market volatility as inverted VIX declines. This is bearish.
BREADTH – AD LINE
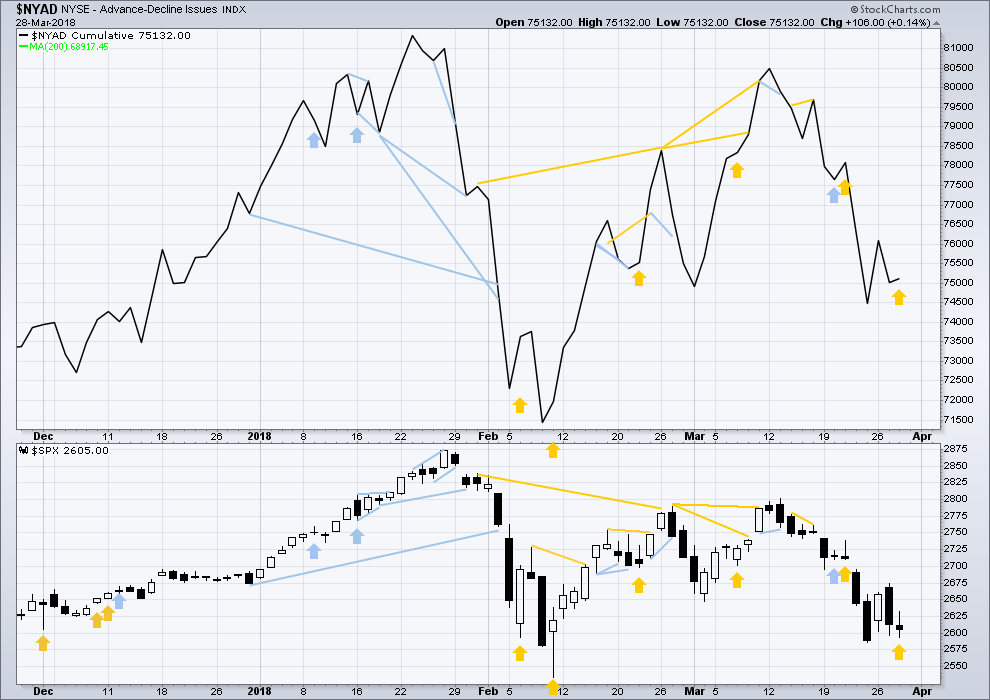
Click chart to enlarge. Chart courtesy of StockCharts.com.
There is normally 4-6 months divergence between price and market breadth prior to a full fledged bear market. This has been so for all major bear markets within the last 90 odd years. With no longer term divergence yet at this point, any decline in price should be expected to be a pullback within an ongoing bull market and not necessarily the start of a bear market.
All of small, mid and large caps last week fell strongly. The fall in price has broad support from market breadth. It was small caps though that had the least decline. This slight divergence indicates some weakness and may be interpreted as slightly bullish.
Breadth should be read as a leading indicator.
Downwards movement today came with a balance of volume lower. There is divergence today between price and the AD line; the decline in price does not have support from declining market breadth. The increase in breadth today is a leading indicator and is bullish. This supports the main Elliott wave count which expects an upwards swing to continue tomorrow.
DOW THEORY
All indices have made new all time highs as recently as nine weeks ago, confirming the ongoing bull market.
The following lows need to be exceeded for Dow Theory to confirm the end of the bull market and a change to a bear market:
DJIA: 17,883.56.
DJT: 7,039.41.
S&P500: 2,083.79.
Nasdaq: 5,034.41.
Charts showing each prior major swing low used for Dow Theory are here.
Published @ 09:27 p.m. EST.
A note for our more experienced traders and members here:
In terms of remaining on the right side of the law, sharing your trades here is absolutely fine. If it is a trade you take on a real account with real money, and it’s your own, then you can share away.
If you are waiting for a set up, sharing that here too is fine. If you choose to not take the trade that is fine too.
I’m a Registered Financial Advisor, so I can legally give trading advice. I tend to rarely do that as I am so cautious. I’ll only do it now if I have a high level of confidence, and I always temper trading advice with strong risk management advice.
But if you’re making the trades you comment on here and you’re not a RFA, you don’t need to be.
Share away.
Thank you for this good reminder, Lara! My takeaway might be the opposite of what you intend here, but considering what’s at stake, it’s probably best for this novice to lay out and not add any more needless drama to your comment section.
Just to clarify… by “this novice,” I mean me.
Second combination hourly chart updated:
This is the most immediately bearish count I have. So how’s this shaping up today?
Not so good.
I’ve redrawn the channel as an Elliott channel using the second technique. If minuette wave (iv) is complete then while minuette (v) unfolds downwards the upper edge should provide resistance. It’s not working.
That’s the first indication that this idea may be wrong.
🙂 🙂 🙂
this just happend? right?
This is my preferred wave count at this time. The triangle is looking good.
BUT
So many times over the years I’ve been charting a triangle, it fits perfectly and looks really good, only for it to be invalidated at the end. So alternates are always necessary when considering triangles. I’ve learned that the hard way.
So although this is my preferred count please keep an eye on alternates with reasonable attention and seriousness.
Looks like a small third wave up is underway folks.
Another boring day is up 1.5%. My, how quickly we get used to a high volatility market as if it’s normal. It’s the new normal!! I think we at least have a C wave up in progress re: the combination or triangle. Still strong bearish momentum on the weekly, and there’s probably several more weeks left of this intermediate 4, with more highly volatile up and down movement. “A trader’s market” I guess and I scored nicely today, recovering after my mugging in the whipsaw action yesterday. Still considering how to identify such an environment early enough to handle it profitably (or…properly stand aside).
Top of “ii” here or almost here? Yesterday and today (so far) look corrective to me, but I’ve been fooled countless times before. Not trading it. Another hour or two should hopefully bring better clarity.
I don’t know.
What I do know is that I’ve got a 5 min stochRSI buy trigger just now (but not yet a macd buy), I have both macd and StochRSI buy triggers recently activated at the hourly level, and there is an active day level stochasticRSI buy trigger (the daily macd is still in a sell). And this 200 day MA area has held up well…so far. I’m taking bites and cashing pretty quick, but watching closely for indication I should be holding for a bit longer term, etc. Carefully working it long. If you trade equities vs. just indexes, I really like GS here, while there is still some downside risk I think it’s relatively minimal and/or the logical stop loss is relatively close by, and in the next few weeks I suspect GS will be moving back to its recent highs assuming a strengthening market in general. This intermediate 4 is inexorably approaching “time out”.
I generally view this market action at the weekly level as a big W-X-Y, and don’t buy for a moment at this point in time that a bear market is ensuing. The Y may still extend a heck of a ways deeper in the next few weeks though, either matching the initial 2533 low or going down such that Y = X around 2466 or so. Or…this could even be it. These lows have held even in the face of a massive tech debacle. We’ll see!
That’s a great observation about GS Kevin. Thanks for mentioning it. I’m going to definitely consider going long GS after we get a wave 2 correction from this impulse wave 1 up…
Solid fundamentals AND technicals. Thanks again…
Best of luck Ari. It’s not the only thing I like. A few others that may be worth considering are: RS and COP. COP’s relative strength through this overall selloff period has been excellent, and it could rip if/as the market starts back into daily level impulse mode. I also really like SQ.
I think another hour or two has provided the clarity you were looking for. ii is now too high, it’s outside a channel.
That’s for sure!
Boring !!!!!!!!!!!!!!!!!!!!!!!!!! I am going to go and do something a bit more exciting today. Have a great day.
Probably right…but there could be a bit of a move coming in the 1-2:30pm ET period, me thinks. Could be.
😮
You’re missing the action now Rodney!
Not to quibble, but yesterday’s “small range day” was actually a 1.5% range, traversed a couple of times! Only a small range day by comparison to 3% selloff days. By historical norms, a very high volatility range day. Everything is “getting larger” on these charts, lol!!
Now THIS (so far) is what I call a small range day market: 0.6% top to bottom, or thereabouts, so far. May not last (let’s hope not)….
Well yes, that is true. Perhaps I should have qualified it with a “smaller” range, and not call it actually small.
Some of you may have heard of Wayne Gretsky’s reponse to the question of what made him such a great hockey player. His reponse was something to the effect that while most hockey players focused all their attention on where the puck was, he had learned to focus on where the puck was going to be!
That was an amazing bit of insight and in many respects that idea applies very well to trading the markets. As traders, we can easily expend an awful lot of time and energy consumed with daily gyrations of the market, and completely miss the bigger picture about what the market may be telling us about its likely direction. I am learning how critical this is when you are managing a large portfolio.
A great example of this idea is what is going on right now with tech stocks. There were a number of things about the Tesla chart a few weeks ago that hinted strongly about where it was likely headed and that was the time to get positioned. I exited 80% of my position for a ten bagger yesterday.
The incredible advance in tech indices has been narrowly focused on a few insanely over-bought, over-loved, over-hyped, and definitely over-leveraged names.
What do you think is likely to happen to those indices that advanced so powefully on narrow breadth when the names doing all the heavy liftng start to take a beating? Remember a lot of folk in these stocks are highly ld
leveraged, including one well known bank and a few sovereign wealth funds.
Go where the puck is going to be…
Timing is key, and as I learned the hard waiting for the short vol trade to blow up, somtimes you just have to be prepared for a slow moving puck! 🙂
Hi Verne, can you give the details on the TSLA chart that made it stand out as a short a few weeks ago? Pleaaaaase! 🙂
Send me an e-mail. Gotta be a bit more circumspect in what I say in public the next few months.
Most traders have an awful time pulling the trigger on counter-trend rallies. 99% of them, even experienced ones, just won’t do it because it is so counter- intuitive. It really is quite amazing!
I am closing up shop early today ahead of the holiday.
To all our Jewish friends a blessed Passover!
Have a great weekend everyone!
Sure thing! My email is funkumite@hotmail.com
Lookig forward to hearing your thoughts 🙂
That’s a timely comment Verne, because overnight I was thinking about how I’ve been waiting over a year for “this setup” (which isn’t quite here yet???), for a significant investment long. I accept the thesis this market isn’t cooked here, and will be moving back up to and probably well above the ATH so far. So the macro level question is “when is the right time to make the buy”? I.e., commit to skating to where I believe the puck is going to be headed. It’s never an easy call…
Yes Kevin. That is why I mentioned yesterday, “What would entice me to go long?” 2450 SPX was the answer. However, I am not going to hold my breath for that price point as it may not materialize. I am still favoring the corrective triangle count with us in the early stages of Minor D up. I suspect before mid May the triangle will complete and act as a launching pad for the next move upwards to 2900 minimum with a chance of the 3600 mark.
On a roll here. #1 with a bullet!
Thanks Lara. Have a great day.
Awesome Rodney!