More upwards movement was expected. This is how the session began, completing a five up, which the Elliott wave count expected, but a strong pullback at the end of the session has come earlier than anticipated.
Summary: The target for upwards movement is now 2,740. A new high above 2,674.78 would add confidence in an upwards swing.
A new low below 2,585.89 would indicate downwards movement has one more low before it is done, and the target would be at 2,561.
Classic technical analysis today offers slightly more support to the view that another low may be coming in the next day or so.
Always practice good risk management. Always trade with stops and invest only 1-5% of equity on any one trade.
New updates to this analysis are in bold.
The biggest picture, Grand Super Cycle analysis, is here.
Last historic analysis with monthly charts is here. Video is here.
An alternate idea at the monthly chart level is given here at the end of this analysis.
An historic example of a cycle degree fifth wave is given at the end of the analysis here.
MAIN ELLIOTT WAVE COUNT
WEEKLY CHART
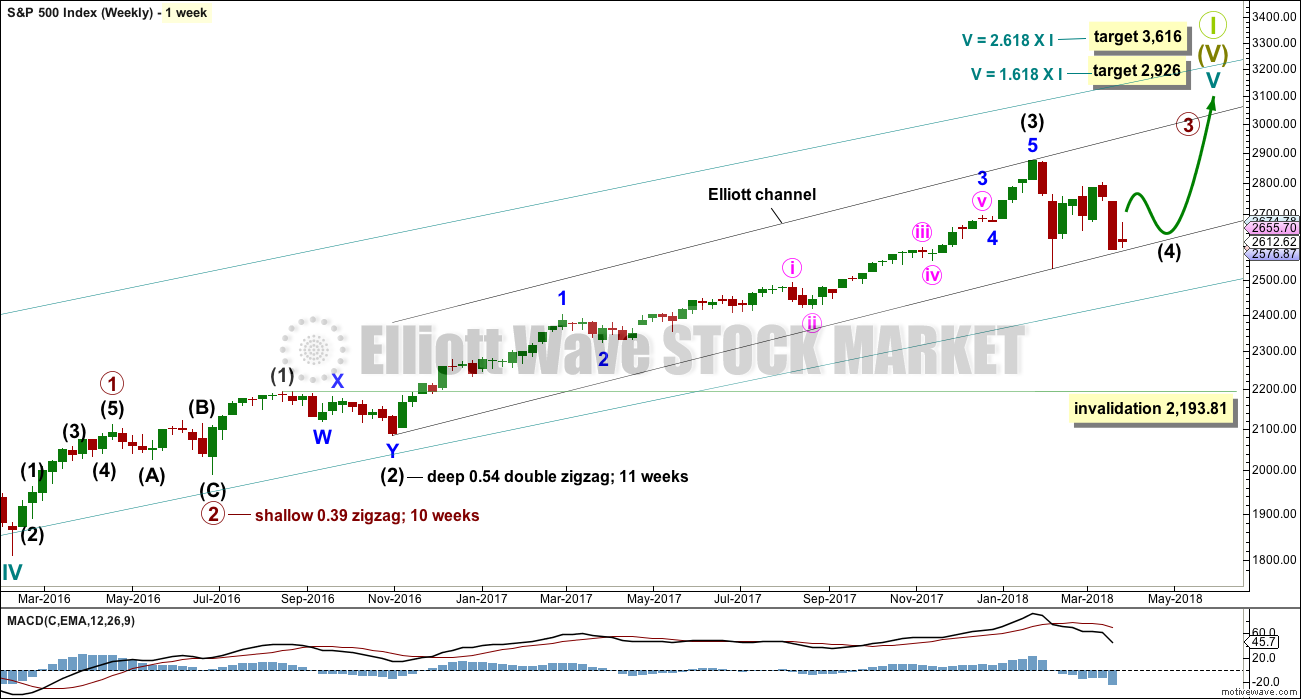
Cycle wave V must complete as a five structure, which should look clear at the weekly chart level. It may only be an impulse or ending diagonal. At this stage, it is clear it is an impulse.
Within cycle wave V, the third waves at all degrees may only subdivide as impulses.
Intermediate wave (4) has breached an Elliott channel drawn using Elliott’s first technique. The channel is redrawn using Elliott’s second technique as if intermediate wave (4) was over at the last low. If intermediate wave (4) continues sideways, then the channel may be redrawn when it is over. The upper edge may provide resistance for intermediate wave (5).
Intermediate wave (4) may not move into intermediate wave (1) price territory below 2,193.81. At this stage, it now looks like intermediate wave (4) may be continuing further sideways as a combination, triangle or flat. These three ideas are separated into separate daily charts. All three ideas would see intermediate wave (4) exhibit alternation in structure with the double zigzag of intermediate wave (2).
A double zigzag would also be possible for intermediate wave (4), but because intermediate wave (2) was a double zigzag this is the least likely structure for intermediate wave (4) to be. Alternation should be expected until price proves otherwise.
DAILY CHART – TRIANGLE
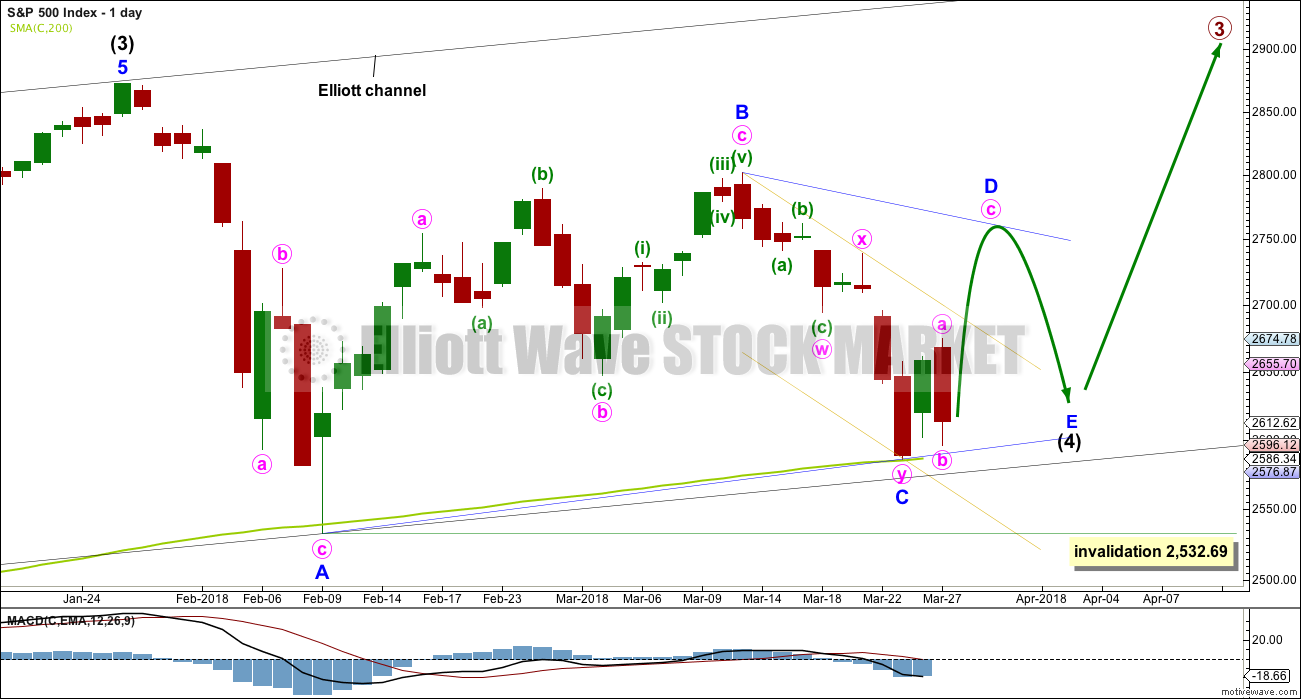
This first daily chart looks at a triangle structure for intermediate wave (4). The triangle may be either a regular contracting or regular barrier triangle. Within the triangle, minor waves A, B and now C may be complete.
If intermediate wave (4) is a regular contracting triangle, the most common type, then minor wave D may not move beyond the end of minor wave B above 2,801.90. Minor wave D would be very likely to end about 0.80 to 0.85 the length of minor wave C.
If intermediate wave (4) is a regular barrier triangle, then minor wave D may end about the same level as minor wave B at 2,801.90. As long as the B-D trend line remains essentially flat a triangle will remain valid. In practice, this means the minor wave D can end slightly above 2,801.90 as this rule is subjective.
When a zigzag upwards for minor wave D is complete, then this wave count would expect a final smaller zigzag downwards for minor wave E, which would most likely fall reasonably short of the A-C trend line.
If this all takes five weeks (including this week) to complete, then intermediate wave (4) may total a Fibonacci 13 weeks and would be just two weeks longer in duration than intermediate wave (2). There would be very good proportion between intermediate waves (2) and (4), which would give the wave count the right look.
At this stage, it is possible that minor wave C is over as per the labelling on this daily chart and the first hourly chart below, but it is also possible that it could continue lower tomorrow. An alternate hourly chart covers that possibility.
The best fit channel about minor wave C is redrawn to be as conservative as possible. It is copied over to the alternate hourly chart below.
HOURLY CHART
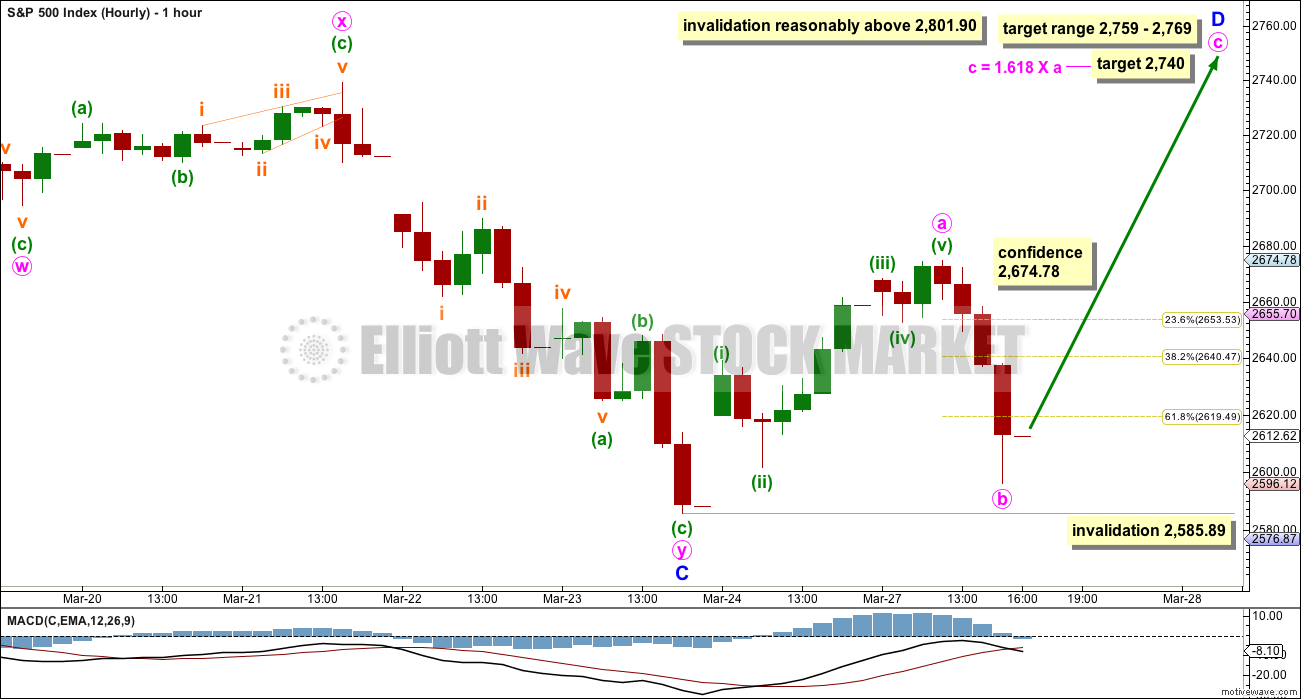
The zigzag downwards may be complete. A new wave up may have begun.
Minor wave D within a triangle should subdivide into a simple A-B-C corrective structure, most likely a simple zigzag.
The target range would see minor wave D reach a very common 0.80 to 0.85 length to minor wave C.
So far minute wave a looks like a five. Minute wave b will subdivide as a zigzag on the five minute chart, and it may be over at Tuesday’s low.
The target for minute wave c to end would see minor wave D shorter than the common length of 0.8 to 0.85 of minor wave C. This would be acceptable.
Some confidence in this wave count at the hourly chart level may be had if price makes a new high above 2,674.78.
ALTERNATE HOURLY CHART
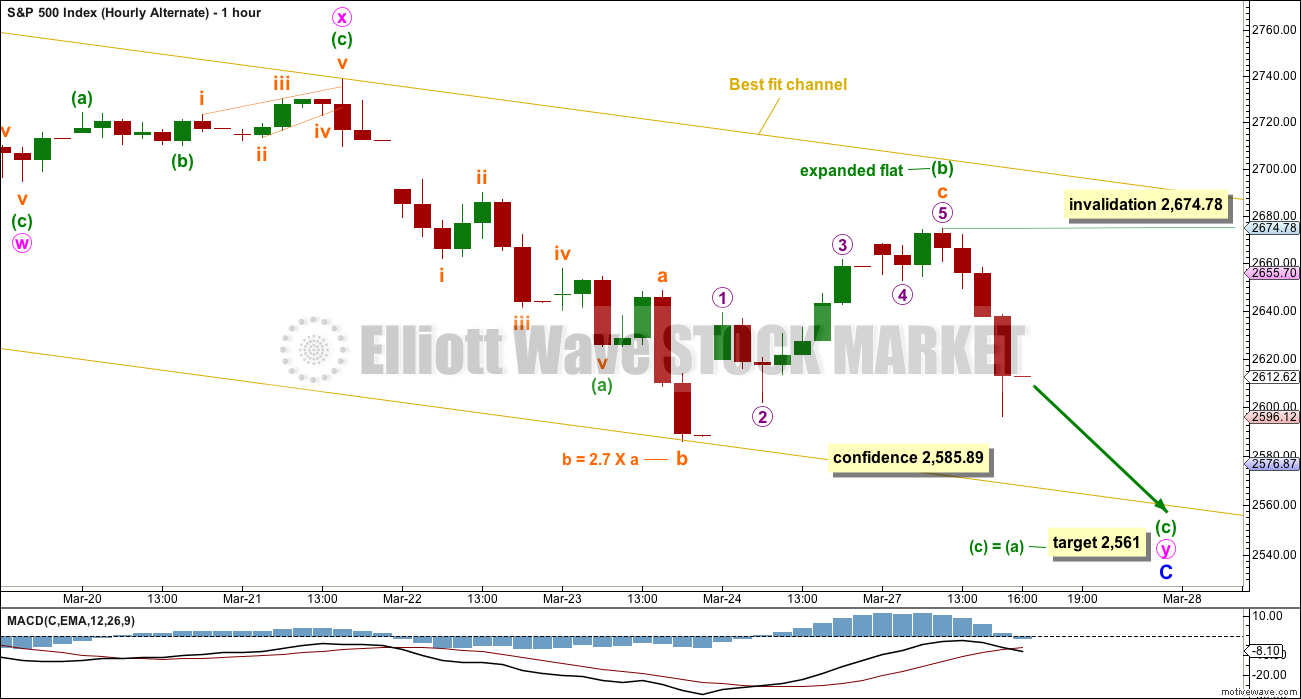
It is also possible that the second zigzag in the double for minor wave C is incomplete.
If the zigzag of minute wave y is continuing, then within it minuette wave (b) must be seen as an expanded flat correction (all subdivisions will fit at the five minute chart level). The problem here though is the length of subminuette wave b within the expanded flat. While there is no rule stating a limit for B waves within flats, there is a convention that states when the B wave is more than twice the length of the A wave the probability of a flat is extremely low. I have seen a few expanded flats where wave B is longer than twice the length of wave A, but they are uncommon.
The probability of this wave count would be reduced for this reason.
If price makes a new low tomorrow below 2,585.89, then the target for downwards movement to end would be at 2,561. This would expect the most common Fibonacci ratio between minuette waves (a) and (c).
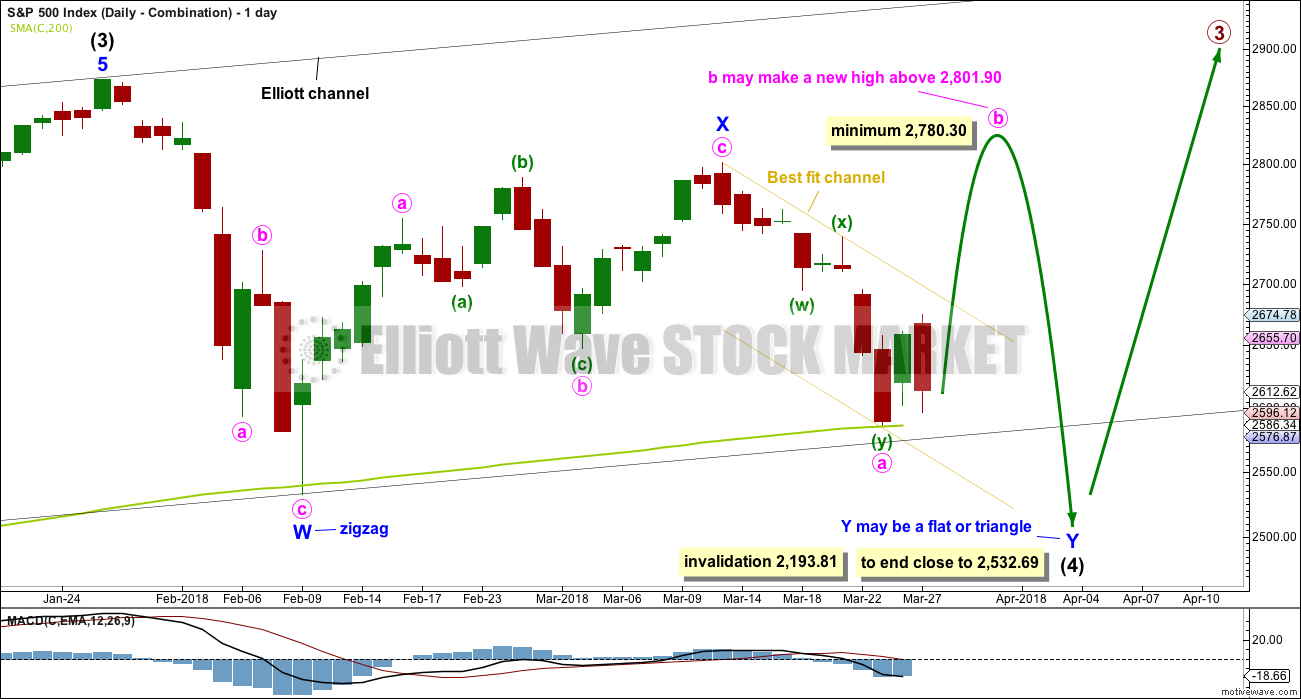
DAILY CHART – COMBINATION
Double combinations are very common structures. The first structure in a possible double combination for intermediate wave (4) would be a complete zigzag labelled minor wave W. The double should be joined by a three in the opposite direction labelled minor wave X, which may be a complete zigzag. X waves within combinations are typically very deep; if minor wave X is over at the last high, then it would be a 0.79 length of minor wave W, which is fairly deep giving it a normal look. There is no minimum nor maximum requirement for X waves within combinations.
The second structure in the double would most likely be a flat correction labelled minor wave Y. It may also be a triangle, but in my experience this is very rare, so it will not be expected. The much more common flat for minor wave Y will be charted and expected.
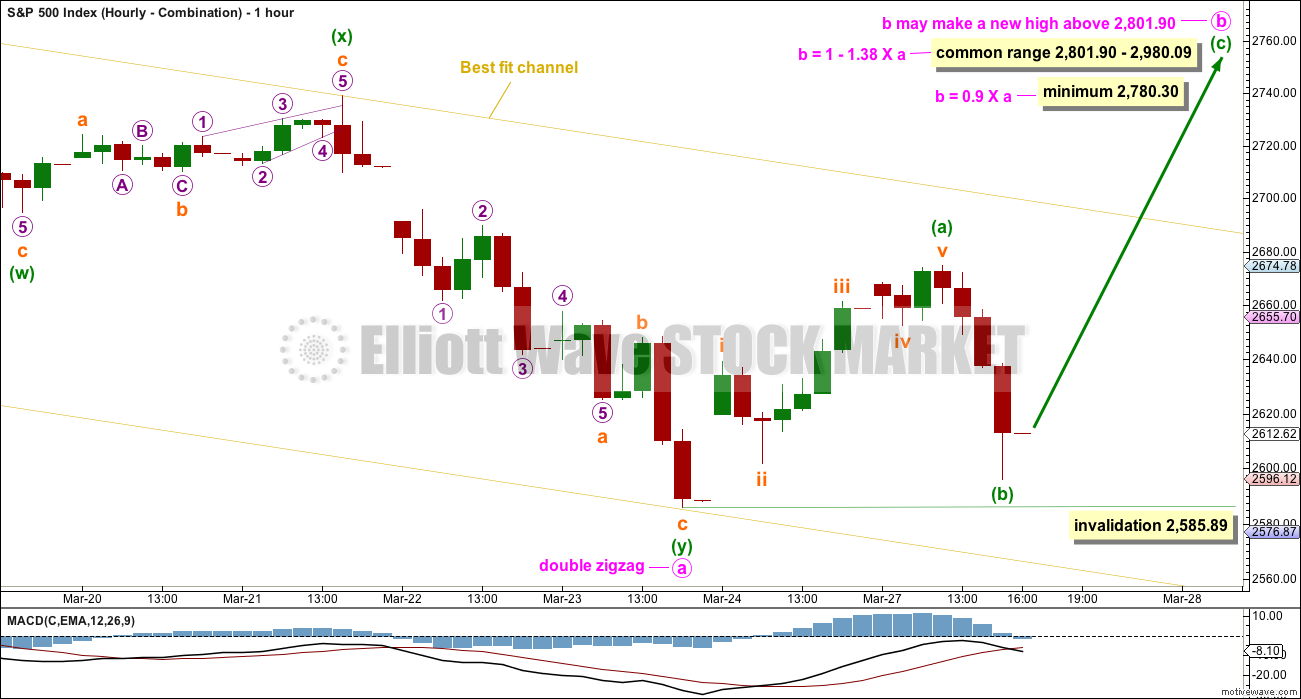
A flat correction would subdivide 3-3-5. Minute wave a must be a three wave structure, most likely a zigzag. It may also be a double zigzag. On the hourly chart, this is now how this downwards movement fits best, and this will now be how it is labelled.
Minute wave b must now reach a minimum 0.90 length of minute wave a. Minute wave b must be a corrective structure. It may be any corrective structure.
The purpose of combinations is to take up time and move price sideways. To achieve this purpose the second structure in the double usually ends close to the same level as the first. Minor wave Y would be expected to end about the same level as minor wave W at 2,532.69. This would require a strong overshoot or breach of the 200 day moving average, which looks unlikely.
HOURLY CHART – COMBINATION
The first two daily charts expect a double zigzag is over and a new corrective structure upwards has begun. The labelling is the same.
For this combination wave count, the alternate hourly chart for the triangle works in exactly the same way.
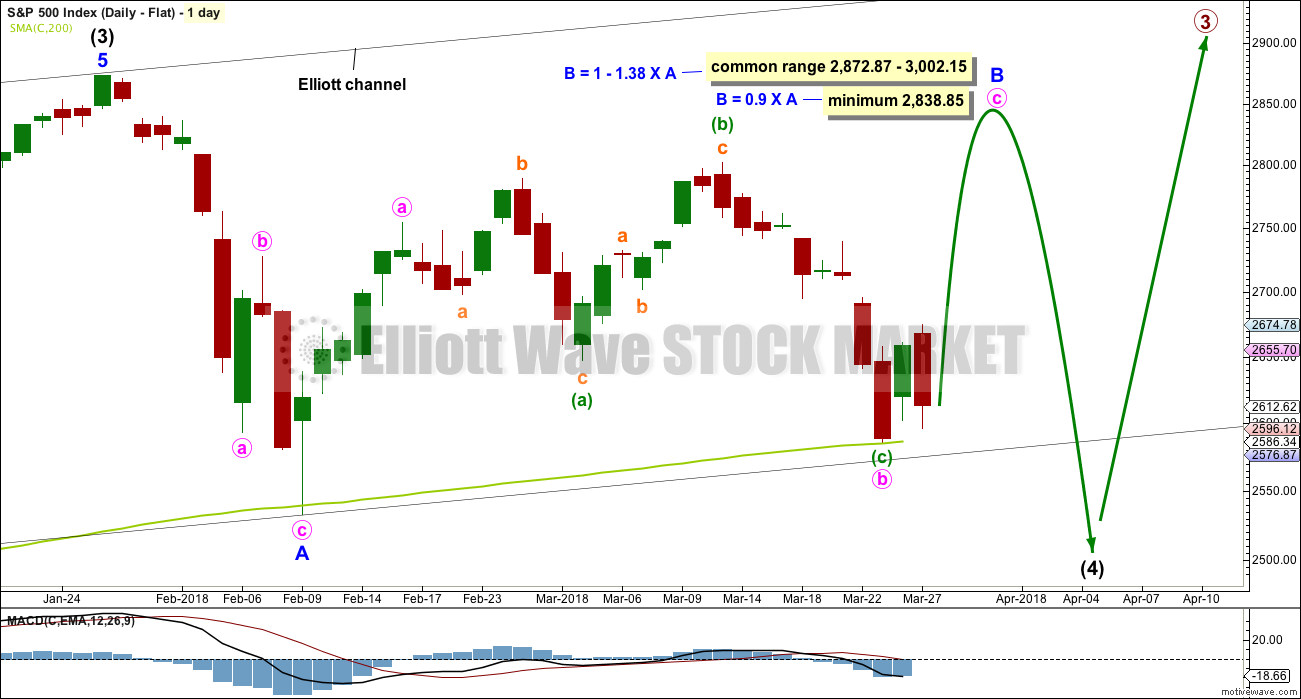
DAILY CHART – FLAT
Flat corrections are very common. The most common type of flat is an expanded flat. This would see minor wave B move above the start of minor wave A at 2,872.87.
Within a flat correction, minor wave B must retrace a minimum 0.9 length of minor wave A at 2,838.85. The most common length for minor wave B within a flat correction would be 1 to 1.38 times the length of minor wave A at 2,872.87 to 3,002.15. An expanded flat would see minor wave B 1.05 times the length of minor wave A or longer, at 2,889.89 or above.
Minor wave B may be an incomplete zigzag, and within it minute wave c upwards must now subdivide as a five wave structure. How high minor wave B goes would indicate for this wave count what type of flat correction may be unfolding for intermediate wave (4).
It is also possible for this wave count that minute wave b may not be complete and may move lower.
When minor wave B is a complete corrective structure ending at or above the minimum requirement, then minor wave C downwards would be expected to make a new low below the end of minor wave A at 2,532.69 to avoid a truncation.
This wave count would require a very substantial breach of the 200 day moving average for the end of intermediate wave (4). This looks unlikely.
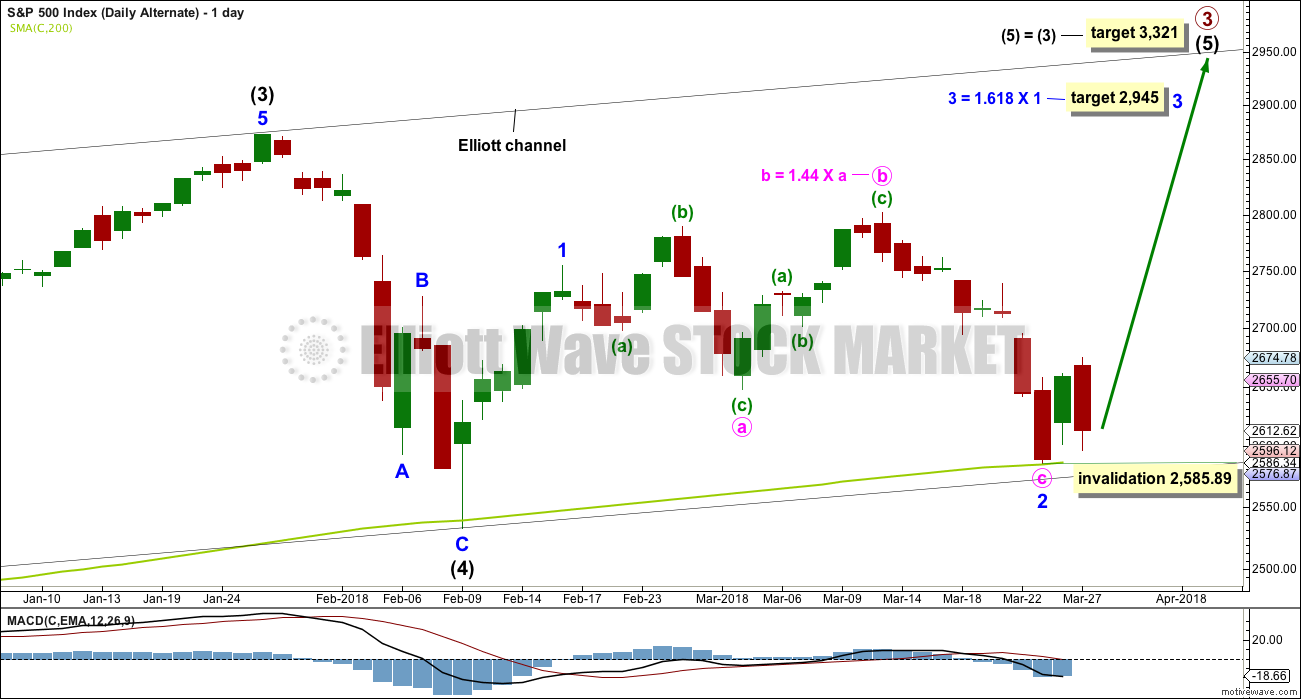
DAILY CHART – ALTERNATE
It is possible still that intermediate wave (4) was complete as a relatively brief and shallow single zigzag.
A new all time high with support from volume and any one of a bullish signal from On Balance Volume or the AD line would see this alternate wave count become the main wave count.
The target for minor wave 3 expects the most common Fibonacci ratio to minor wave 1.
Within minor wave 3, no second wave correction may move beyond the start of its first wave below 2,585.89.
TECHNICAL ANALYSIS
WEEKLY CHART
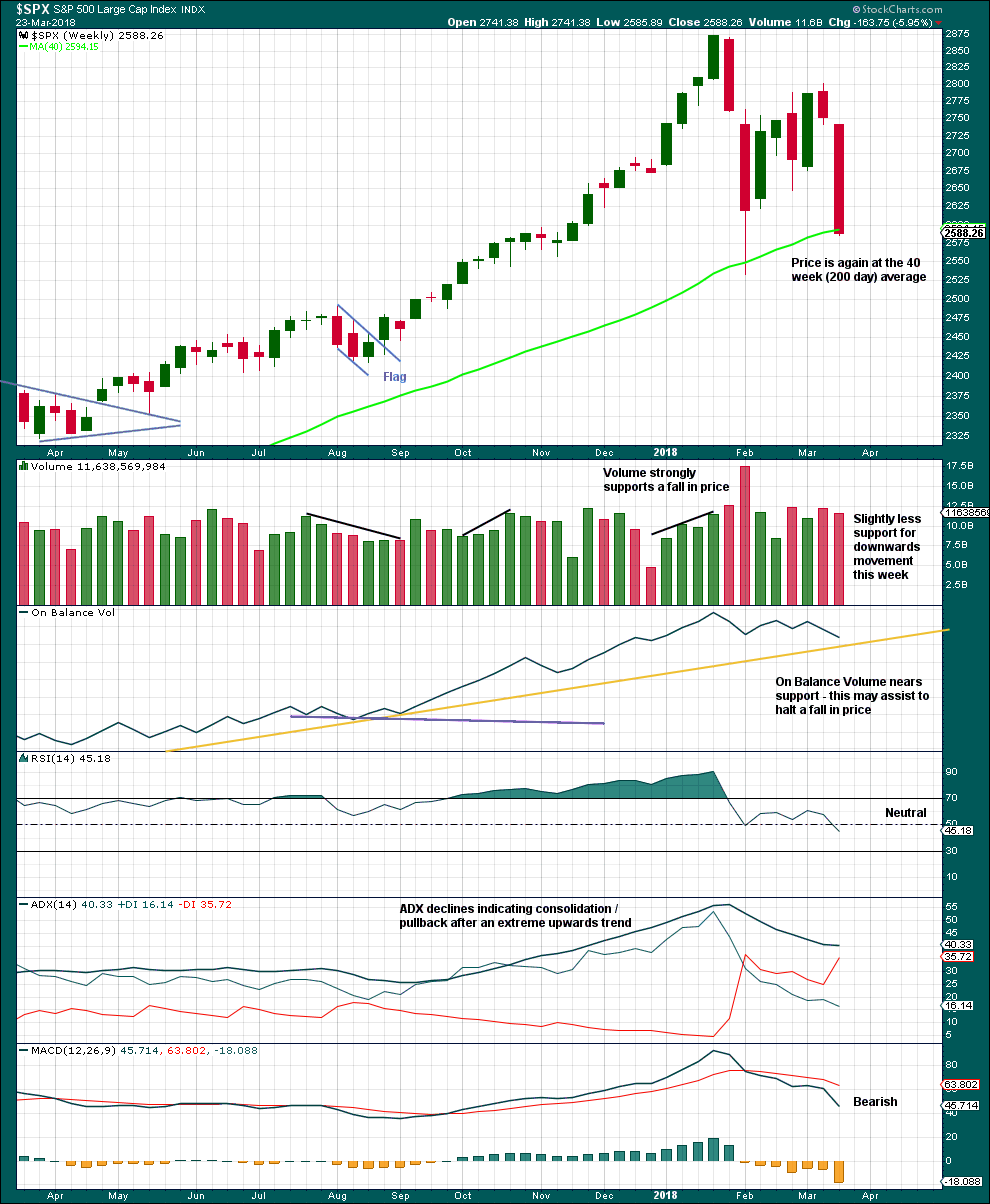
Click chart to enlarge. Chart courtesy of StockCharts.com.
Although a slight decline in volume last week and On Balance Volume nearing support indicate downwards movement may end soon, the close very near to the low and the lack of a long lower wick indicate downwards movement is probably not yet done.
However, at the daily chart level, Monday’s strong upwards session suggests a low may be in place.
DAILY CHART
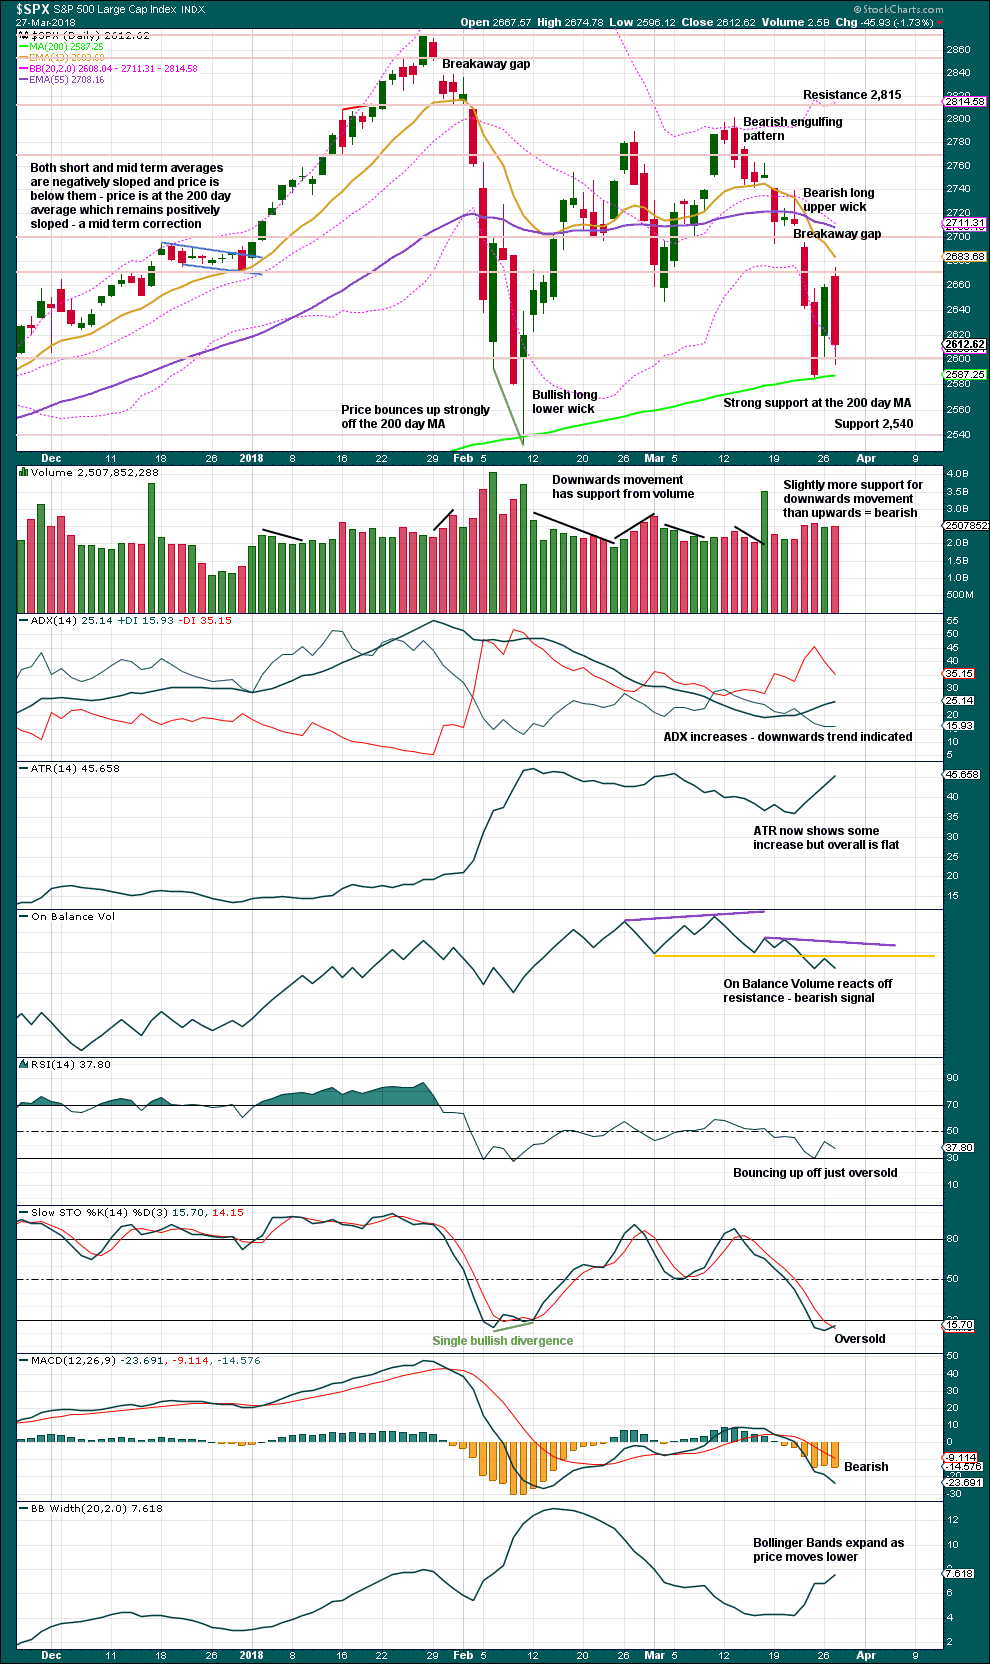
Click chart to enlarge. Chart courtesy of StockCharts.com.
Assume until proven otherwise that the last noted gap is a breakaway gap from a small consolidation, which may provide resistance while it remains open.
Overall, this chart is fairly bearish. It offers a little more support to the alternate hourly chart, which expects new lows tomorrow.
There is still strong support at the 200 day moving average. This may be overshot, but in the first instance expect price to bounce up reasonably close to it.
VOLATILITY – INVERTED VIX CHART
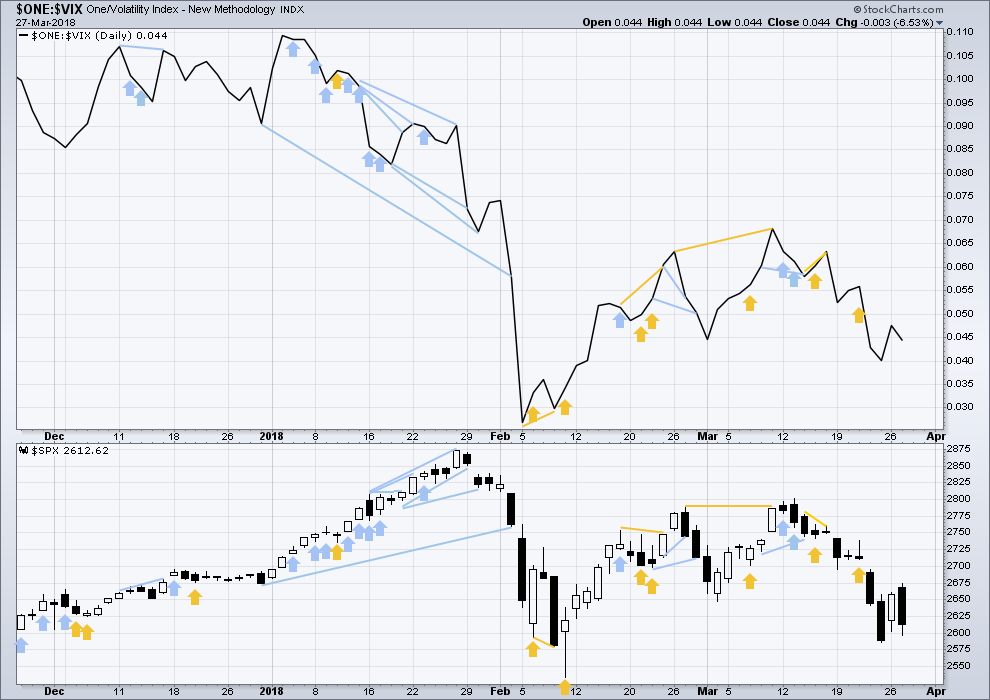
Click chart to enlarge. Chart courtesy of StockCharts.com.
So that colour blind members are included, bearish signals will be noted with blue and bullish signals with yellow.
Normally, volatility should decline as price moves higher and increase as price moves lower. This means that normally inverted VIX should move in the same direction as price.
Downwards movement for Tuesday has a normal corresponding increase in market volatility to support it. This is bearish. There is no divergence.
BREADTH – AD LINE
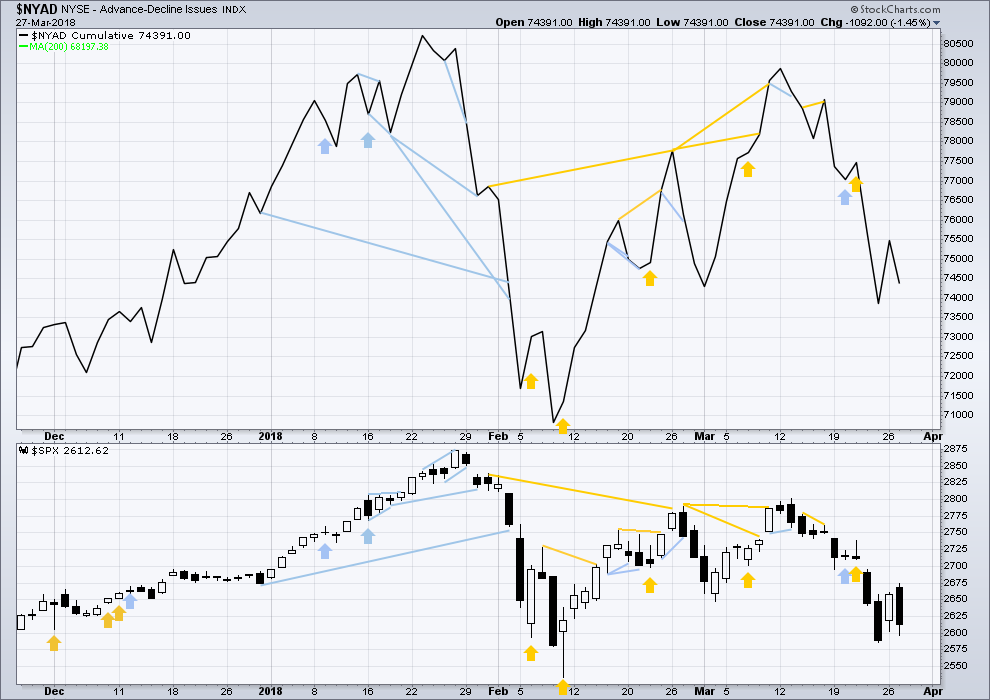
Click chart to enlarge. Chart courtesy of StockCharts.com.
There is normally 4-6 months divergence between price and market breadth prior to a full fledged bear market. This has been so for all major bear markets within the last 90 odd years. With no longer term divergence yet at this point, any decline in price should be expected to be a pullback within an ongoing bull market and not necessarily the start of a bear market.
All of small, mid and large caps last week fell strongly. The fall in price has broad support from market breadth. It was small caps though that had the least decline. This slight divergence indicates some weakness and may be interpreted as slightly bullish.
Breadth should be read as a leading indicator.
Downwards movement for Tuesday has support from declining market breadth. This is bearish. There is no divergence.
DOW THEORY
All indices have made new all time highs as recently as nine weeks ago, confirming the ongoing bull market.
The following lows need to be exceeded for Dow Theory to confirm the end of the bull market and a change to a bear market:
DJIA: 17,883.56.
DJT: 7,039.41.
S&P500: 2,083.79.
Nasdaq: 5,034.41.
Charts showing each prior major swing low used for Dow Theory are here.
Published @ 09:24 p.m. EST.

Main hourly updated:
I’ve checked on the 1 minute chart, subminuette i will subdivide as a five wave impulse. Micro 1 within it looks like a leading contracting diagonal.
Alternate hourly updated:
Hmmm…looks like a breakout either way, up or down, from today’s daily range just might be definitive re: #1 or #2…unless big money instantly and super aggressively fades that move too! Market is a box of shaken rattlesnakes today. In fact…here’s my box!!!! Waiting for an exit….
Hi Lara
After todays close your saying that the market is only has 44 points to the downside.
135 Points to the upside.
I would think that if the market breaks below the 200 day moving average i would think that it would get punished a lot harder then only 23 points.
Please advise
Thank You
It’s broken the 200 day moving average before… only to quickly reverse and move back above it. And so with past behaviour the only possible guide we have, we cannot say with any level of confidence that a break of the 200 day MA means price has to fall substantially.
Vol coiling in an uptrend. My money is on the alternate. Have a great evening all!
Mongolian Beef on the menu! 🙂
Verne,
Agree long term I.e. few months down from present but short term is oversold. Rally today morning got smoked by Amzn news and now it turns out it was not concrete but folks got whopped
News is a total distraction and irrelevant. Oversold may be a necessary condition for a reversal but it is certainly by no means in and of itself a sufficient condition. Some of the most spectacular declines you will ever see occur at oversold readings. I have to say I am really amazed by some things prople are saying about the current market. Selling rips has been the obvious trade for weeks now and was indicated back when DJI took out its 50 day.
I’m still partial to the bullish count here, though I can certainly see it going either way. The bears deny the presence of real selling pressure here, but in the absence of an exogenous shock I don’t really understand what people expect to happen. We aren’t going to get many Feb-5, Feb-8, & Feb-9 like declines until some hard numbers turn south, we have a bank run, a currency devaluation, etc.
Still not seeing any rumors of major financial instability (a la Lehman), so if anyone has some juicy inside info I’d appreciate a look at it.
I haven’t found much in the way of rationality driving this market myself. None of the big sell offs seemed highly correllated with anything exogeneous of significance. I think there could certainly be another push down here to get Y = W, without any “news”. Just my $0.02. I view this market as 100% unpredictable at this point in time. 100%. Big money could decide at any moment to buy like crazy…or sell like crazy. As I see it anyway.
Perhaps many retired baby boomers need to liquidate some of their holdings to pay capital gains taxes etc. April 15th approaches after a great year in equities for many IRA’s & 401.k’s etc. Speculation on my part of course.
I agree that the selloffs are mostly internally driven. There market doesn’t “need” a reason to go up or down. However, I don’t think we’ll see much in the way of panic selling until there are serious exogenous pressures, whether they be financial or political. I could see there being one more deep push below the 200dma, but I’m skeptical we’ll see a new low below 2530.
I think the wheels are in motion for an economic slowdown, but I also think the big money is anticipating one or two more big spikes to ATHs before the data goes south.
Actually, Mr. Market is giving off huge clues as to what his next move is likely to be…! 🙂
Hi Verne, can you please elaborate on this? Maybe on today’s analysis comments
Hi Ari.
I have several indicators I use to make my own decisions.
Since you asked, I will share one with you.
Mr. Market will tell you it’s time to go long by taking out the 50 day SMA of VIX on a CLOSING basis…
Clearly for nimble traders there are daily profit oppotunities but paying attention to vol will keep you from wrong assumptions.
What can cause traders (especially day traders) the most consternation, frustration and downright anger? Triangles, that is what causes the most pain. So, my bet (without money on it!) is the triangle correction is the most likely. Thus, we are on our way up to Minor D.
Thanks Lara for the intraday update. Interesting that in the midst of relatively high volatility, we can even have days of boredom like today.
Today’s range was 1.5%. One point five percent. The RANGE, and it moved back and forth through that range a few times!!! Wow. That’s pretty volatile in my book. Serious churning.
Boroden had a big pile of support levels under the market last night on AMZN. Today, it blew through all of them…except the very lowest! And it’s now flashed all kinds of short term buy triggers. I dunno….it’s a dangerous market out there, but I think AMZN might just be a tad over sold here.
Whipsaw madness! Small B-wave before another run at the 200 DMA?
Looks a bit bear-flag-ish to me. Compare on 15 minute chart with 11:45am-2pm action in SPX on 3/23. Then it was followed by another major and sharp downmove.
Good catch, Kevin. It does indeed look similar. We’ll soon enough.
It may not be going anywhere fast, but this market sure is covering a lot of ground! Up down up down up down, and not small moves either. It’s a pretty dynamic battle.
Yep. Just the right size to pick my pocket today. Dang it!
I had (have) a number of daily/hourly time projections indicating a significant swing low in SPX somewhere in the last Friday to yesterday range. Carolyn Boroden has timing for a low today. I’m waiting patiently for hourly level buy triggers, OR fresh sell triggers. Basically, escape one way or another from this consolidation range the market is in.
Here are a few reasons to be cautious.
The kind of violent upwards move we saw on Monday is almost never seen in true bull markets. It had all the earmarks of a classic short squeeze. As for other market indicators, here are a few I find quite interesting: The 200 day MA is being challenged, but NOT at a time we are seeing any signs of selling capitulation, (in fact the opposite) we have yet to see a 90% down day, McClelland Oscillator is still not in oversold territory, ten day average A/D line indicators not yet at extreme oversold levels, new 52 week lows not at extreme l, TRIN
not at oversold levels, and my most reliable guage, no VIX capitulation spike sporting the characteristic long upper wick. I would expect to see more of these signals at a true bottom at intermediate degree, so therefore I think their absence warrants caution. I would consider a decisive break of multiple index 200 day MA on high volume and momentum quite ominous, and a possible game changer.
As Lara has pointed out, the current profile is bearish.
Have a great trading day every one!
I am first to look here to figure out what is going on. I was out most of the day and certainly before the market tanked. If, at the end of January, anyone wanted volatility to return to the market, their wish have been granted.
Lara you do very well in preparing us for the multitude of possible EW counts, confidence points, targets and invalidation points. And all of that is tempered / enlightened by your TA. I don’t know how you do it. But it is all extremely helpful.
For me, I am glad to be sitting on hands with regard to the US equity markets. This is certainly an uncertain time. I am on the prowl though (with patience) for the bull to finally take control again to go long. It is clearly something that is much easier said than done. Mr. Market has a habit of whipsawing many.
What would entice me to go long, I’d say 2450 or so. We shall see.
It is certainly an uncertain time! Well said…
I dont want to disrespect anyone certainly not lara but as of late does it not seem like all these calls are wrong. Im only say isnt there a possibility that this entire count isnt right? The fact the there are only two possibilities and they are both to the upside just a matter of when just doesnt seem right but that only my take. If there is a reasoning behind it id like to know why?Is a bear market here beyond the realm of possibility?
When it comes to markets, just about anything is possible. The difficulty is figuring out what is probable! 😉
I believe Lara is correct in not showing a macro level bear market analysis, because there isn’t yet a combination of technical and elliott wave indicators the market is IN an overall bear market. That is, all indications so far are that the market is “merely” in an intermediate (or possibly primary I suppose) wave 4. Lara is showing bullish and bearish reads on that. This isn’t a science of “prediction”, in my view. It’s a science of alternative roadmaps, with probabilities associated with them, and clear “inflection points” among where one lives and goes to “#1” and another dies, etc. I agree with Lara that a macro level bear market view (not a 4 but start of a major motive 5 wave down correcting the market by minimally 10%) is just not indicated at this time.
I am not speaking for Lara. Rather, I am speaking for what I understand about her current EW counts. First of all, from an EW perspective, the weekly count is not completed to the upside. Therefore, there is no bear market count. This is supported by the fact that Lowry’s breath indicators have not turned over. They show no negative divergences. In the past 99 years or something like that, a bear market has not begun until this divergence has been evident. Again, this is one of the primary reasons we have not seen a bear market EW count from Lara.
I cannot disagree with this assessment. In fact, it is to her credit that Lara is sticking with the long term weekly counts she has instead of capitulating in the face of this relatively large correction. Furthermore, it gives me confidence to enter into long positions as the correction comes to a conclusion.
Finally, corrections present something like 23 different patterns / variations. Trying to determine what the final count of a correction will be once it is over is more than extremely difficult. It is almost a fool’s game. Many traders want to anticipate what the correction is and the end up with losing trades. I have tried trading the corrections and anything short of Primary degree has been a craps shoot.
Like Verne, I am looking for some sort of capitulation for a bottom. We want to go long when all the public and TV talking heads are throwing in the towel.
In the not too distant future, as we pass SPX 2900, I believe we will look back to this correction and thank Lara for her excellent guidance.
For another look at why the longer term trend is still quite bullish see Ciovacco Capital presentations on YouTube. Highly recommended.
Have a great day all.
BTW tradeshark, I post this only in answer to your question. I mean no offense. I just want to make sure that is clear. In addition, I noted last week, that I know of at least two EW counters who indicate a long term top is already in place. One of those is Daneric whose counts are available to the public.
FYI… The “Old man” says if THE big “move down doesn’t happen like right now, then some other count is in play”.
Seems, he is about to throw in the towel on his crash call… if, above.
The other counts in play are Lara’s… IMO.
Thanks for the pointer to the latest from Ciovacco. Excellent material.
BTW Tradeshark. There is nothing at all disrespectful about expressing a contrarian point of view. As many posters here will tell you, that is a role I have played on the forum for quite some time lol!
To be perfectly honest, Lara’s bullish viewpoint has been right and my bearish one wrong far more often than not! Differing viewpoints make for a healthy forum. When everyone is saying the exact same thing, chances are something is being missed! I have not made up my mind if the market has topped or not. I do know, as a trader, that something about price action is dramatically different since the Feb swoon. 🙂
I think Rodney has answered the question below. I’ll just reiterate quickly:
1. No divergence with market breadth at the high. If this is the start of a new bear market, it would be the first time in nearly 100 years it’s begun with no divergence between price and breadth. This from Lowrys.
2. The Elliott wave structure is incomplete.
This is why I use classic TA as well as Elliott wave, and why I’m a CMT. It gives me more depth to the analysis, my goal is to be right as often as humanly possible.
You have been a very good teacher, Lara. Thanks much as always.