
More downwards movement to a target at 2,565 – 2,566 was expected before a trend change, but the trend change has arrived earlier than expected. There is strong support at the 200 day moving average.
Summary: The target for upwards movement now as most likely is a range from 2,759 to 2,769. If price moves higher, then a target would be about 2,801.90 to 2,980. If price keeps rising through this second target range, then the next target is at 2,945, but this is the least likely scenario.
Always practice good risk management. Always trade with stops and invest only 1-5% of equity on any one trade.
The biggest picture, Grand Super Cycle analysis, is here.
Last historic analysis with monthly charts is here. Video is here.
An alternate idea at the monthly chart level is given here at the end of this analysis.
An historic example of a cycle degree fifth wave is given at the end of the analysis here.
MAIN ELLIOTT WAVE COUNT
WEEKLY CHART
Click chart to enlarge.
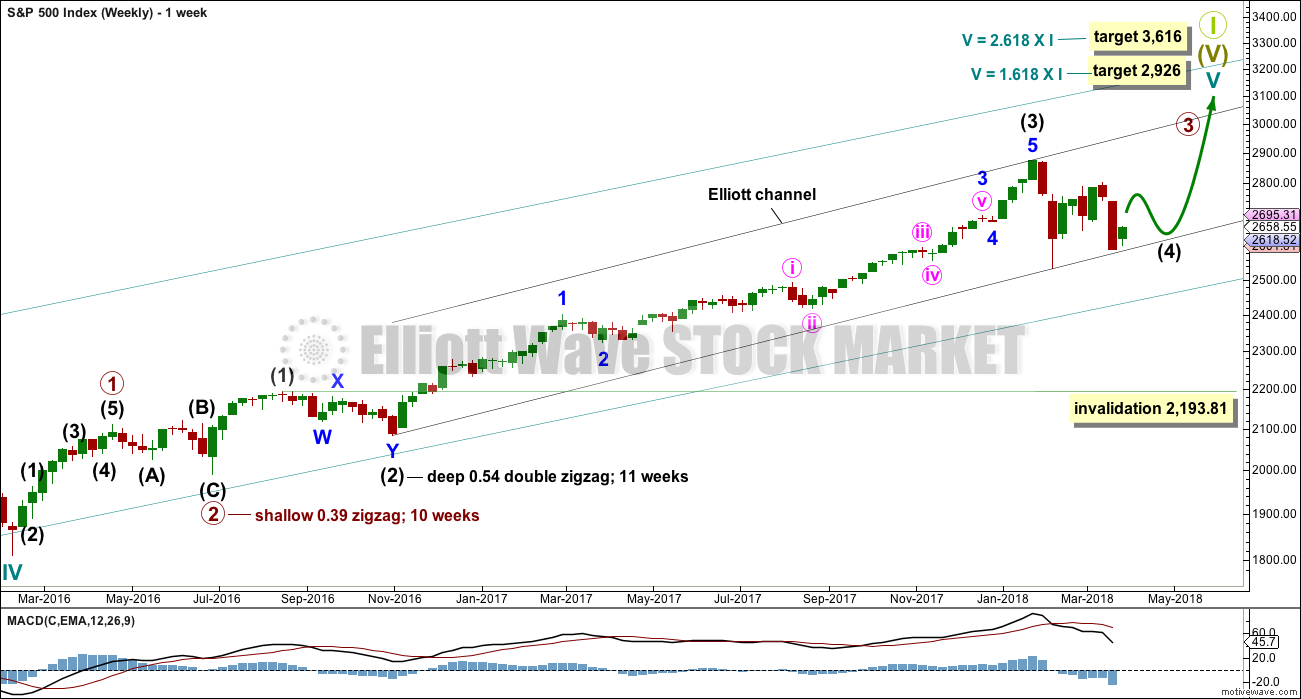
Cycle wave V must complete as a five structure, which should look clear at the weekly chart level. It may only be an impulse or ending diagonal. At this stage, it is clear it is an impulse.
Within cycle wave V, the third waves at all degrees may only subdivide as impulses.
Intermediate wave (4) has breached an Elliott channel drawn using Elliott’s first technique. The channel is redrawn using Elliott’s second technique as if intermediate wave (4) was over at the last low. If intermediate wave (4) continues sideways, then the channel may be redrawn when it is over. The upper edge may provide resistance for intermediate wave (5).
Intermediate wave (4) may not move into intermediate wave (1) price territory below 2,193.81. At this stage, it now looks like intermediate wave (4) may be continuing further sideways as a combination, triangle or flat. These three ideas are separated into separate daily charts. All three ideas would see intermediate wave (4) exhibit alternation in structure with the double zigzag of intermediate wave (2).
A double zigzag would also be possible for intermediate wave (4), but because intermediate wave (2) was a double zigzag this is the least likely structure for intermediate wave (4) to be. Alternation should be expected until price proves otherwise.
DAILY CHART – TRIANGLE
Click chart to enlarge.
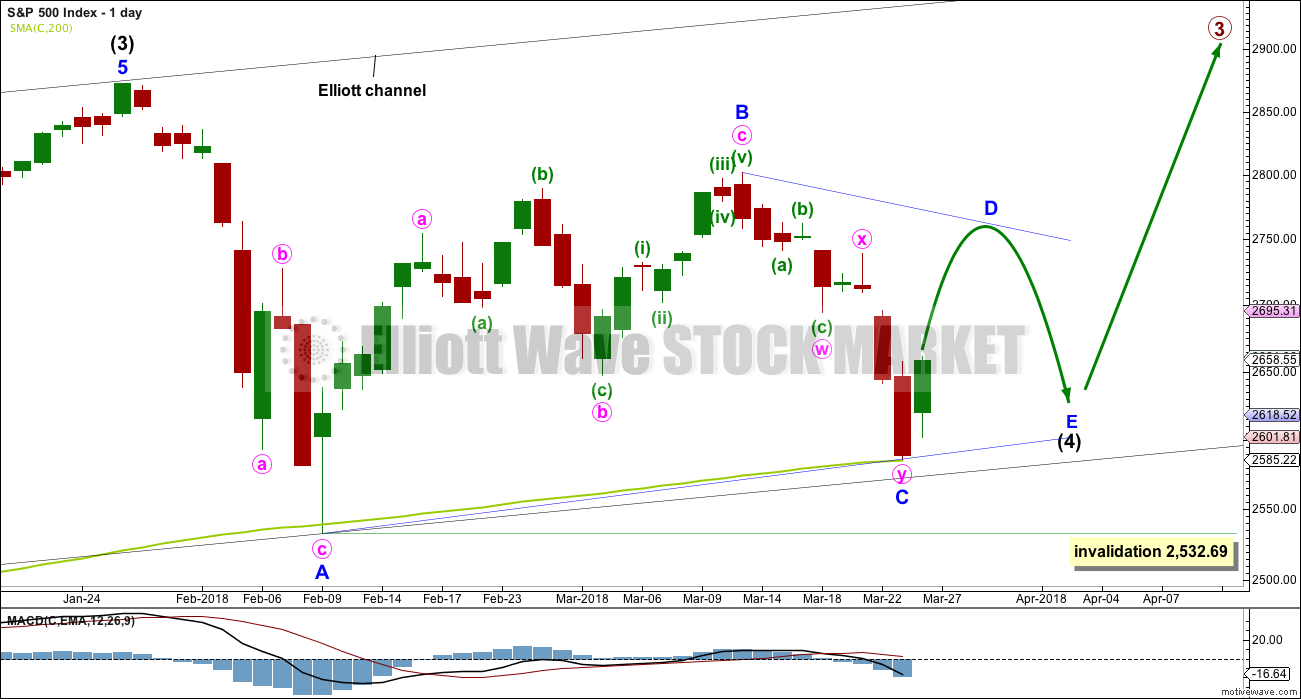
This first daily chart looks at a triangle structure for intermediate wave (4). The triangle may be either a regular contracting or regular barrier triangle. Within the triangle, minor waves A, B and now C may be complete.
If intermediate wave (4) is a regular contracting triangle, the most common type, then minor wave D may not move beyond the end of minor wave B above 2,801.90. Minor wave D would be very likely to end about 0.80 to 0.85 the length of minor wave C.
If intermediate wave (4) is a regular barrier triangle, then minor wave D may end about the same level as minor wave B at 2,801.90. As long as the B-D trend line remains essentially flat a triangle will remain valid. In practice, this means the minor wave D can end slightly above 2,801.90 as this rule is subjective.
When a zigzag upwards for minor wave D is complete, then this wave count would expect a final smaller zigzag downwards for minor wave E, which would most likely fall reasonably short of the A-C trend line.
If this all takes five weeks (including this week) to complete, then intermediate wave (4) may total a Fibonacci 13 weeks and would be just two weeks longer in duration than intermediate wave (2). There would be very good proportion between intermediate waves (2) and (4), which would give the wave count the right look.
HOURLY CHART
Click chart to enlarge.
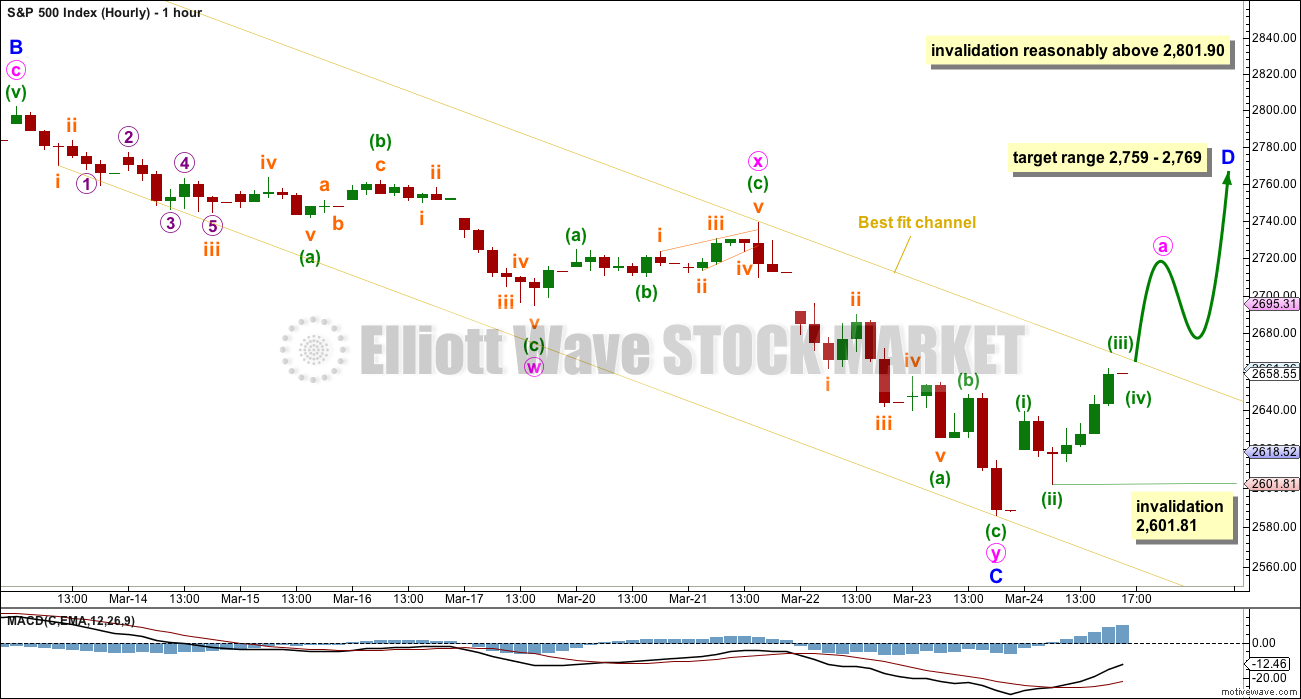
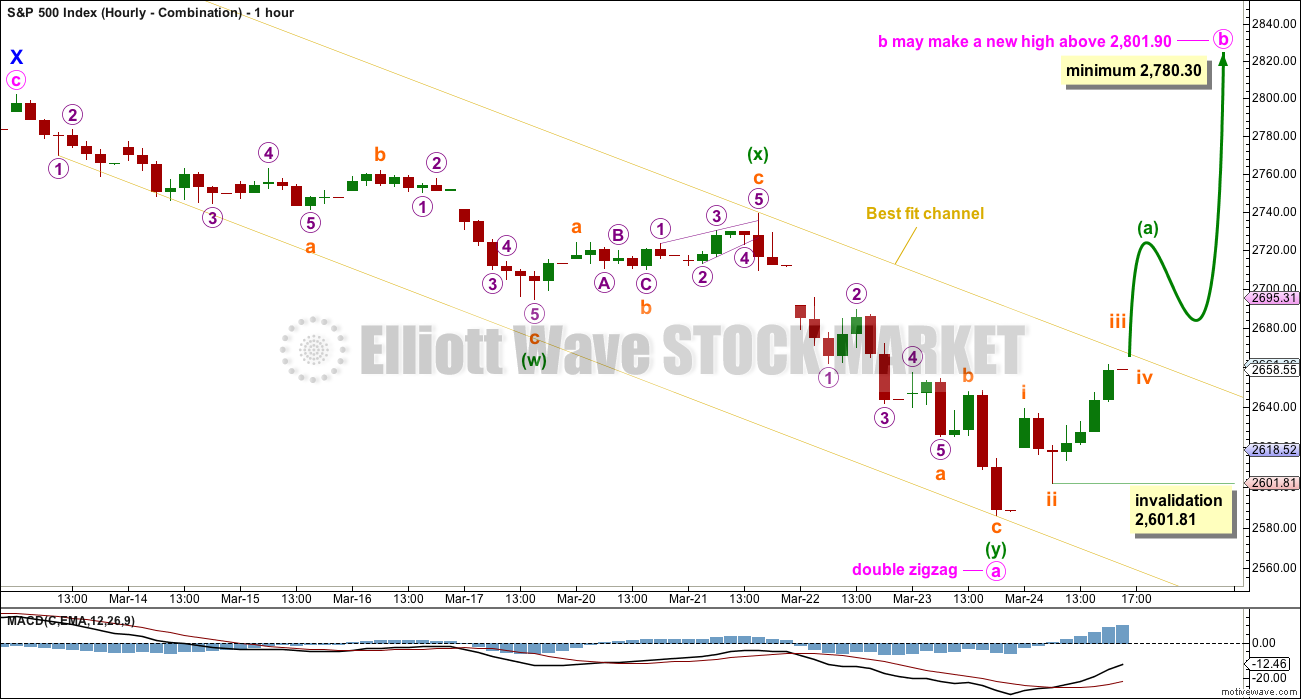
The zigzag downwards looks very likely now to be complete. A new wave up looks to have begun.
Look for price to find some resistance tomorrow at the upper edge of the yellow best fit channel.
Minor wave D within a triangle should subdivide into a simple A-B-C corrective structure, most likely a simple zigzag.
The target range would see minor wave D reach a very common 0.80 to 0.85 length to minor wave C.
DAILY CHART – COMBINATION
Click chart to enlarge.
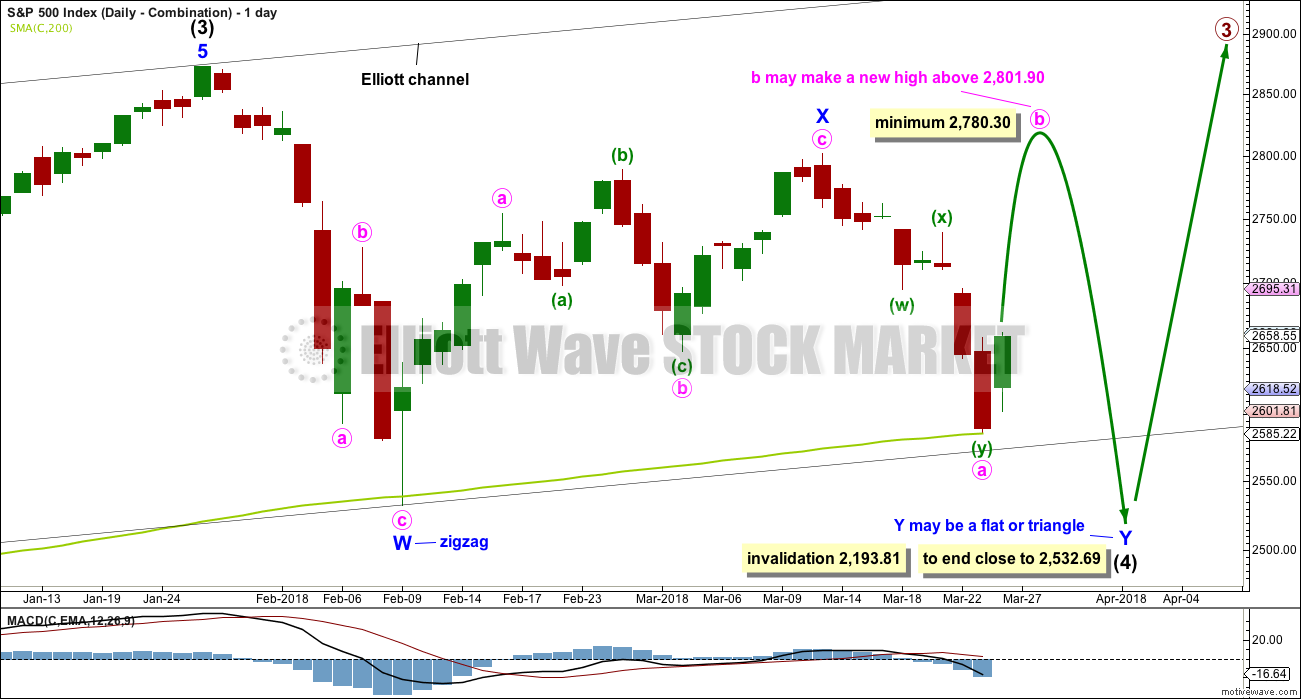
Double combinations are very common structures. The first structure in a possible double combination for intermediate wave (4) would be a complete zigzag labelled minor wave W. The double should be joined by a three in the opposite direction labelled minor wave X, which may be a complete zigzag. X waves within combinations are typically very deep; if minor wave X is over at the last high, then it would be a 0.79 length of minor wave W, which is fairly deep giving it a normal look. There is no minimum nor maximum requirement for X waves within combinations.
The second structure in the double would most likely be a flat correction labelled minor wave Y. It may also be a triangle, but in my experience this is very rare, so it will not be expected. The much more common flat for minor wave Y will be charted and expected.
A flat correction would subdivide 3-3-5. Minute wave a must be a three wave structure, most likely a zigzag. It may also be a double zigzag. On the hourly chart, this is now how this downwards movement fits best, and this will now be how it is labelled.
Minute wave b must now reach a minimum 0.90 length of minute wave a. Minute wave b must be a corrective structure. It may be any corrective structure.
The purpose of combinations is to take up time and move price sideways. To achieve this purpose the second structure in the double usually ends close to the same level as the first. Minor wave Y would be expected to end about the same level as minor wave W at 2,532.69. This would require a strong overshoot or breach of the 200 day moving average, which looks unlikely.
HOURLY CHART – COMBINATION
Click chart to enlarge.
The first two daily charts expect a double zigzag is over and a new corrective structure upwards has begun. The labelling is the same.
DAILY CHART – FLAT
Click chart to enlarge.
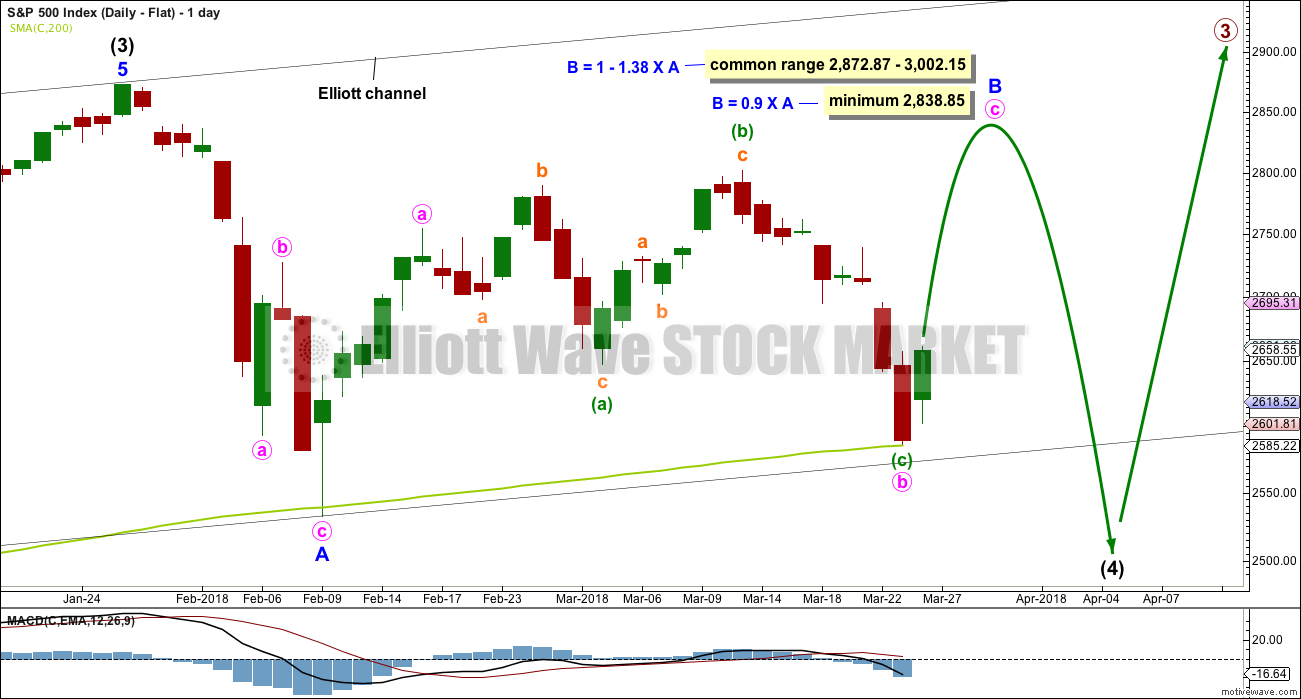
Flat corrections are very common. The most common type of flat is an expanded flat. This would see minor wave B move above the start of minor wave A at 2,872.87.
Within a flat correction, minor wave B must retrace a minimum 0.9 length of minor wave A at 2,838.85. The most common length for minor wave B within a flat correction would be 1 to 1.38 times the length of minor wave A at 2,872.87 to 3,002.15. An expanded flat would see minor wave B 1.05 times the length of minor wave A or longer, at 2,889.89 or above.
Minor wave B may be an incomplete zigzag, and within it minute wave c upwards must now subdivide as a five wave structure. How high minor wave B goes would indicate for this wave count what type of flat correction may be unfolding for intermediate wave (4).
When minor wave B is a complete corrective structure ending at or above the minimum requirement, then minor wave C downwards would be expected to make a new low below the end of minor wave A at 2,532.69 to avoid a truncation.
This wave count would require a very substantial breach of the 200 day moving average for the end of intermediate wave (4). This looks unlikely.
DAILY CHART – ALTERNATE
Click chart to enlarge.
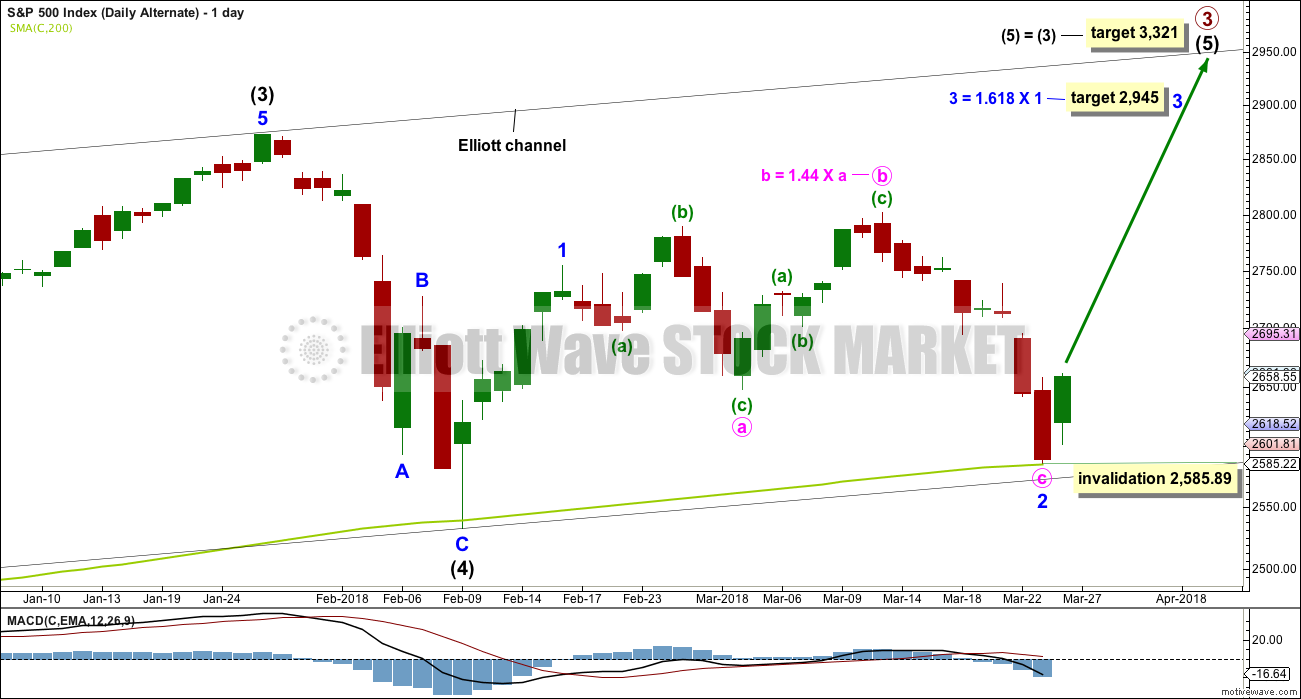
It is possible still that intermediate wave (4) was complete as a relatively brief and shallow single zigzag.
A new all time high with support from volume and any one of a bullish signal from On Balance Volume or the AD line would see this alternate wave count become the main wave count.
The target for minor wave 3 expects the most common Fibonacci ratio to minor wave 1.
Minor wave 2 may not move beyond the start of minor wave 1 below 2,532.69.
TECHNICAL ANALYSIS
WEEKLY CHART
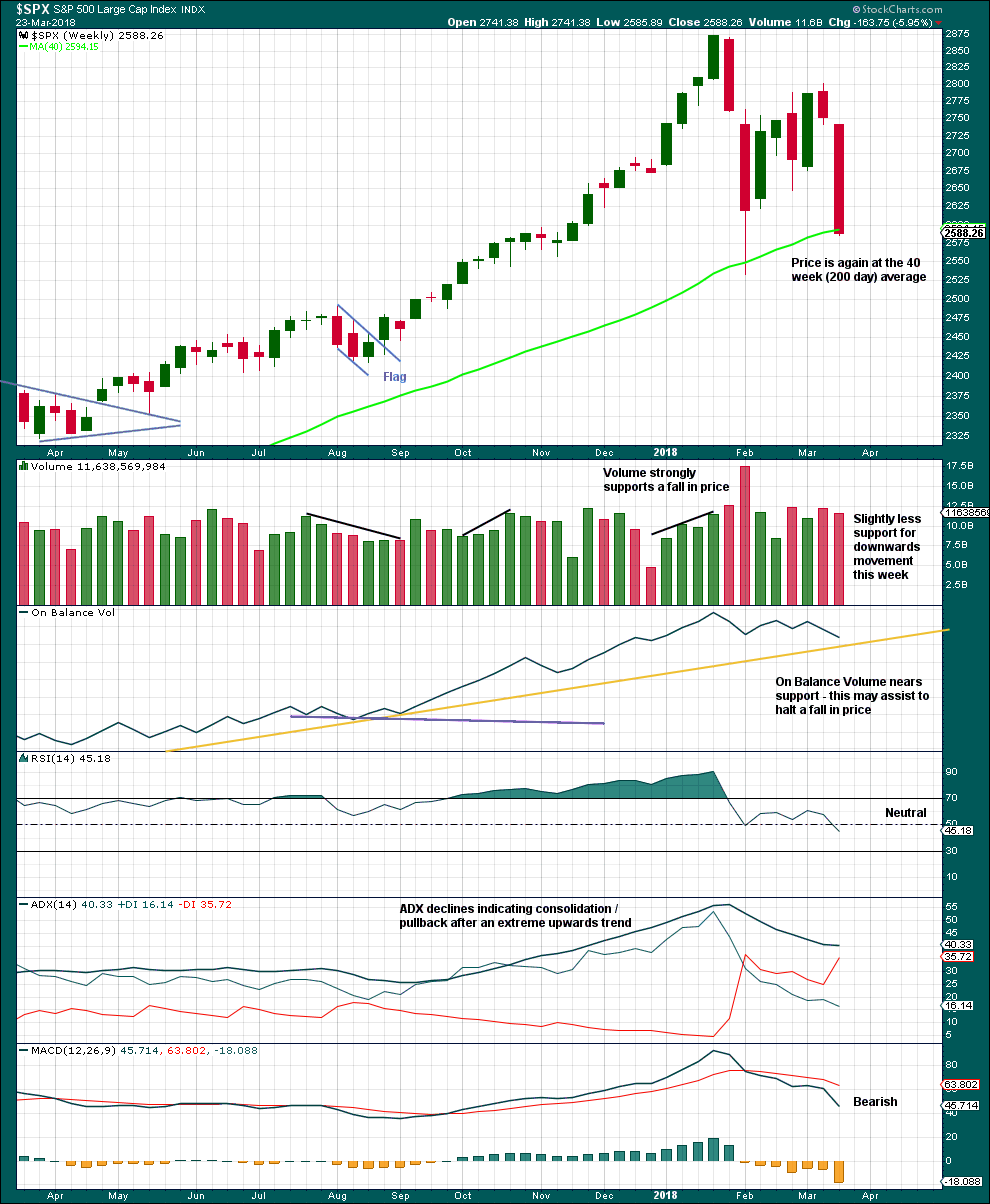
Click chart to enlarge. Chart courtesy of StockCharts.com.
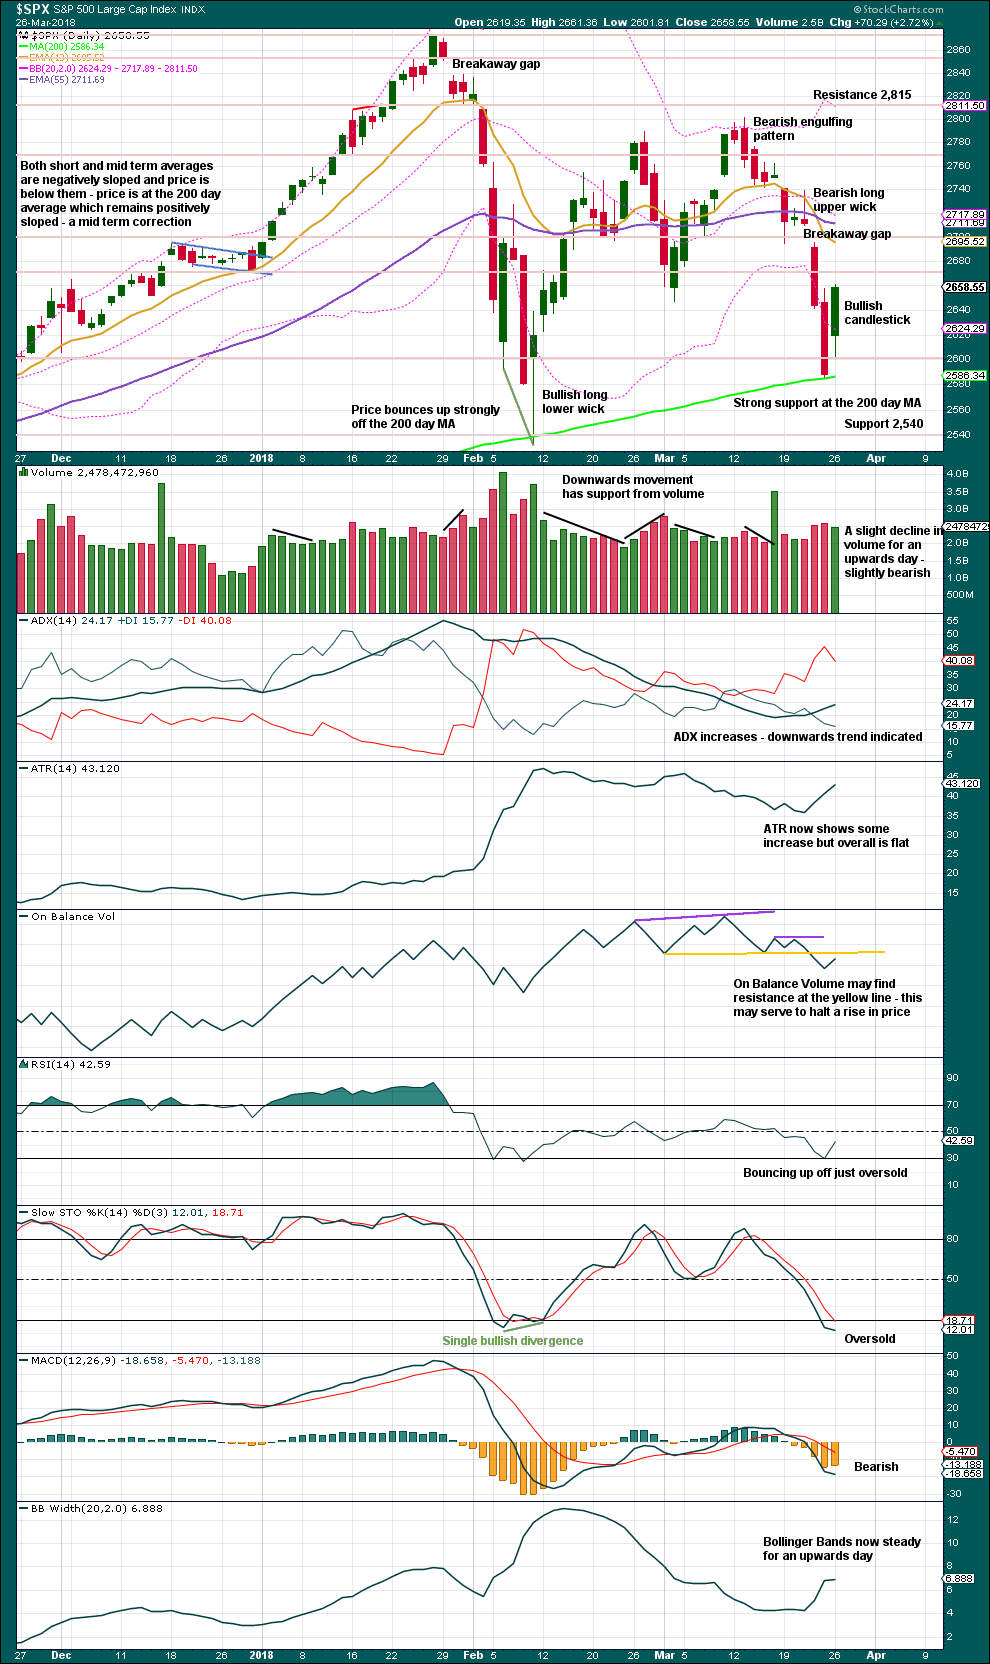
Although a slight decline in volume last week and On Balance Volume nearing support indicate downwards movement may end soon, the close very near to the low and the lack of a long lower wick indicate downwards movement is probably not yet done.
However, at the daily chart level, Monday’s strong upwards session suggests a low may be in place.
DAILY CHART
Click chart to enlarge. Chart courtesy of StockCharts.com.
Assume until proven otherwise that the last noted gap is a breakaway gap from a small consolidation, which may provide resistance while it remains open.
Monday’s strong upwards day is not correctly a Bullish Engulfing reversal pattern because the high gapped upwards and the real body does not engulf the lower portion of the prior real body. However, the strength of the Engulfing pattern is in the close. Here, bulls managed to push price up to close well above the open of Friday’s session. This close is very strong. The long lower wick today is also bullish.
Little concern should be given today to the slight decline in volume. Light and declining volume has been a feature of this market for many years yet price had continued to drift higher with it.
Price has found support at the 200 day moving average. Stochastics is now oversold. The bullish candlestick for Monday suggests an upwards bounce underway here.
VOLATILITY – INVERTED VIX CHART
Click chart to enlarge. Chart courtesy of StockCharts.com.
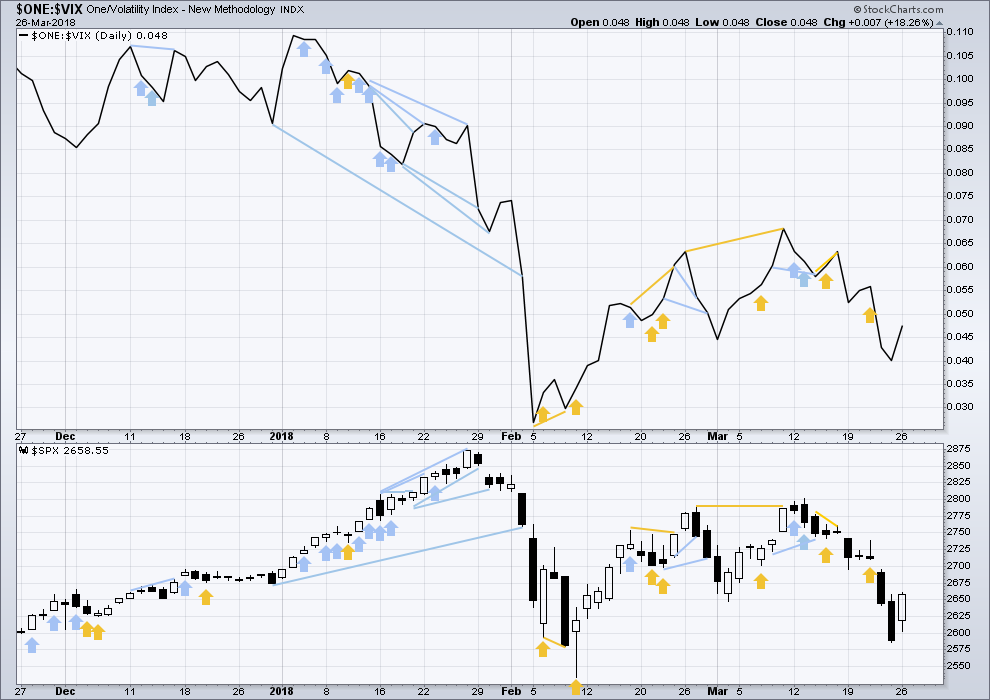
So that colour blind members are included, bearish signals will be noted with blue and bullish signals with yellow.
Normally, volatility should decline as price moves higher and increase as price moves lower. This means that normally inverted VIX should move in the same direction as price.
Upwards movement for Monday comes with a normal corresponding decline in market volatility. This is bullish. There is no divergence .
BREADTH – AD LINE
Click chart to enlarge. Chart courtesy of StockCharts.com.
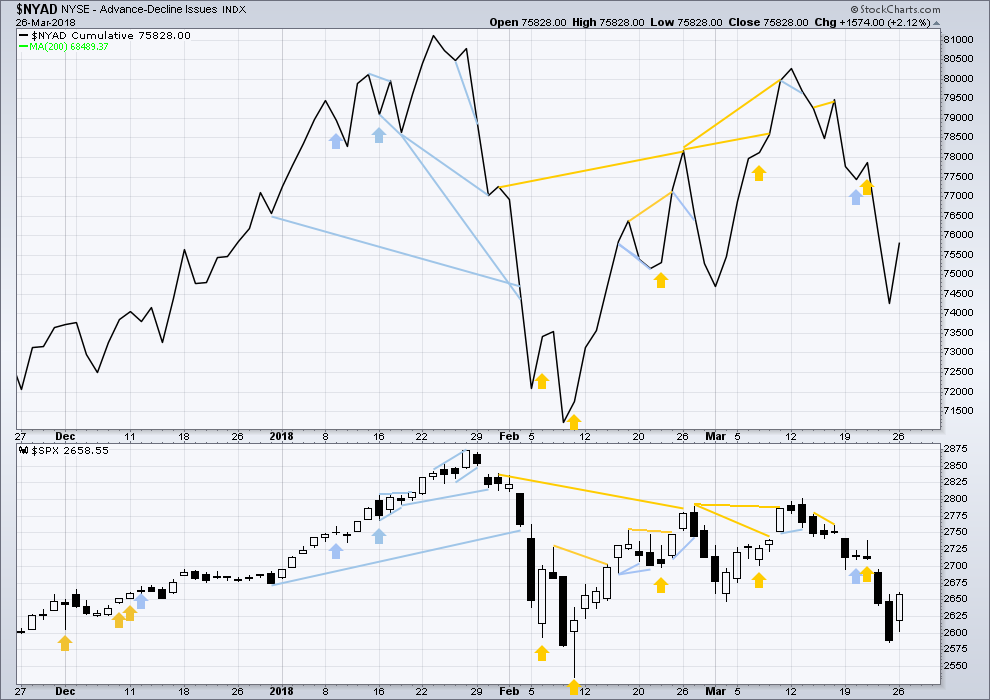
There is normally 4-6 months divergence between price and market breadth prior to a full fledged bear market. This has been so for all major bear markets within the last 90 odd years. With no longer term divergence yet at this point, any decline in price should be expected to be a pullback within an ongoing bull market and not necessarily the start of a bear market.
All of small, mid and large caps last week fell strongly. The fall in price has broad support from market breadth. It was small caps though that had the least decline. This slight divergence indicates some weakness and may be interpreted as slightly bullish.
Breadth should be read as a leading indicator.
Upwards movement for Monday has support from rising market breadth. This is bullish. There is no divergence.
DOW THEORY
All indices have made new all time highs as recently as nine weeks ago, confirming the ongoing bull market.
The following lows need to be exceeded for Dow Theory to confirm the end of the bull market and a change to a bear market:
DJIA: 17,883.56.
DJT: 7,039.41.
S&P500: 2,083.79.
Nasdaq: 5,034.41.
Charts showing each prior major swing low used for Dow Theory are here.
Published @ 09:57 p.m. EST.
I was wondering how many cubbies got ambushed yesterday lol!
It was impressive was it not?
When you don’t see conclusive signs of a reversal, that is usually a flag that it just might not be what it appears. Watch the 200 day. What happens there will determine the market’s fate for many months to come.
Picking up Christina for Spring Break today…Yipee!
We’re going for Chinese then Black Panther.
Hope everyone had great profits today. Wow!
On semi-log weekly, the trend line from the Jan 2016 low is being pressured.
I’m tracking that as well Kevin, methinks we will see 2417 real soon from here. Tech sell-off appears to really just be starting. The VIX has yet to signal an all clear, and likely will not be able to do that until it sees a 50 handle.
I am thinking at least 2450, possibly 2320.
I think the Feb dive has fundamentally changed this market.
Rodney you nailed it: it does the complicated and unexpected, but you forgot the third element: WITH AUTHORITY!
I think this is what is happening today.
Thank you Lara! This deep drop blew away all my tentative wave counts. I appreciate your steady hand of guidance!
You’re welcome Curtis
Did the break below 2601 today invalidate this count?
thanks!
on second thoughts it’s prob just a four. But why do 4’s always look so much larger than 2’s?
my these markets are frisky….
think we are looking at a possible breakdown here. Could be start of a three down.
My view on a 5 minute. This is the breakdown of the 3 wave that started yesterday 11:15 et. I think it’s in the 4…
Hi Kevin or Lara
Can Nick be right here that Wave 1 started at 2802 and ended at 2585
Wave 2 up ended at 2675
Wave 3 down started?
Is that idea possible and if so is that a low probability.
Please Advise
Thank You
It could have been. But now the downwards movement is too big for micro wave 4.
When I said this is a start of a Wave 3 down i was trying to say that maybe it terminates at 2485 – 2515
Wave 1— 2802 – 2585 (Down)
Wave 2— 2585 – 2675 (Up)
Wave 3— 2675 – 2485-2515 (Down)
Wave 4 — Up
Wave 5 — Down to a lower low
Any thoughts here on that idea?
Cant mention names but some big elliott theorist is throwing that concept out there.
Please advise
Thank You
Hi Lara
Is it possible that yesterdays action was A B C and today is finishing off that rally?
The only reason I’m asking you is because the SPX is still below the Hourly best fit channel line.
Thank you
The move up off the Friday low is looking strongly impulsive to me. Not an ABC up. It’s a 5 wave, in my view.
Hi Kevin
So if its a 5 wave move then it would suggest that we haven’t completed the move yet?
Thank You
That is correct. Still in wave 3 by my count. I suspect it’s in the 2 of the 3, to be a little more precise. If right…3 of 3 coming up next.
I think my chart above answers that question?
looks like dollar could have turned?
You means turned up? I don’t see significant evidence of that. I have just prior (day or two ago) sell signals on the daily chart. The weekly I have a Macd buy and a stochRSI sell, similarly on the hourly. I’m long FXE myself…
🙂