
The first target for downwards movement was 2,612, and thereafter the 200 day moving average at 2,584. Price ended very close to the 200 day moving average for the session at 2,588.
Summary: The target for downwards movement to end Monday or Tuesday is 2,565 – 2,566. Thereafter an upwards swing may develop.
Always practice good risk management. Always trade with stops and invest only 1-5% of equity on any one trade.
The biggest picture, Grand Super Cycle analysis, is here.
Last historic analysis with monthly charts is here. Video is here.
An alternate idea at the monthly chart level is given here at the end of this analysis.
An historic example of a cycle degree fifth wave is given at the end of the analysis here.
MAIN ELLIOTT WAVE COUNT
WEEKLY CHART
Click chart to enlarge.
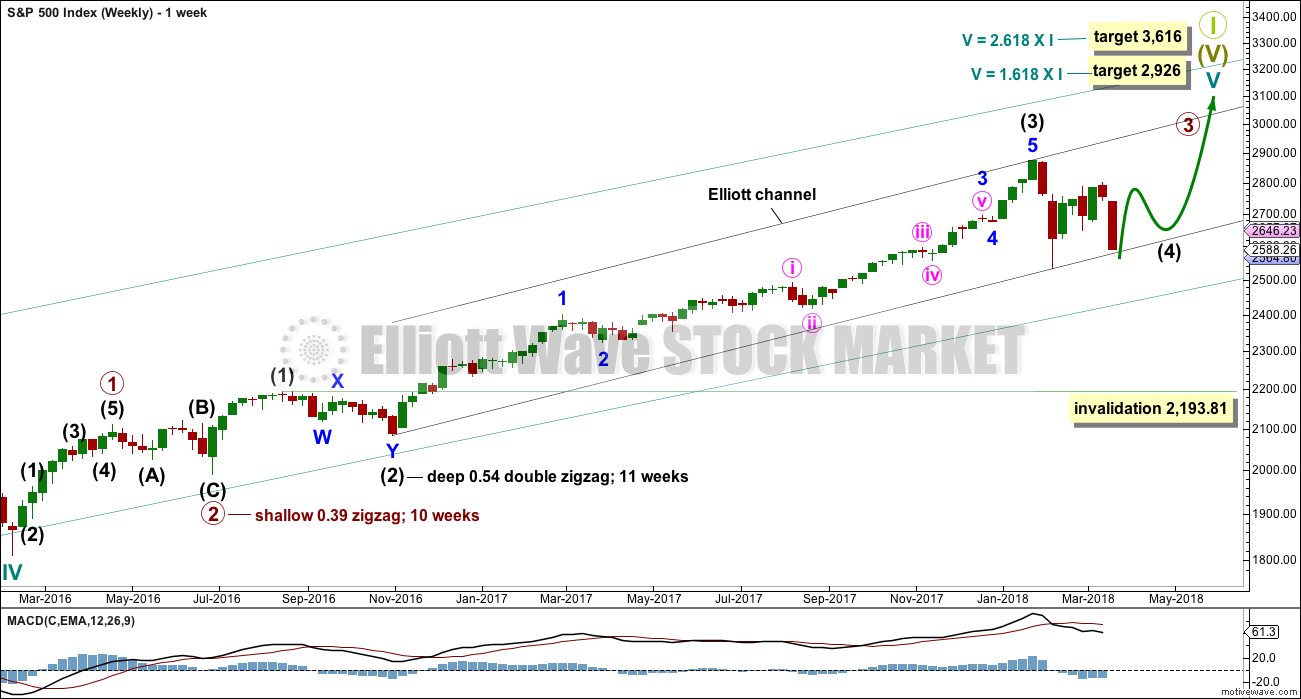
Cycle wave V must complete as a five structure, which should look clear at the weekly chart level. It may only be an impulse or ending diagonal. At this stage, it is clear it is an impulse.
Within cycle wave V, the third waves at all degrees may only subdivide as impulses.
Intermediate wave (4) has breached an Elliott channel drawn using Elliott’s first technique. The channel is redrawn using Elliott’s second technique as if intermediate wave (4) was over at the last low. If intermediate wave (4) continues sideways, then the channel may be redrawn when it is over. The upper edge may provide resistance for intermediate wave (5).
Intermediate wave (4) may not move into intermediate wave (1) price territory below 2,193.81. At this stage, it now looks like intermediate wave (4) may be continuing further sideways as a combination, triangle or flat. These three ideas are separated into separate daily charts. All three ideas would see intermediate wave (4) exhibit alternation in structure with the double zigzag of intermediate wave (2).
A double zigzag would also be possible for intermediate wave (4), but because intermediate wave (2) was a double zigzag this is the least likely structure for intermediate wave (4) to be. Alternation should be expected until price proves otherwise.
DAILY CHART – TRIANGLE
Click chart to enlarge.
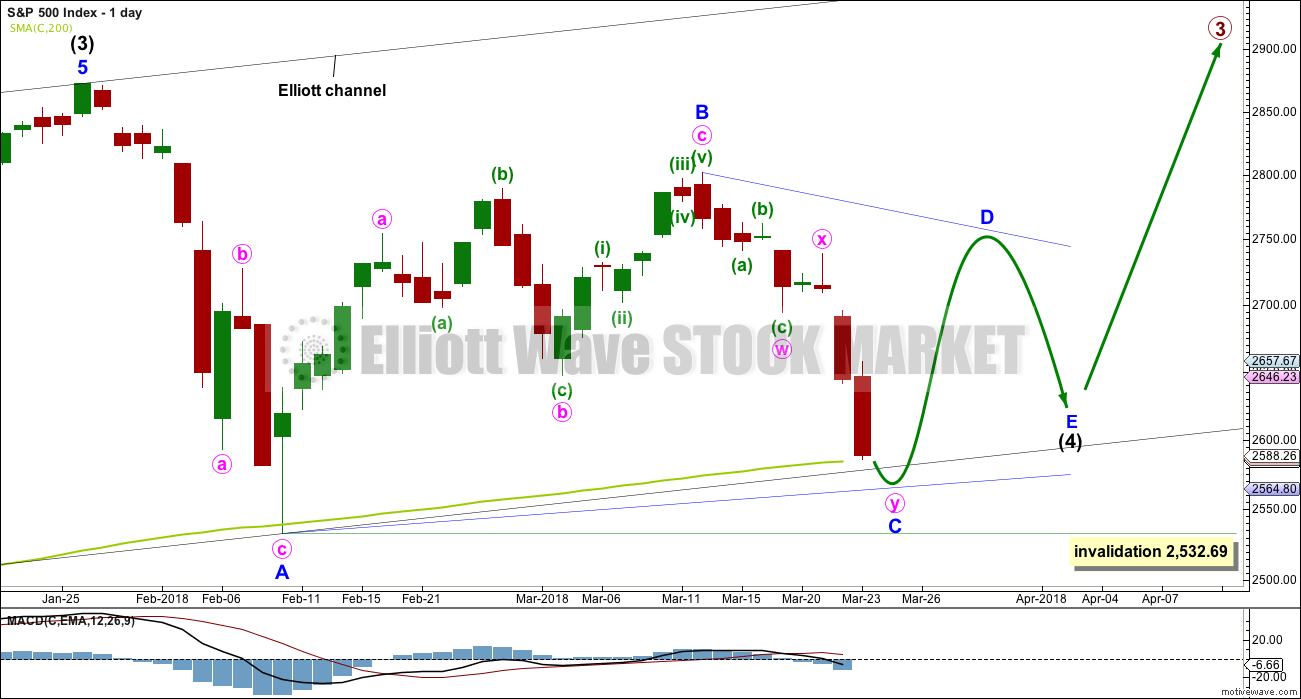
This first daily chart outlines how intermediate wave (4) may now continue further sideways as a contracting or barrier triangle. It is possible that minor wave B within the triangle was over at the last high, which would mean the triangle would be a regular triangle. Minor wave C downwards may now be underway and may be a single or double zigzag. One of the five sub-waves of a triangle is usually a more complicated multiple, and the most common sub-wave to do this is wave C. It looks like minor wave C may be unfolding as a double zigzag, at this stage, and this is how it will be labelled. Within the double zigzag, minute wave x should not make a new high above the start of minute wave w at 2,801.90.
Minor wave C may not make a new low below the end of minor wave A at 2,532.69.
The new target calculated today at the hourly chart level would see both the 200 day moving average and the lower black trend line overshot. This would be acceptable.
Intermediate wave 2 lasted 11 weeks. If intermediate wave (4) is incomplete, then it would have so far lasted only eight weeks. Triangles tend to be very time consuming structures, so intermediate wave (4) may total a Fibonacci 13 or even 21 weeks at its conclusion.
Because this is the only daily chart which expects price to continue to find support about the 200 day moving average, it is presented first; it may have a slightly higher probability than the next two daily charts.
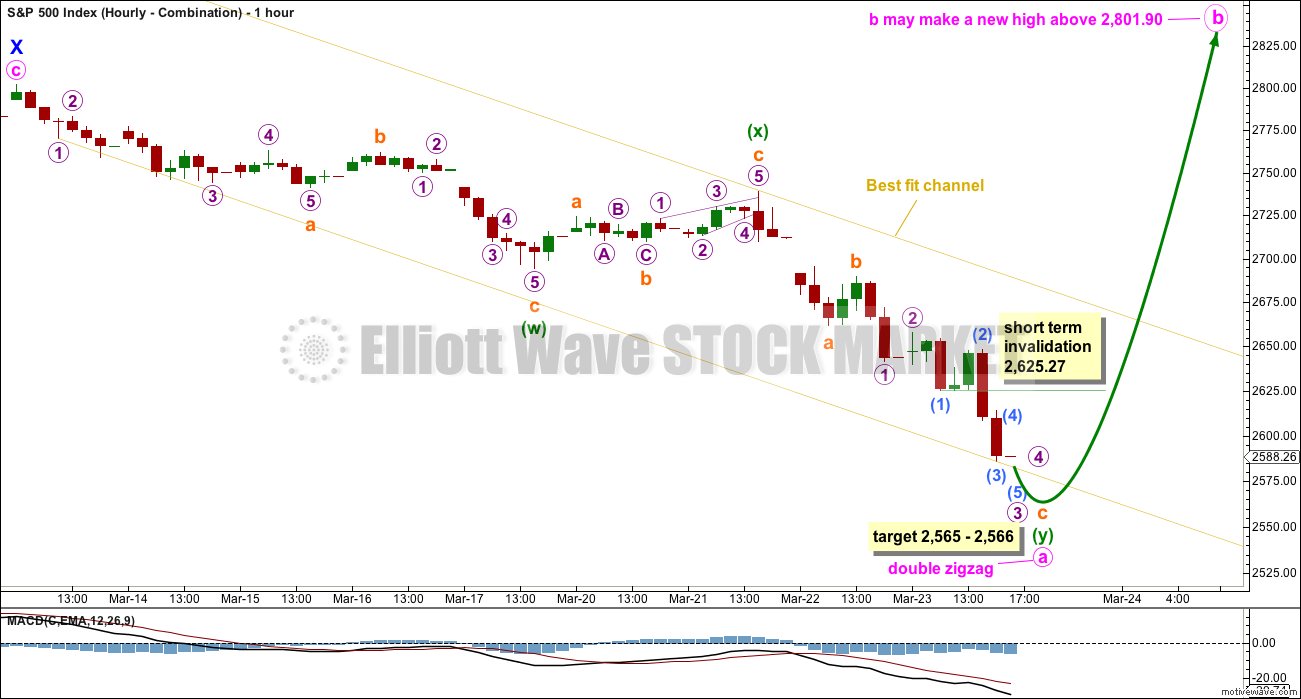
HOURLY CHART
Click chart to enlarge.
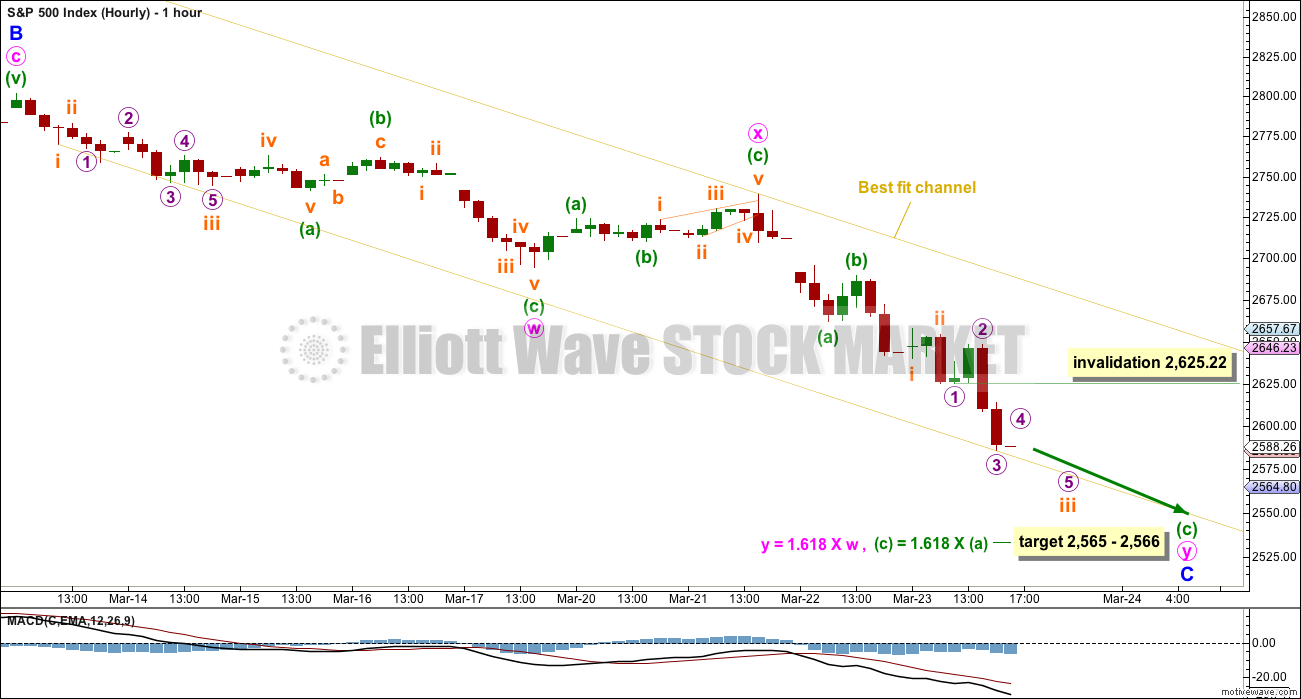
A double zigzag may be close to completion.
Within the second zigzag, minuette wave (c) has passed equality in length with minuette wave (a). The next Fibonacci ratio in the sequence is used to calculate a new target. This is just one point off a target calculated at minute degree.
Minuette wave (c) must subdivide as a five wave structure. So far the middle portion may be complete at Friday’s low, or very close to completion. There should be too more small intraday corrections along the way down to the target: the first for micro wave 4 and the next for subminuette wave iv.
Micro wave 4 may not move into micro wave 1 price territory above 2,625.22.
When subminuette wave iii is complete, then subminuette wave iv may not move into subminuette wave i price territory above 2,639.97.
The best fit channel is drawn with the first trend line from the low of subminuette wave i within minute wave w, then to the last low. A parallel copy is placed upon the high of minute wave x. Keep redrawing the channel as price moves lower (it is essentially an adjusted acceleration channel). When minor wave C is complete, a breach of the channel by upwards movement would indicate confidence in a low in place and a trend change.
For the very short term, a new high above 2,625.22 without any downwards movement first would indicate a low may be in place, and my analysis of this downwards wave would then be wrong.
DAILY CHART – COMBINATION
Click chart to enlarge.
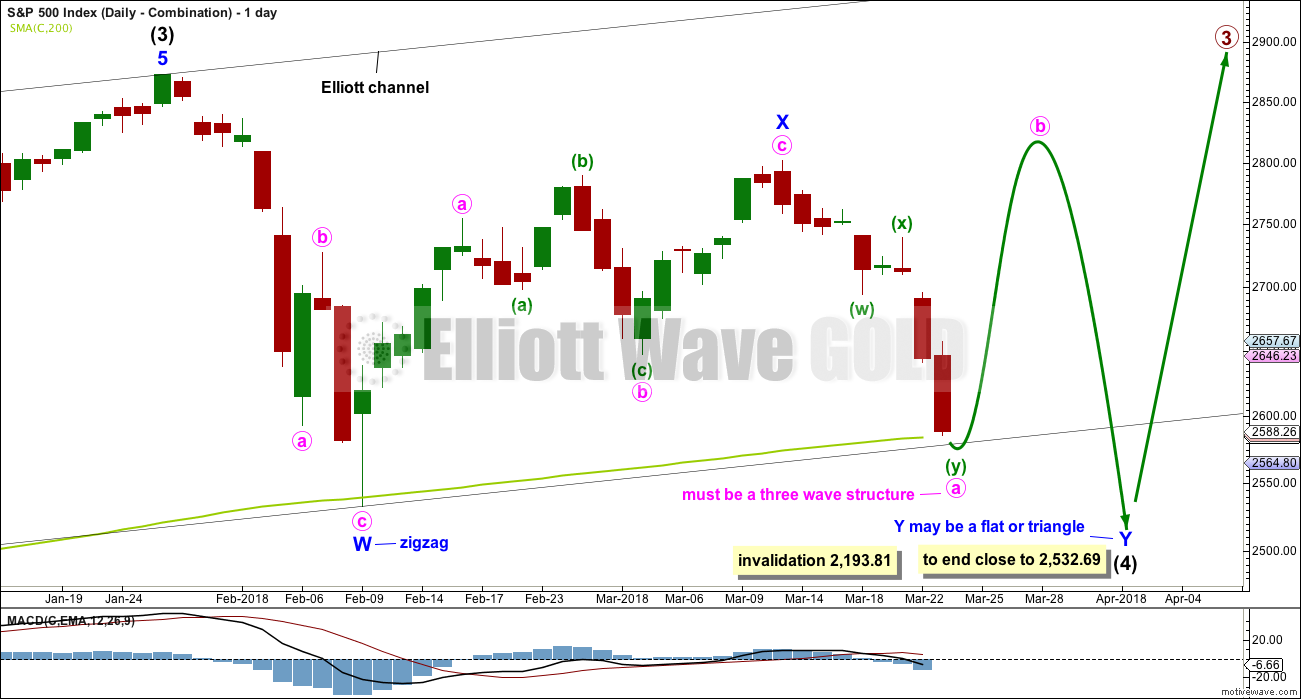
Double combinations are very common structures. The first structure in a possible double combination for intermediate wave (4) would be a complete zigzag labelled minor wave W. The double should be joined by a three in the opposite direction labelled minor wave X, which may be a complete zigzag. X waves within combinations are typically very deep; if minor wave X is over at the last high, then it would be a 0.79 length of minor wave W, which is fairly deep giving it a normal look. There is no minimum nor maximum requirement for X waves within combinations.
The second structure in the double would most likely be a flat correction labelled minor wave Y. It may also be a triangle, but in my experience this is very rare.
A flat correction would subdivide 3-3-5. Minute wave a must be a three wave structure, most likely a zigzag. It may also be a double zigzag. On the hourly chart, this is now how this downwards movement fits best, and this will now be how it is labelled.
The purpose of combinations is to take up time and move price sideways. To achieve this purpose the second structure in the double usually ends close to the same level as the first. Minor wave Y would be expected to end about the same level as minor wave W at 2,532.69. This would require a strong overshoot or breach of the 200 day moving average, which looks unlikely.
HOURLY CHART – COMBINATION
Click chart to enlarge.
The target, channel and subdivisions for this idea are exactly the same as the first hourly chart. Both daily charts expect a double zigzag is unfolding lower.
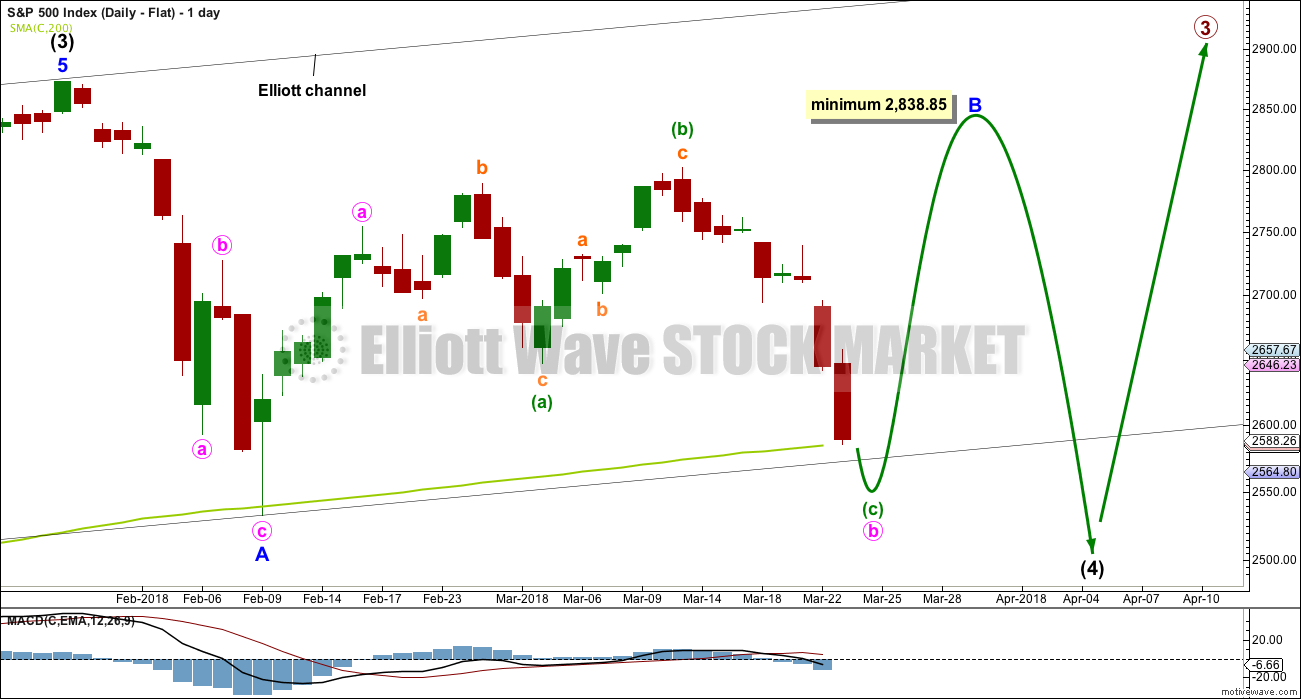
DAILY CHART – FLAT
Click chart to enlarge.
Flat corrections are very common. The most common type of flat is an expanded flat. This would see minor wave B move above the start of minor wave A at 2,872.87.
Within a flat correction, minor wave B must retrace a minimum 0.9 length of minor wave A at 2,838.85. The most common length for minor wave B within a flat correction would be 1 to 1.38 times the length of minor wave A at 2,872.87 to 3,002.15. An expanded flat would see minor wave B 1.05 times the length of minor wave A or longer, at 2,889.89 or above.
When minor wave B is a complete corrective structure ending at or above the minimum requirement, then minor wave C downwards would be expected to make a new low below the end of minor wave A at 2,532.69 to avoid a truncation.
Minor wave B may be continuing higher as a double zigzag. At this stage, this would be the most likely structure to achieve the height required for minor wave B.
This wave count remains valid. Minor wave B is again relabelled; it may be a time consuming sideways structure that at this time would be incomplete. If minor wave B is itself unfolding as an expanded flat, then within it minute wave b may make a new low below the start of minute wave a at 2,532.69.
This wave count would require a very substantial breach of the 200 day moving average for the end of intermediate wave (4). This looks unlikely.
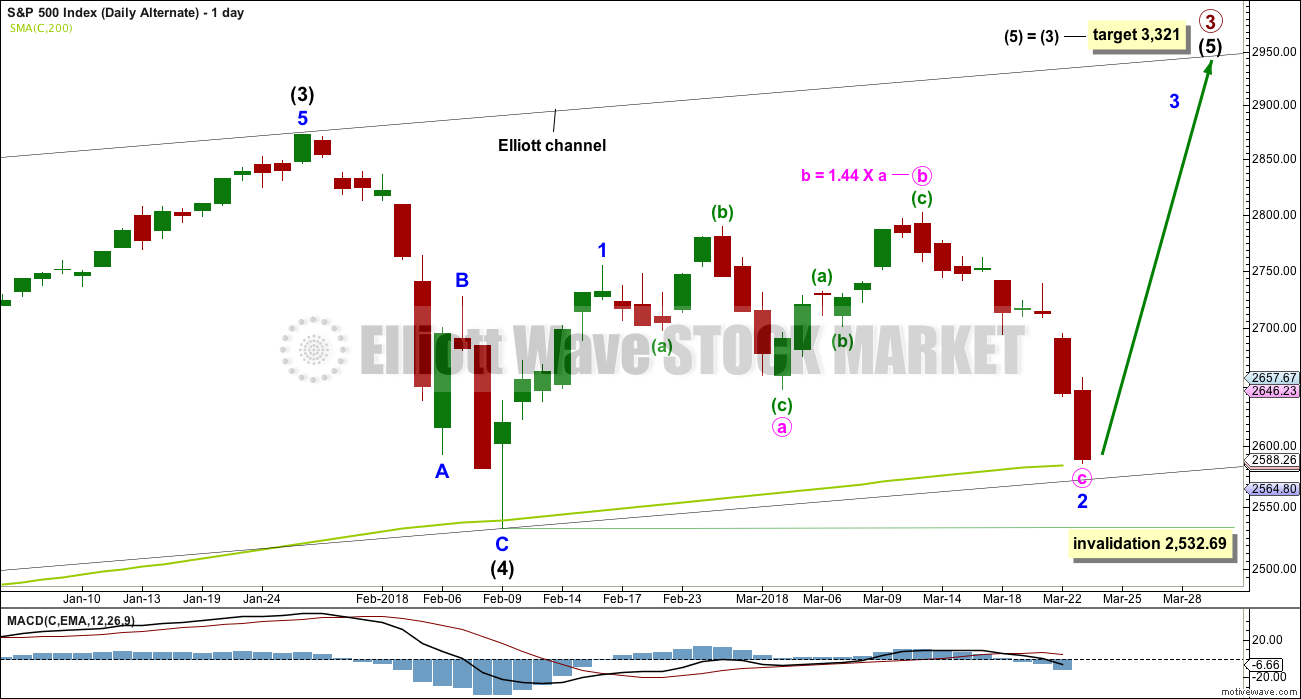
DAILY CHART – ALTERNATE
Click chart to enlarge.
It is possible still that intermediate wave (4) was complete as a relatively brief and shallow single zigzag.
A new all time high with support from volume and any one of a bullish signal from On Balance Volume or the AD line would see this alternate wave count become the main wave count.
Minor wave 2 may be over at Friday’s low, or it may be over early next week with a little more downwards movement. Minor wave 3 may begin upwards shortly.
Minor wave 2 may not move beyond the start of minor wave 1 below 2,532.69.
TECHNICAL ANALYSIS
WEEKLY CHART
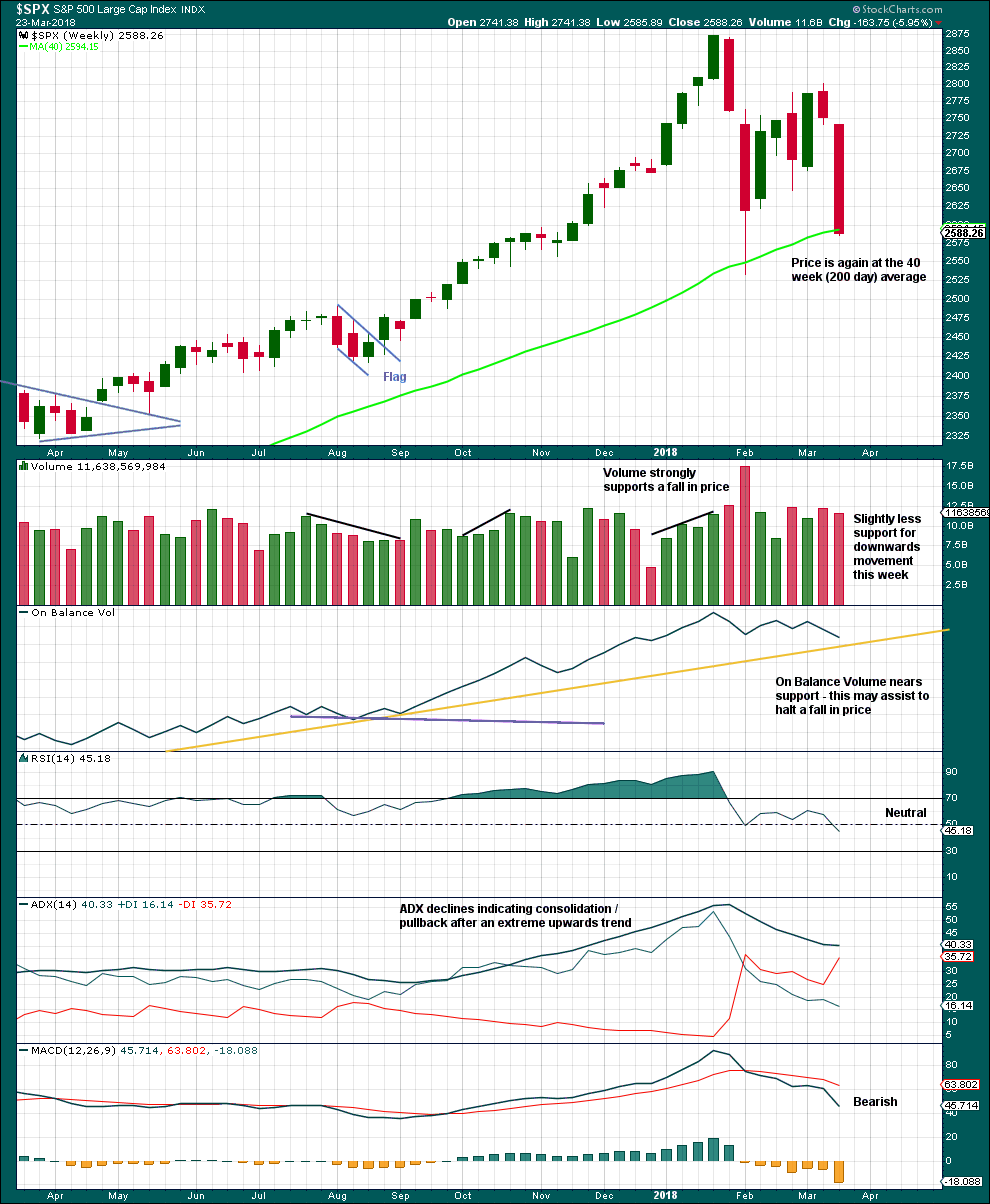
Click chart to enlarge. Chart courtesy of StockCharts.com.
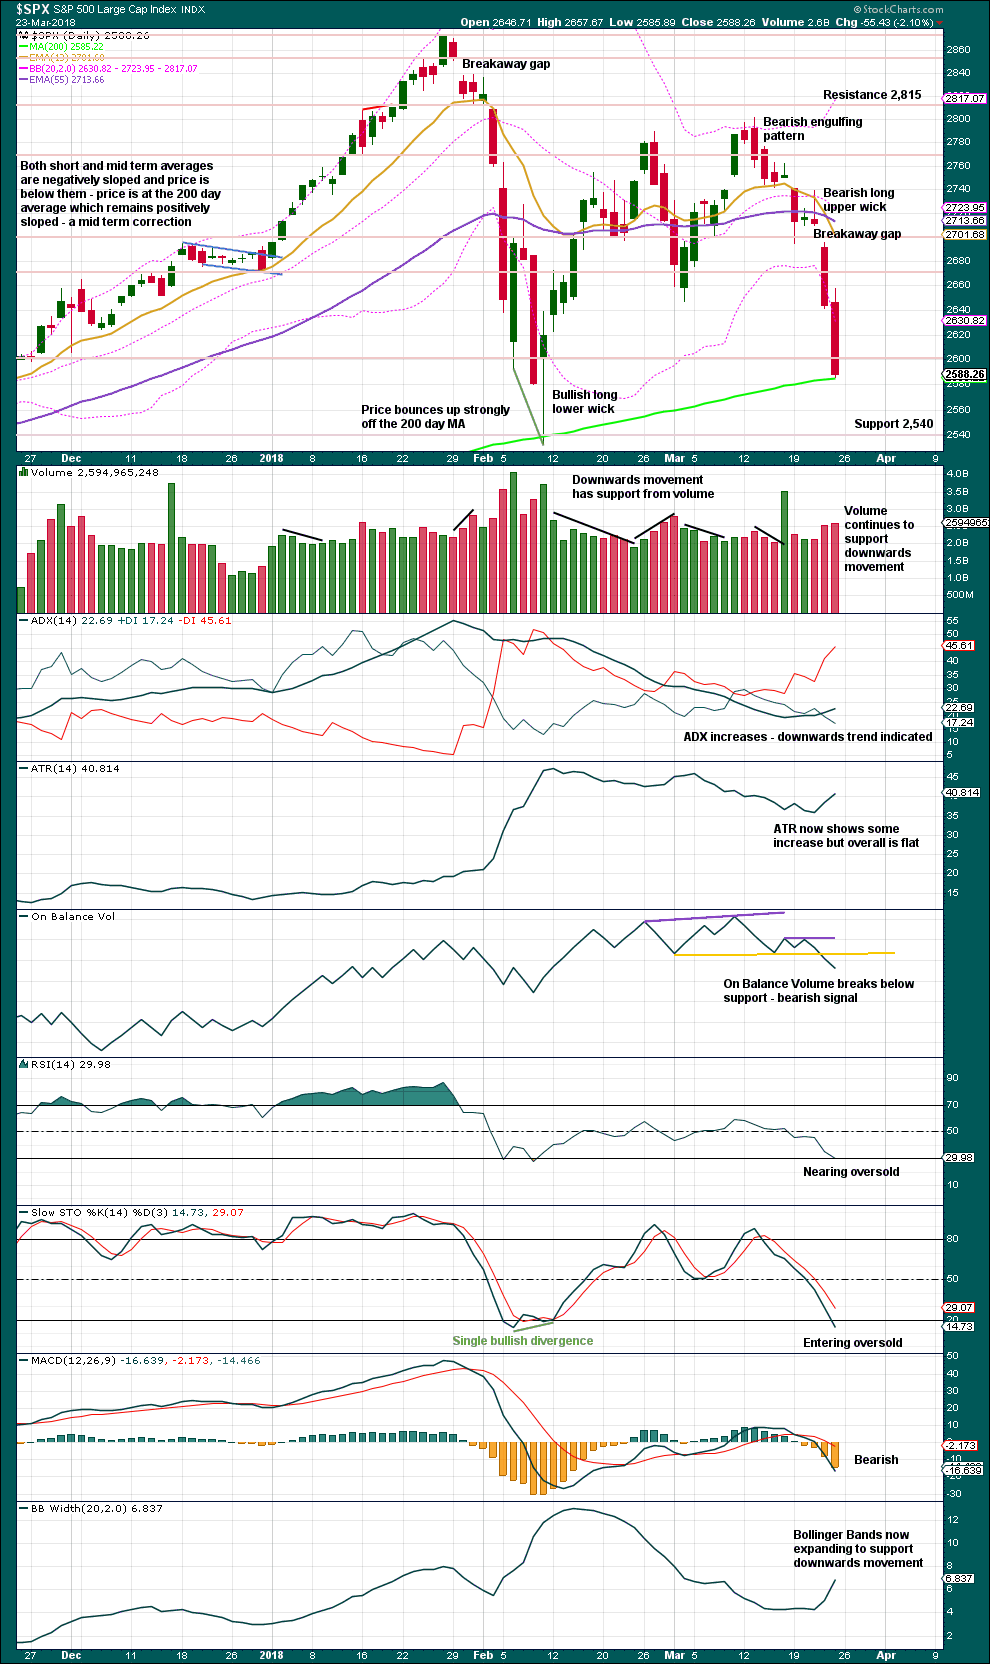
Although a slight decline in volume this week and On Balance Volume nearing support indicate downwards movement may end soon, the close very near to the low and the lack of a long lower wick indicate downwards movement is probably not yet done.
DAILY CHART
Click chart to enlarge. Chart courtesy of StockCharts.com.
Assume until proven otherwise that the gap at the open of Thurdsay’s session is a breakaway gap from a small consolidation, which may provide resistance while it remains open.
There is no long lower wick nor decline in volume to suggest downwards movement may end here. Expect it to continue lower. It looks like the 200 day moving average may again be overshot.
If a day with a long lower wick develops, or Stochastics or RSI is oversold and then exhibits divergence, a low may then be in place.
VOLATILITY – INVERTED VIX CHART
Click chart to enlarge. Chart courtesy of StockCharts.com.
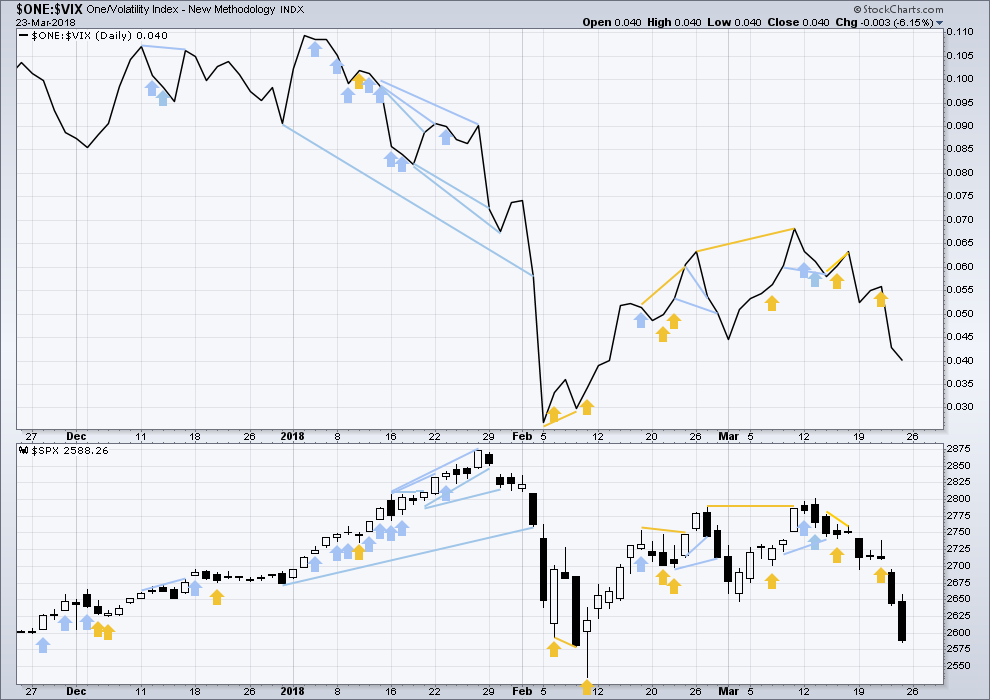
So that colour blind members are included, bearish signals will be noted with blue and bullish signals with yellow.
Normally, volatility should decline as price moves higher and increase as price moves lower. This means that normally inverted VIX should move in the same direction as price.
Downwards movement for Thursday and Friday has support from a normal increase in volatility. This is bearish.
BREADTH – AD LINE
Click chart to enlarge. Chart courtesy of StockCharts.com.
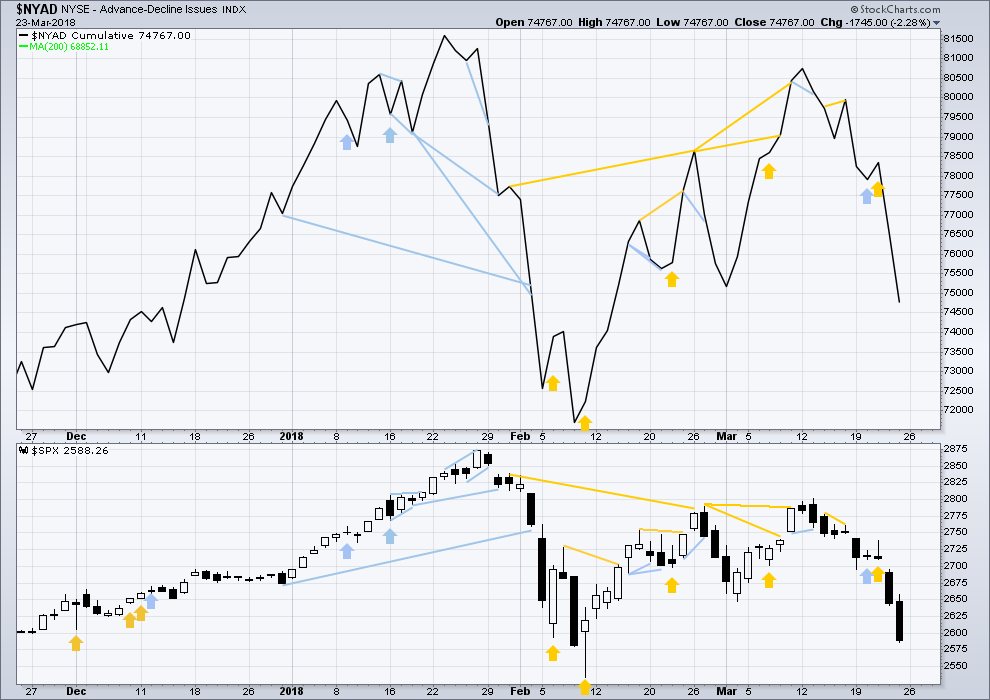
There is normally 4-6 months divergence between price and market breadth prior to a full fledged bear market. This has been so for all major bear markets within the last 90 odd years. With no longer term divergence yet at this point, any decline in price should be expected to be a pullback within an ongoing bull market and not necessarily the start of a bear market.
All of small, mid and large caps this week fell strongly. The fall in price has broad support from market breadth. It was small caps though that had the least decline. This slight divergence indicates some weakness and may be interpreted as slightly bullish.
Breadth should be read as a leading indicator.
Downwards movement for Thursday and Friday has support from strongly declining market breadth. This is bearish. There is no divergence.
DOW THEORY
All indices have made new all time highs as recently as nine weeks ago, confirming the ongoing bull market.
The following lows need to be exceeded for Dow Theory to confirm the end of the bull market and a change to a bear market:
DJIA: 17,883.56.
DJT: 7,039.41.
S&P500: 2,083.79.
Nasdaq: 5,034.41.
Charts showing each prior major swing low used for Dow Theory are here.
Published @ 10:05 p.m. EST on 24th March, 2018.
So do we have an impulse (not necessarily motive) 1-2 and 3 in progress today?
Or is it an ABC (up) correction?
I truly dunno. If there was some way TO know at this point, I’d love to hear what that would be. Otherwise, it’s wait to see if the “4” if it’s impulsive breaks below 2639 and invalidates such a count…
Kevin,
if this is a triangle it should be a 3-wave a, b, c up I believe, but each of those waves will divide into 5,3,5.
What Nick said.
I’ll also cheekily second your wish that there be some way to know early on if a move is a three or a five.
If there were such an insight that would make my job so much easier.
Hi Lara
What would it be as far as price targets goes if it was a 3 vs a 5
Thank You
Hi Eric. A valid question, and I had to pretty much complete my analysis (at least, thinking and charts) to answer it.
If it’s a 3 then there are two possibilities:
– within a triangle the target range is 2,759 – 2,769.
– within a combination the target is minimum 2,780.30 and a range from 2,801.90 – 2,980.09.
If it’s a five up then it may be a third wave, target 2,945.
I think my analysis was wrong, and downwards movement is done for now.
That was a very difficult one to pick. No reversal signal, no bullish divergence, no long lower wick; in short nothing that most often indicates a low in place.
Only support at the 200 day MA.
Now on upwards for minor D if this is a triangle.
This is when the ideas of a triangle, combination or flat now diverge strongly. A triangle needs to see price not move much if at all above 2,801.90. The other two possibilities see reasonable new highs above 2,801.90 as very likely
Thanks Lara. We let price and the charts do the talking so to speak. It is nice to begin to see some differentiation possibilities. Have a great day and thanks for the excellent analysis.
You’re welcome Rodney.
It’s a very beautiful balmy day here. I am ensconced in balm.
The combo hourly and triangle hourly are both invalidated. “4” has penetrated into the price realm of 1. However, I do have a 5 wave count down (shown earlier) that is not yet invalidated; price needs to exceed 2662 to invalidate it. On the NDX, same count…it’s pushing right up to and very very slightly through the invalidation point. We’ll see…
Hi Kevin
Would the 2662 or higher breach Lara best fit channel line that she just posted?
Thank You
can this be an ending diagonal ? olga mentioned something?
if you are referring to the move down started on the high of march 21…I don’t think so. There isn’t sufficient overlap of the successive waves down, that I can make out.
Nice jump on the SPX. This could be the beginning of Minor D of Intermediate 4 triangle. Lara’s rough drawing indicates we are moving up toward 2750 and below 2800 for sure. Then minor E takes us back down toward 2600. If this pans out, I will be looking for a long position entry at that point. Maybe this will complete in the next two weeks.
I’m not yet convinced the y down is complete Rodney. I suspect this is some kind of a iv up. Anything over 2661 and I’m probably wrong.
Also note price hasn’t come too close yet to Lara’s target down at 2566. A 4 up 5 down should get price in that zone, or below.
You are certainly correct. We may see yet another low below 2585 before Minor D begins, (if this is a triangle). I suspect a triangle because it is one of the slowest developing, longest, and complicated patterns for a 4th wave. It can whipsaw traders.
My mantra for EW corrective patterns is that if it can become more complicated and extend in time, it will. Kind of like Murphy’s Law.
well it did negate the main hourly chart after taking out the 2626? what are your thoughts on that? thanks
my view is that there are several ways to count this overall downward movement starting mid-last week, and while the move above 2626 might have invalidated the specific count on the hourly main, I think there are other reasonable ways to count it that enables a viable 4 here. Could be wrong; we could be seeing a 1-2 launch of new impulsive action up. But I’m a bit more focused still on an ABC up, with the B in progress now. We’ll see!
Here’s a view that supports a current 4 wave up…
a=c target 2555 ish?
reasonable. I’m waiting for C to extend beyond A at the moment…it’s possible the initial push up was it for that 4. Can’t get locked into one and only one view is my view!
So what’s up doc?
No bear count?
I’m not saying this won’t turn into a triangle but to me if this is still Intermediate 4 it looks disproportionately large to the eye compared to Inter 2 on the weekly.
I cannot believe it. Two weeks in a row number one on the weekend edition. Have a great weekend Lara et al.
Face it Doc. You’re Top Hare!