
More upwards movement was expected. This is how the session began, with a new high in the first hour, but thereafter there was a steady fall in price.
A new hourly wave count is published today.
Summary: Expect downwards movement now for at least a few days. It could be choppy, overlapping and weak. Or it could be a strong downwards wave. Have some confidence in this view if price makes a new low now below 2,732.
This view has support today from a Bearish Engulfing reversal pattern, which has support from volume, and a bearish signal from both the AD line and inverted VIX.
A new high above 2,801.90 would see an expectation of more upwards movement to either 2,845 or 2,869.
Always practice good risk management. Always trade with stops and invest only 1-5% of equity on any one trade.
The biggest picture, Grand Super Cycle analysis, is here.
Last historic analysis with monthly charts is here. Video is here.
An alternate idea at the monthly chart level is given here at the end of this analysis.
An historic example of a cycle degree fifth wave is given at the end of the analysis here.
MAIN ELLIOTT WAVE COUNT
WEEKLY CHART
Click chart to enlarge.
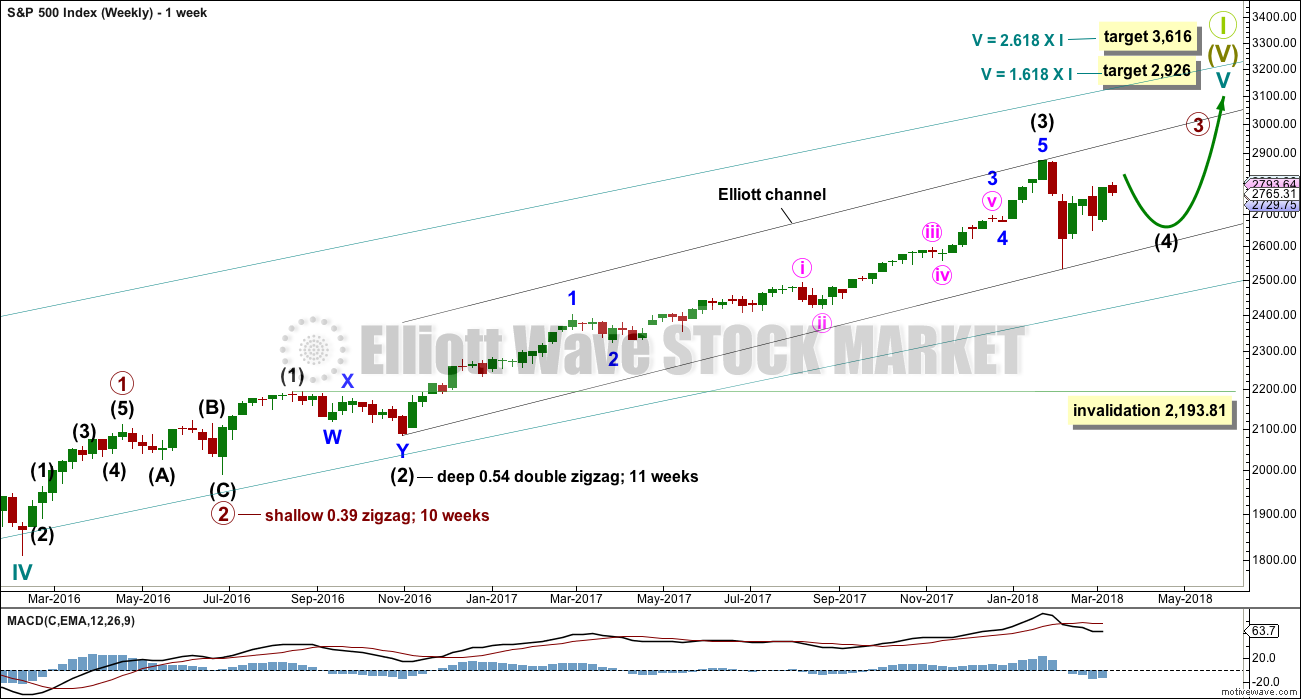
Cycle wave V must complete as a five structure, which should look clear at the weekly chart level. It may only be an impulse or ending diagonal. At this stage, it is clear it is an impulse.
Within cycle wave V, the third waves at all degrees may only subdivide as impulses.
Intermediate wave (4) has breached an Elliott channel drawn using Elliott’s first technique. The channel is redrawn using Elliott’s second technique as if intermediate wave (4) was over at the last low. If intermediate wave (4) continues sideways, then the channel may be redrawn when it is over. The upper edge may provide resistance for intermediate wave (5).
Intermediate wave (4) may not move into intermediate wave (1) price territory below 2,193.81. At this stage, it now looks like intermediate wave (4) may be continuing further sideways as a combination, triangle or flat. These three ideas are separated into separate daily charts. All three ideas would see intermediate wave (4) exhibit alternation in structure with the double zigzag of intermediate wave (2).
A double zigzag would also be possible for intermediate wave (4), but because intermediate wave (2) was a double zigzag this is the least likely structure for intermediate wave (4) to be. Alternation should be expected until price proves otherwise.
DAILY CHART – TRIANGLE
Click chart to enlarge.
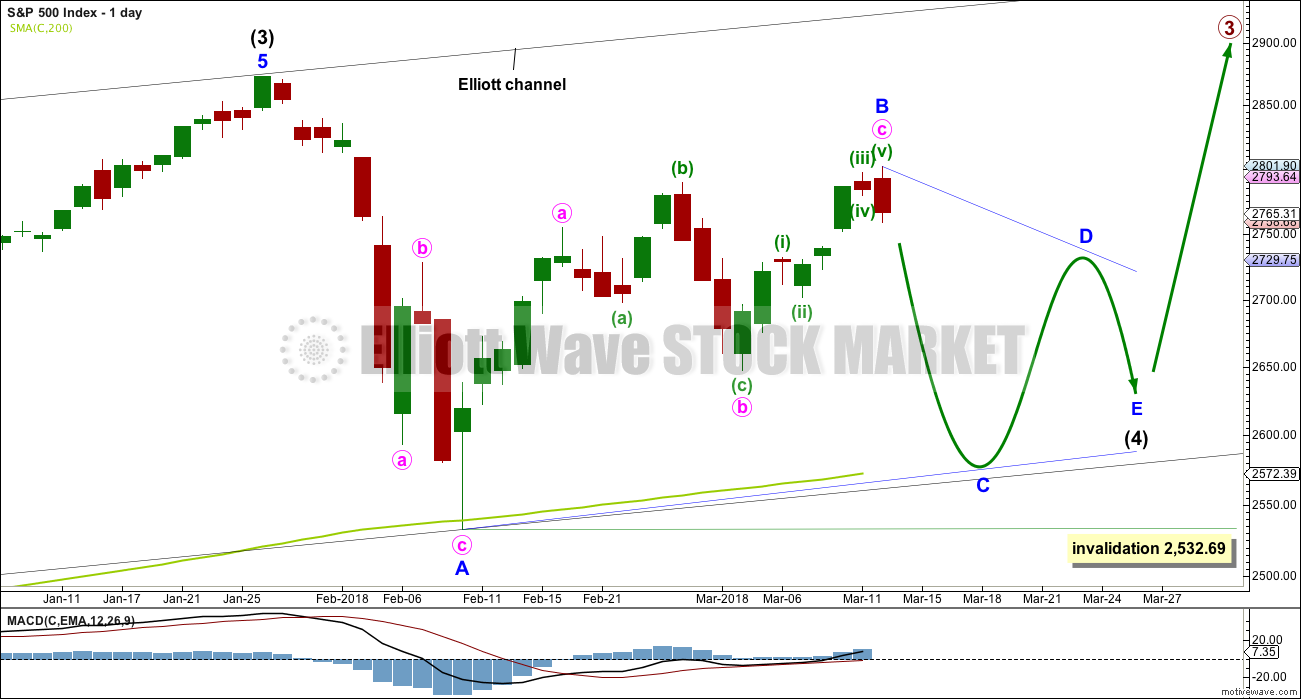
This first daily chart outlines how intermediate wave (4) may now continue further sideways as a contracting or barrier triangle. It is possible that minor wave B within the triangle was over at today’s high, which would mean the triangle would be a regular triangle. Minor wave C downwards may now begin and may be a single or double zigzag.
Minor wave C may not make a new low below the end of minor wave A at 2,532.69.
Intermediate wave 2 lasted 11 weeks. If intermediate wave (4) is incomplete, then it would have so far lasted only six weeks. Triangles tend to be very time consuming structures, so intermediate wave (4) may total a Fibonacci 13 or even 21 weeks at its conclusion.
Because this is the only daily chart which expects price to continue to find support at the 200 day moving average, it is presented first; it may have a slightly higher probability than the next two daily charts.
DAILY CHART – COMBINATION
Click chart to enlarge.
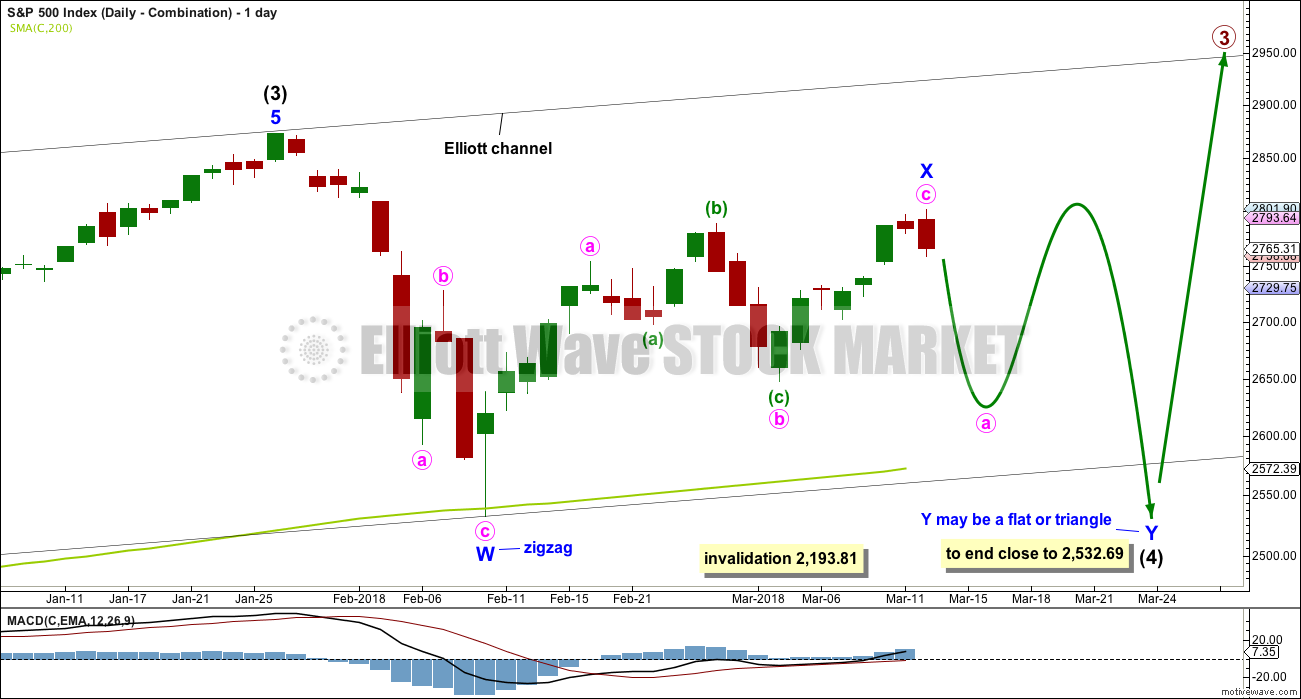
Double combinations are very common structures. The first structure in a possible double combination for intermediate wave (4) would be a complete zigzag labelled minor wave W. The double should be joined by a three in the opposite direction labelled minor wave X, which may today be a complete zigzag. X waves within combinations are typically very deep; if minor wave X is over at today’s high, then it would be a 0.79 length of minor wave W, which is fairly deep giving it a normal look. There is no minimum nor maximum requirement for X waves within combinations.
The second structure in the double would most likely be a flat correction labelled minor wave Y. It may also be a triangle, but in my experience this is very rare.
A flat correction would subdivide 3-3-5. Minute wave a must be a three wave structure, most likely a zigzag.
The purpose of combinations is to take up time and move price sideways. To achieve this purpose the second structure in the double usually ends close to the same level as the first. Minor wave Y would be expected to end about the same level as minor wave W at 2,532.69. This would require a strong overshoot or breach of the 200 day moving average.
HOURLY CHART
Click chart to enlarge.
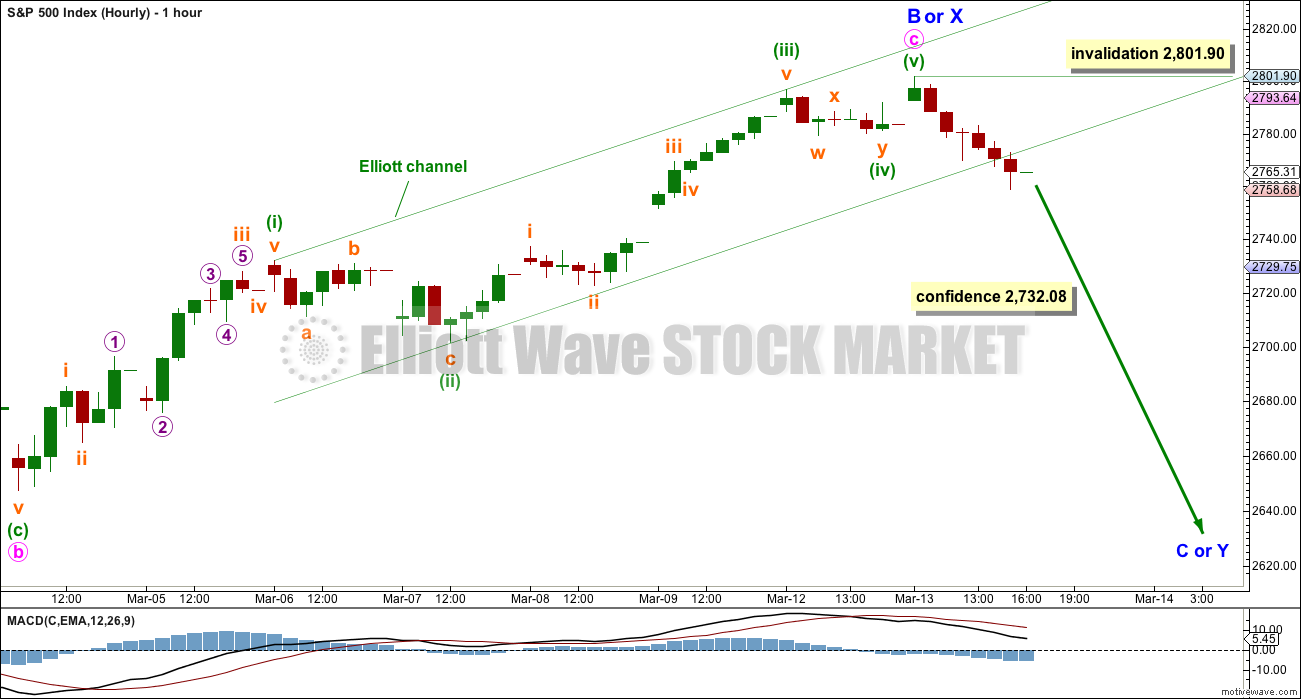
An impulse upwards for minute wave c may today be complete. The middle portion of minuette wave (iii) does not have a very good look as a five, but it is possible it could be over. The S&P just does not always have fives that look like fives.
At the end of the session, a channel drawn about minute wave c using Elliott’s technique is breached. This may be an indication that minute wave c is over.
If minor wave B or X is complete for a triangle or combination, then minor wave C or Y downwards should have begun.
Minor wave C may be a single or double zigzag for a triangle. Minor wave Y may be a flat or triangle for a combination. The first piece of downwards movement within a wave at minor degree should be a five on the hourly chart. Within that first five down, no second wave correction may move beyond its start above 2,801.90.
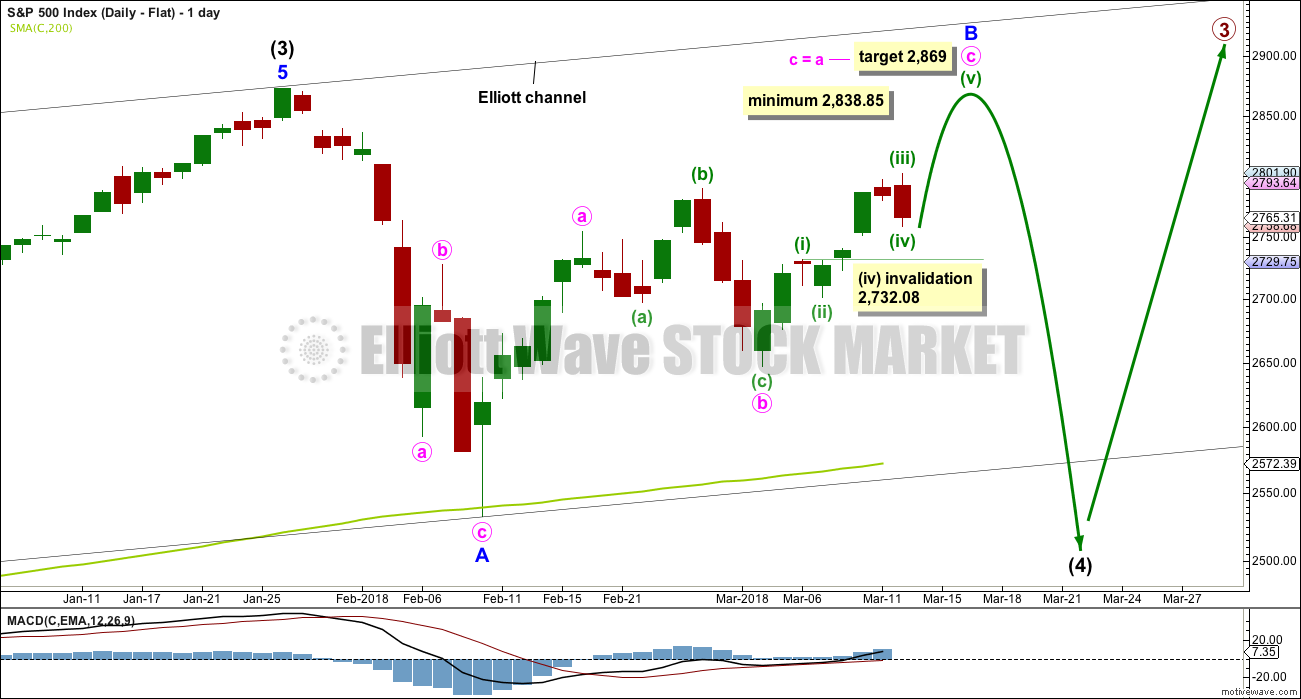
DAILY CHART – FLAT
Click chart to enlarge.
Flat corrections are very common. The most common type of flat is an expanded flat. This would see minor wave B move above the start of minor wave A at 2,872.87.
Within a flat correction, minor wave B must retrace a minimum 0.9 length of minor wave A at 2,838.85. The most common length for minor wave B within a flat correction would be 1 to 1.38 times the length of minor wave A at 2,872.87 to 3,002.15. An expanded flat would see minor wave B 1.05 times the length of minor wave A or longer, at 2,889.89 or above.
When minor wave B is a complete corrective structure ending at or above the minimum requirement, then minor wave C downwards would be expected to make a new low below the end of minor wave A at 2,532.69 to avoid a truncation.
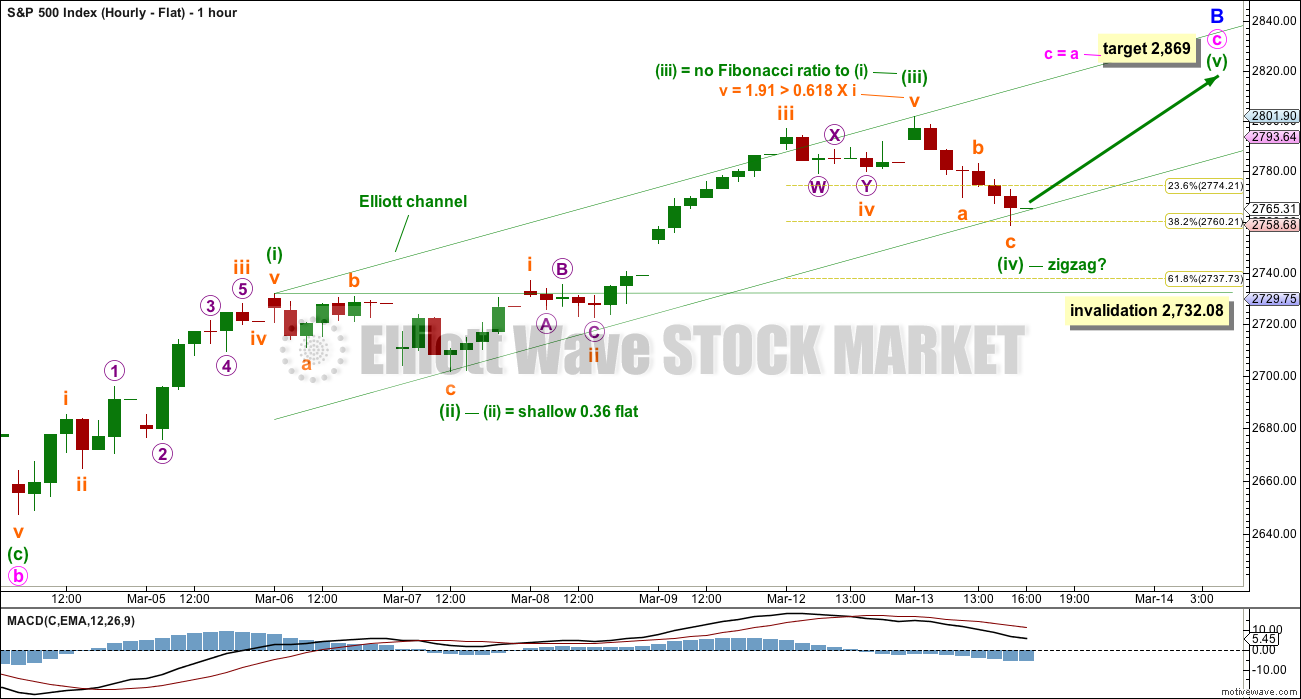
HOURLY CHART – FLAT
Click chart to enlarge.
It is also possible that upwards movement is not over and minute wave c is incomplete. This has a better look at the hourly chart level, but it does not have support today from classic technical analysis.
If intermediate wave (4) is unfolding as a flat correction, then within it minor wave B has not yet met the minimum requirement of 0.9 the length of minor wave A at 2,838.85.
Within minute wave c, the correction of minuette wave (iv) may not move into minuette wave (i) price territory below 2,732.08.
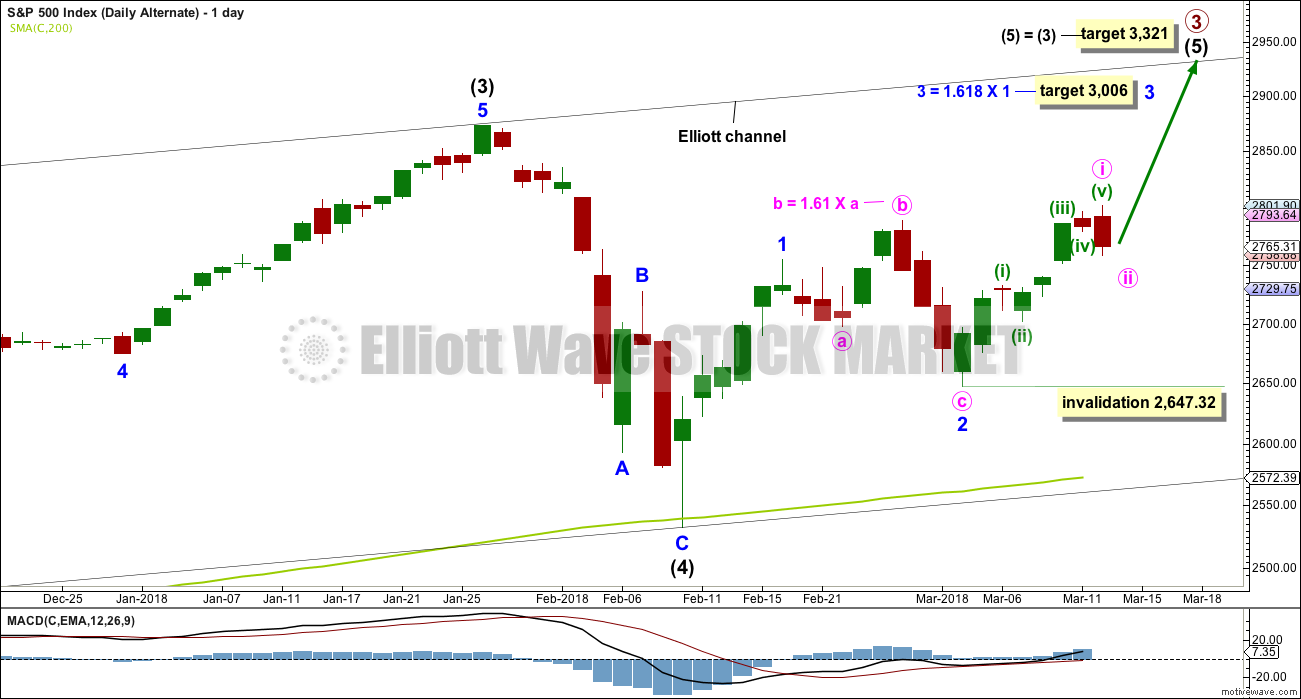
DAILY CHART – ALTERNATE
Click chart to enlarge.
It is possible still that intermediate wave (4) was complete as a relatively brief and shallow single zigzag.
A new all time high with support from volume and any one of a bullish signal from On Balance Volume or the AD line would see this alternate wave count become the main wave count.
Within minor wave 3, minute wave ii may not move beyond the start of minute wave i below 2,647.32.
TECHNICAL ANALYSIS
WEEKLY CHART
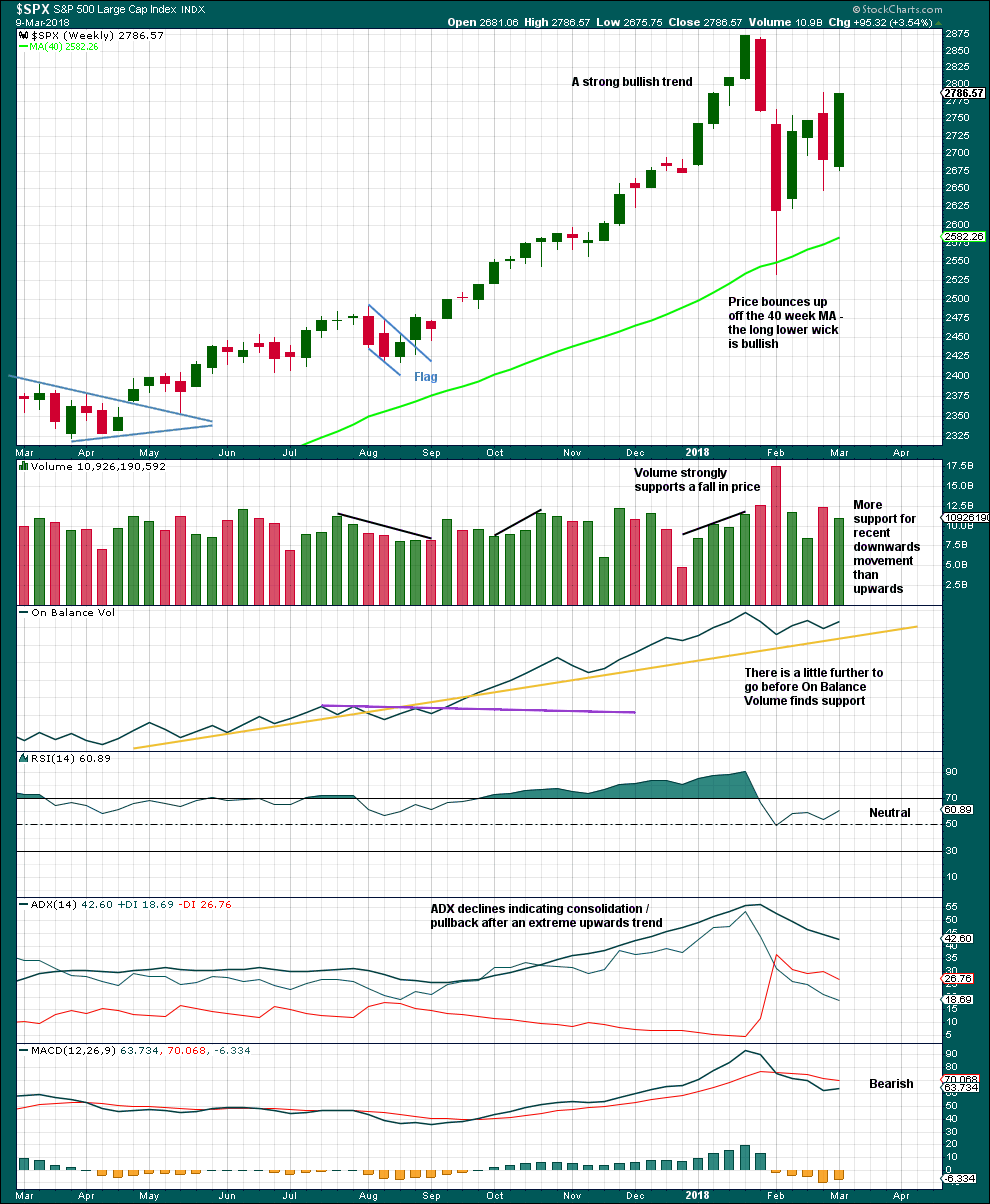
Click chart to enlarge. Chart courtesy of StockCharts.com.
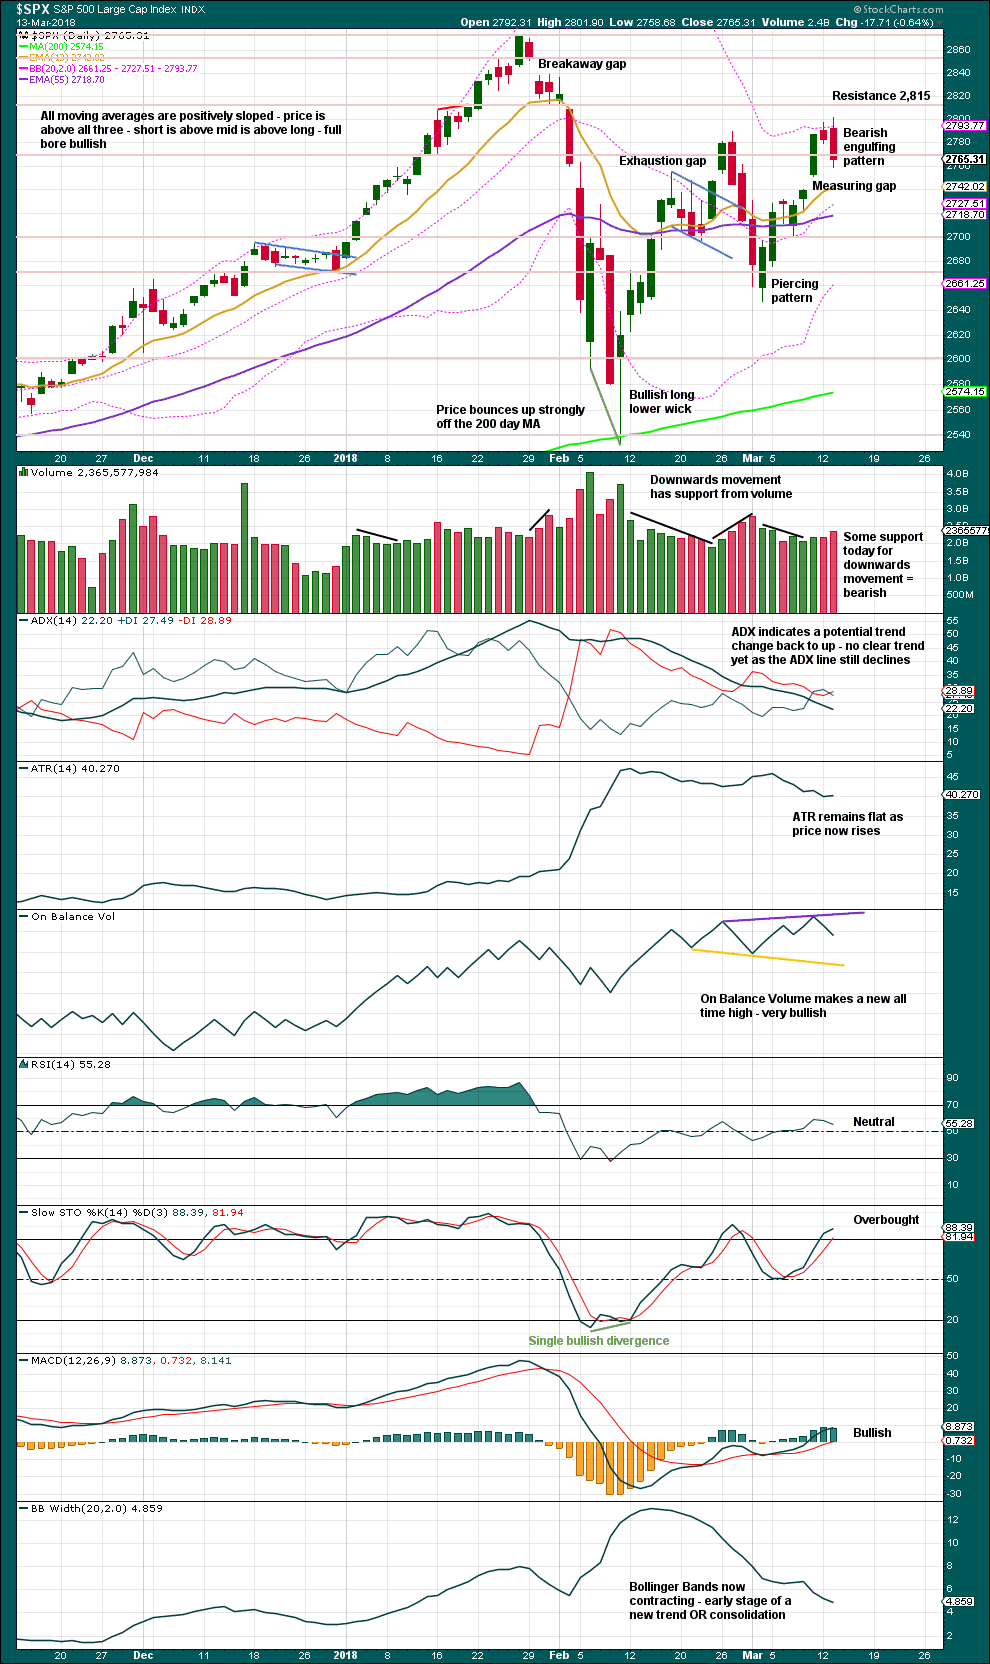
The volume profile is bearish for the short term, but this has been the case for a long time in this market. Price has been rising on light and declining volume for years now. At this time, it will not be given much weight in this analysis.
The pullback has brought ADX down from very extreme and RSI down from extremely overbought. There is again room for a new trend to develop.
DAILY CHART
Click chart to enlarge. Chart courtesy of StockCharts.com.
The measuring gap gives a target at 2,845. This may not be met.
The Bearish Engulfing reversal pattern comes after a clear upwards wave. This has support today from volume and should be given weight.
VOLATILITY – INVERTED VIX CHART
Click chart to enlarge. Chart courtesy of StockCharts.com.
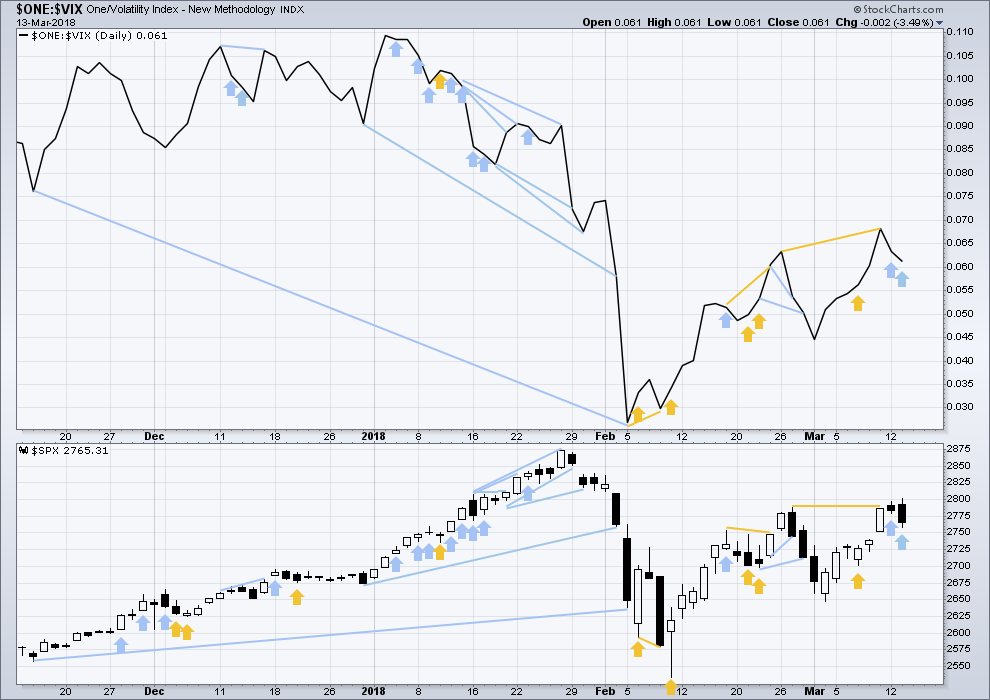
So that colour blind members are included, bearish signals will be noted with blue and bullish signals with yellow.
Normally, volatility should decline as price moves higher and increase as price moves lower. This means that normally inverted VIX should move in the same direction as price.
Inverted VIX today has made a new low below the prior low two sessions ago, but price has not yet made a corresponding new low. The fall in price today comes with a strong increase in volatility. If this is a leading indicator, then it is bearish.
BREADTH – AD LINE
Click chart to enlarge. Chart courtesy of StockCharts.com.
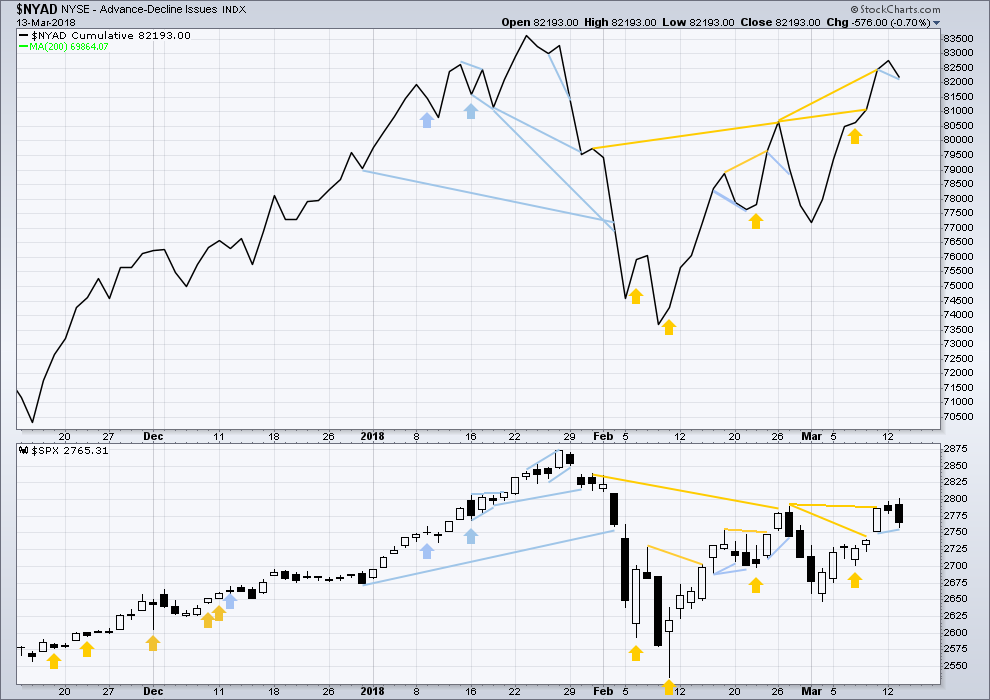
There is normally 4-6 months divergence between price and market breadth prior to a full fledged bear market. This has been so for all major bear markets within the last 90 odd years. With no longer term divergence yet at this point, any decline in price should be expected to be a pullback within an ongoing bull market and not necessarily the start of a bear market.
All of small, mid and large caps last week completed an outside week. All sectors of the market at this time appear to be in a consolidation.
Breadth should be read as a leading indicator.
The AD line today has made a new low below the prior low two sessions ago. The downwards movement today in price has strong support from falling market breadth, which is bearish.
DOW THEORY
All indices have made new all time highs as recently as seven weeks ago, confirming the ongoing bull market.
The following lows need to be exceeded for Dow Theory to confirm the end of the bull market and a change to a bear market:
DJIA: 17,883.56.
DJT: 7,039.41.
S&P500: 2,083.79.
Nasdaq: 5,034.41.
Charts showing each prior major swing low used for Dow Theory are here.
Published @ 09:36 p.m. EST.
Updated hourly chart.
I’m going to have to separate out two ideas shortly.
If this downwards move is minor C within a larger triangle for intermediate (4) then it should be a single or double zigzag. Which means minute a would be a five.
If this downwards move is minor Y within a larger combination for intermediate (4) then it would most likely be a flat. Which means minute a would be a three, most likely a zigzag.
So… either an impulse or a zigzag may be unfolding lower. For now that’s best considered at the daily chart level or we’d be focussing on too small a movement.
Goodness. I hope that all makes sense! Corrections do get tricksy.
In this broad ranging market the macd cross at the hourly timeframe seems to be giving quality signals.
I believe the SPX is at a very precarious position. As Lara has pointed out the balance of TA has turned bearish during the past couple of weeks as the SPX has risen to near 2800. If the 2740 to 2750 gap does not hold, it spells downside movement to continue. I would guess at that point it would accelerate as well. The 13, 34 and 50 day ema’s are clustered together just below the gap. If we break those, it might bring about a “look out below” scenario.
I am closely watching these developments and will most likely be cashing in a large portion of my long positions today. Risk has increased greatly and I don’t want to sit through another move down to 2500 or below.
There are a bunch of fibo’s at the lower end of the gap, which SPX price is now approaching. Potential for a turn. This is still in the potential realm of “just a minuette 4”. The market seems to be full of these large swinging hurky jerky moves now.
Fibo’s and gap held…now is the 4 over or is it going to go “combo” on us? I dunno. I’m rather bullish for the next two days, though, at this point.
I’m standing on the fence.
I am too, at the moment, and now another sharp sell off. Is it just the algo’s having a ball today, fading every move? Whatever, it’s not impulsive up, that’s for sure!!!
Liquidating my long positions.
Not to be-labor the point, but the central banks are holding this up with all their might. If it were just algos, we’d be down much further the past few days. My Buy-side friends are moving to cash by end of quarter so I would imagine at least a re-test of lows, if not a waterfall event soon.
Thank you Chris for the heads up. I am intending to short (Eddy would go!!!) on a break below this gap.
One trading compadre thinks there will be significant upward push in the market Thurs/Fri due to SPY shorts exiting to avoid having to pay the dividend that transpires on Friday. I don’t know if there’s credence in that or not but thought I’d share it.
Kevin,
Thanks for that tid bit insight
Mike
I don’t see that pesky wabbit anyware!!!??