
Price continues to move higher as last analysis expected. The targets remain the same.
Summary: Expect upwards movement to overall continue this week. The target is either 2,845 (classic analysis), 2,869 (Elliott wave) or 3,006 (Elliott wave) for the short term.
If price makes a new all time high with a bullish signal from On Balance Volume and the AD line, or reasonable support from volume, then it is possible that the pullback was over on the 9th of February and the bull market has resumed. But if weakness in upwards movement is seen, then it may be a B wave and doomed to full retracement.
Always practice good risk management. Always trade with stops and invest only 1-5% of equity on any one trade.
The biggest picture, Grand Super Cycle analysis, is here.
Last historic analysis with monthly charts is here. Video is here.
An alternate idea at the monthly chart level is given here at the end of this analysis.
An historic example of a cycle degree fifth wave is given at the end of the analysis here.
MAIN ELLIOTT WAVE COUNT
WEEKLY CHART
Click chart to enlarge.
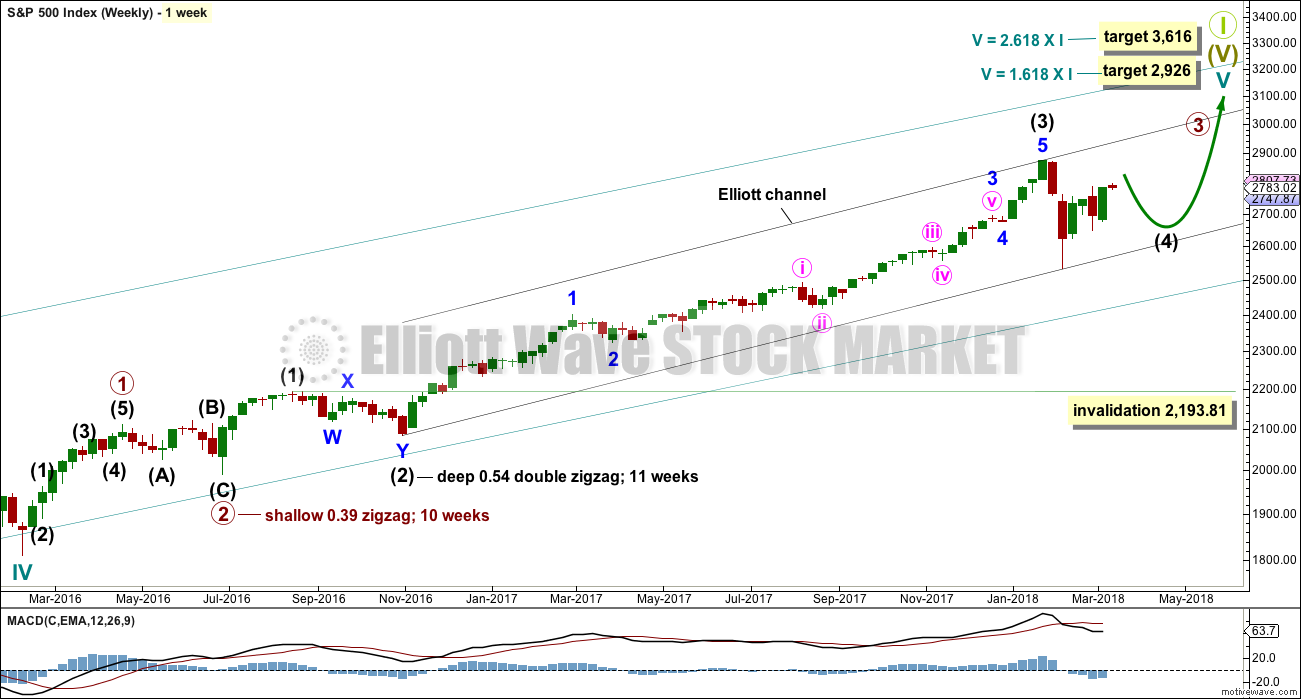
Cycle wave V must complete as a five structure, which should look clear at the weekly chart level. It may only be an impulse or ending diagonal. At this stage, it is clear it is an impulse.
Within cycle wave V, the third waves at all degrees may only subdivide as impulses.
Intermediate wave (4) has breached an Elliott channel drawn using Elliott’s first technique. The channel is redrawn using Elliott’s second technique as if intermediate wave (4) was over at the last low. If intermediate wave (4) continues sideways, then the channel may be redrawn when it is over. The upper edge may provide resistance for intermediate wave (5).
Intermediate wave (4) may not move into intermediate wave (1) price territory below 2,193.81. At this stage, it now looks like intermediate wave (4) may be continuing further sideways as a combination, triangle or flat. These three ideas are separated into separate daily charts. All three ideas would see intermediate wave (4) exhibit alternation in structure with the double zigzag of intermediate wave (2).
A double zigzag would also be possible for intermediate wave (4), but because intermediate wave (2) was a double zigzag this is the least likely structure for intermediate wave (4) to be. Alternation should be expected until price proves otherwise.
DAILY CHART – TRIANGLE
Click chart to enlarge.
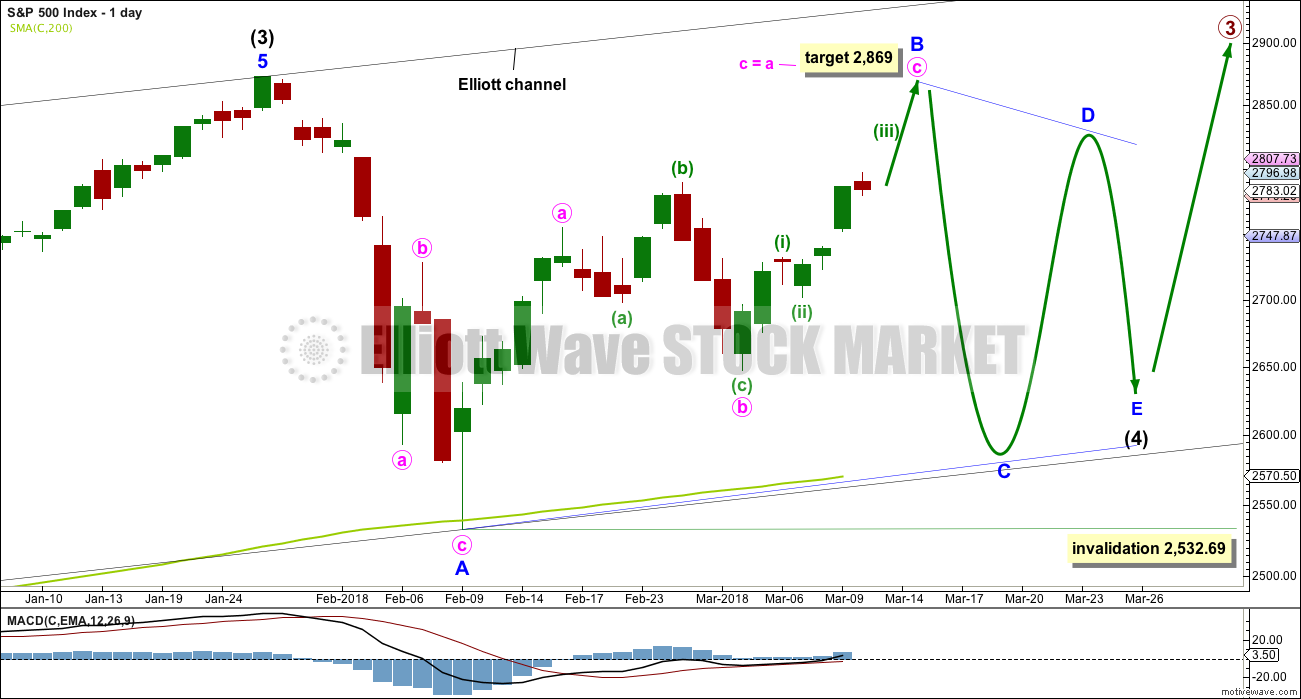
This first daily chart outlines how intermediate wave (4) may now continue further sideways as a contracting or barrier triangle. If the triangle is a running triangle, then within it minor wave B may make a new high above the start of minor wave A at 2,872.87.
Minor wave C may not make a new low below the end of minor wave A at 2,532.69.
Intermediate wave 2 lasted 11 weeks. If intermediate wave (4) is incomplete, then it would have so far lasted only six weeks. Triangles tend to be very time consuming structures, so intermediate wave (4) may total a Fibonacci 13 or even 21 weeks at its conclusion.
Because this is the only daily chart which expects price to continue to find support at the 200 day moving average, it is presented first; it may have a slightly higher probability than the next two daily charts.
DAILY CHART – COMBINATION
Click chart to enlarge.
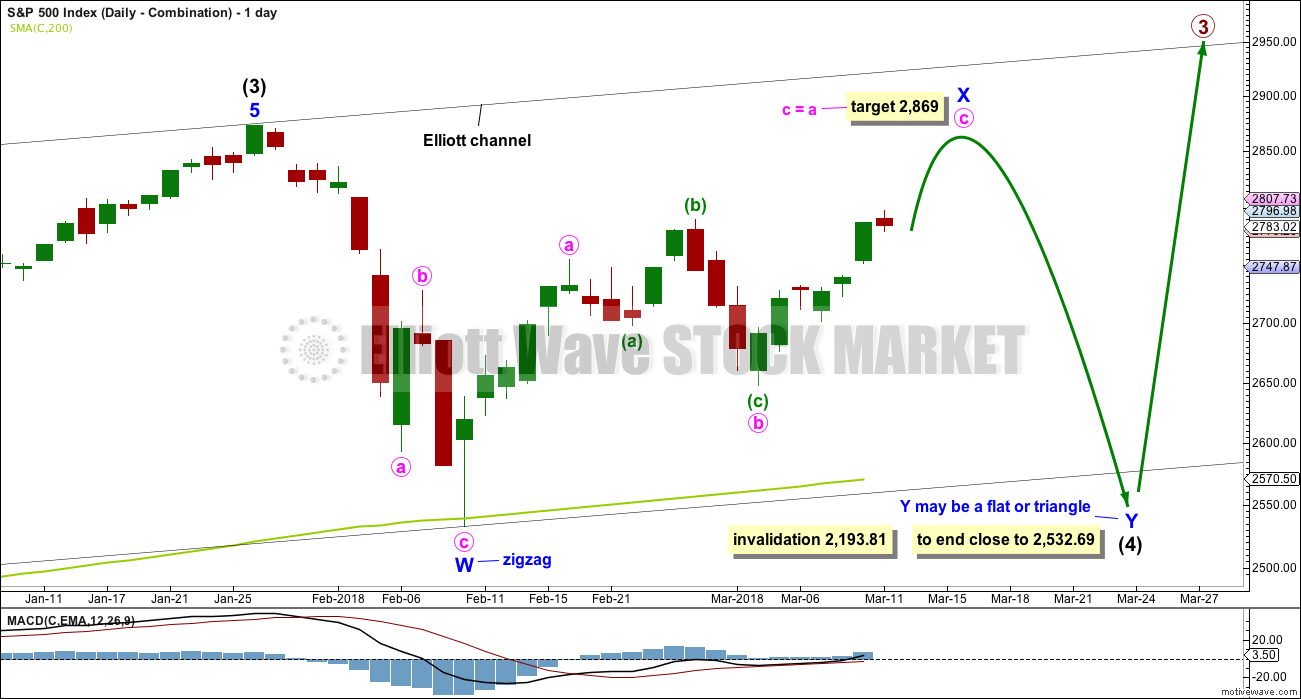
Double combinations are very common structures. The first structure in a possible double combination for intermediate wave (4) would be a complete zigzag labelled minor wave W. The double should be joined by a three in the opposite direction labelled minor wave X, which may be an incomplete zigzag. X waves within combinations are typically very deep; there is no upper invalidation point for minor wave X, so it may make a new high above the start of minor wave W at 2,872.87.
The second structure in the double would most likely be a flat correction labelled minor wave Y. It may also be a triangle, but in my experience this is very rare.
A flat correction would subdivide 3-3-5. Minute wave a must be a three wave structure, most likely a zigzag.
The purpose of combinations is to take up time and move price sideways. To achieve this purpose the second structure in the double usually ends close to the same level as the first. Minor wave Y would be expected to end about the same level as minor wave W at 2,532.69. This would require a strong overshoot or breach of the 200 day moving average.
DAILY CHART – FLAT
Click chart to enlarge.
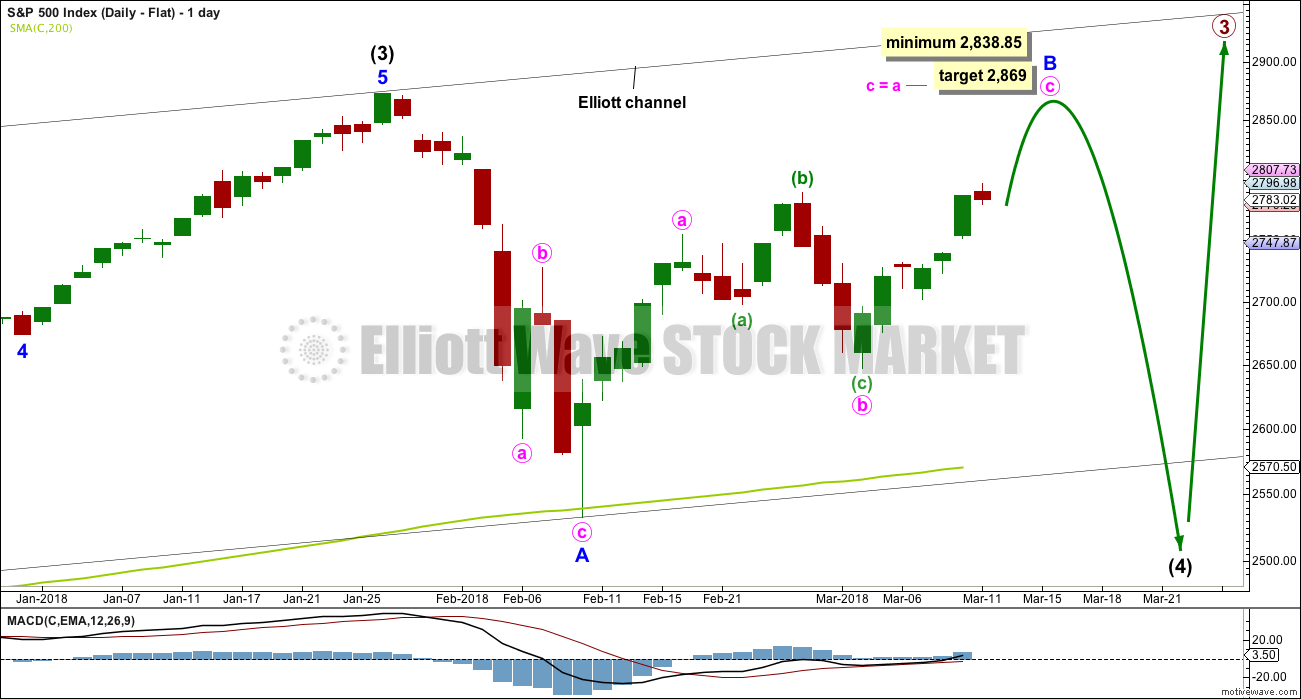
Flat corrections are very common. The most common type of flat is an expanded flat. This would see minor wave B move above the start of minor wave A at 2,872.87.
Within a flat correction, minor wave B must retrace a minimum 0.9 length of minor wave A at 2,838.85. The most common length for minor wave B within a flat correction would be 1 to 1.38 times the length of minor wave A at 2,872.87 to 3,002.15. An expanded flat would see minor wave B 1.05 times the length of minor wave A or longer, at 2,889.89 or above.
When minor wave B is a complete corrective structure ending at or above the minimum requirement, then minor wave C downwards would be expected to make a new low below the end of minor wave A at 2,532.69 to avoid a truncation.
HOURLY CHART
Click chart to enlarge.
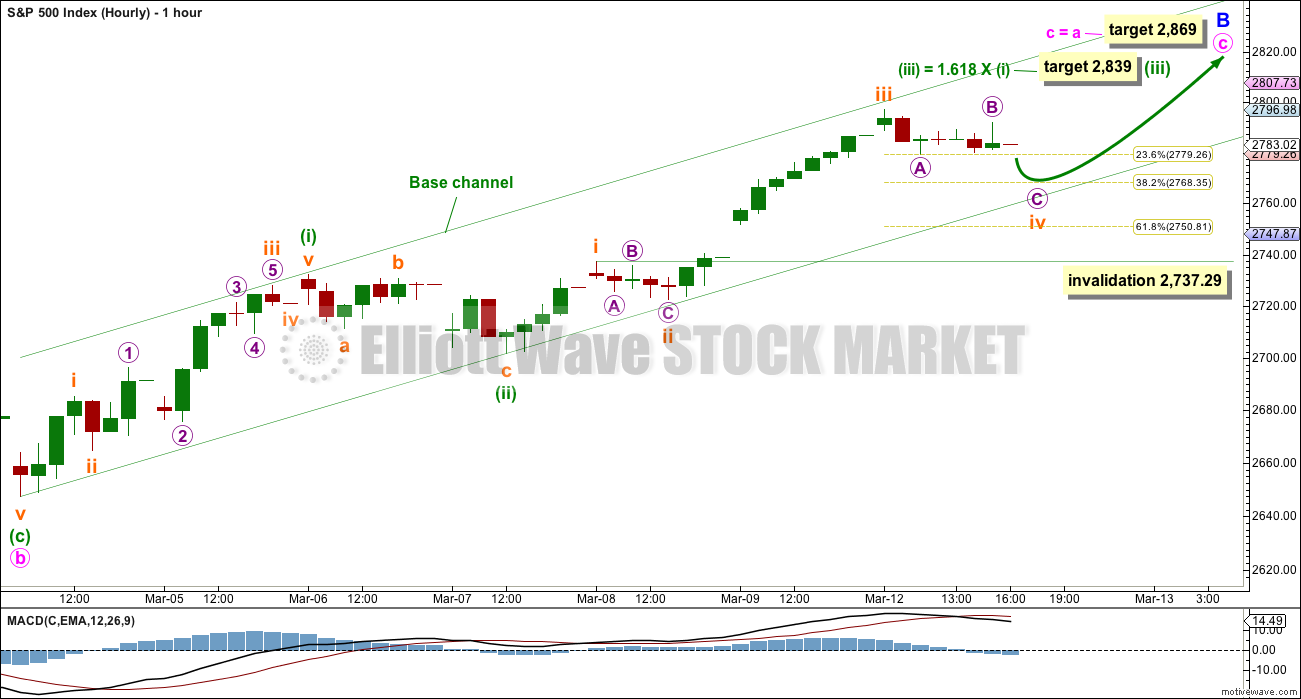
All three daily wave counts now expect an impulse upwards for minute wave c is unfolding. One hourly chart will suffice at this stage.
If an impulse upwards is unfolding for minute wave c, then it may have passed its middle on Friday. A short term target for minuette wave (iii) to end is calculated.
Minuette wave (iii) may only subdivide as an impulse, and within it subminuette wave iv may not move into subminuette wave i price territory below 2,737.29. Subminuette wave iv may be an incomplete zigzag and may move a little lower tomorrow when markets open.
There is no Fibonacci ratio between subminuette waves i and iii. This makes it more likely that subminuette wave v may exhibit a Fibonacci ratio to either of subminuette waves i or iii, and equality in length with subminuette wave i at 35.55 points. If it were to reach only equality in length with subminuette wave i, then it may end only slightly above the end of subminuette wave iii; the target at 2,839 may be too high.
So far price remains within the base channel. It is possible that the strength of a third wave may break above the upper edge of the base channel. Corrections along the way up should find support at the lower edge of the base channel.
DAILY CHART – ALTERNATE
Click chart to enlarge.
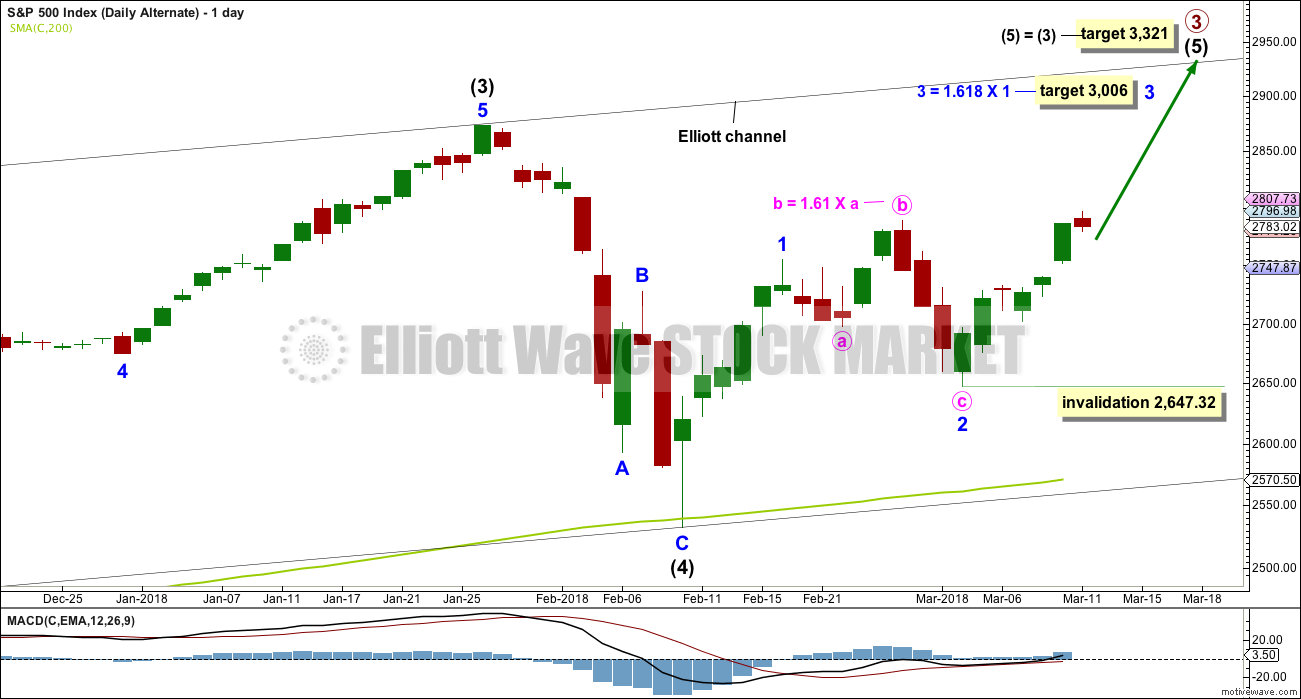
It is possible still that intermediate wave (4) was complete as a relatively brief and shallow single zigzag.
A new all time high with support from volume and any one of a bullish signal from On Balance Volume or the AD line would see this alternate wave count become the main wave count.
Within minor wave 3, no second wave correction may move beyond the start of its first wave below 2,647.32.
TECHNICAL ANALYSIS
WEEKLY CHART
Click chart to enlarge. Chart courtesy of StockCharts.com.
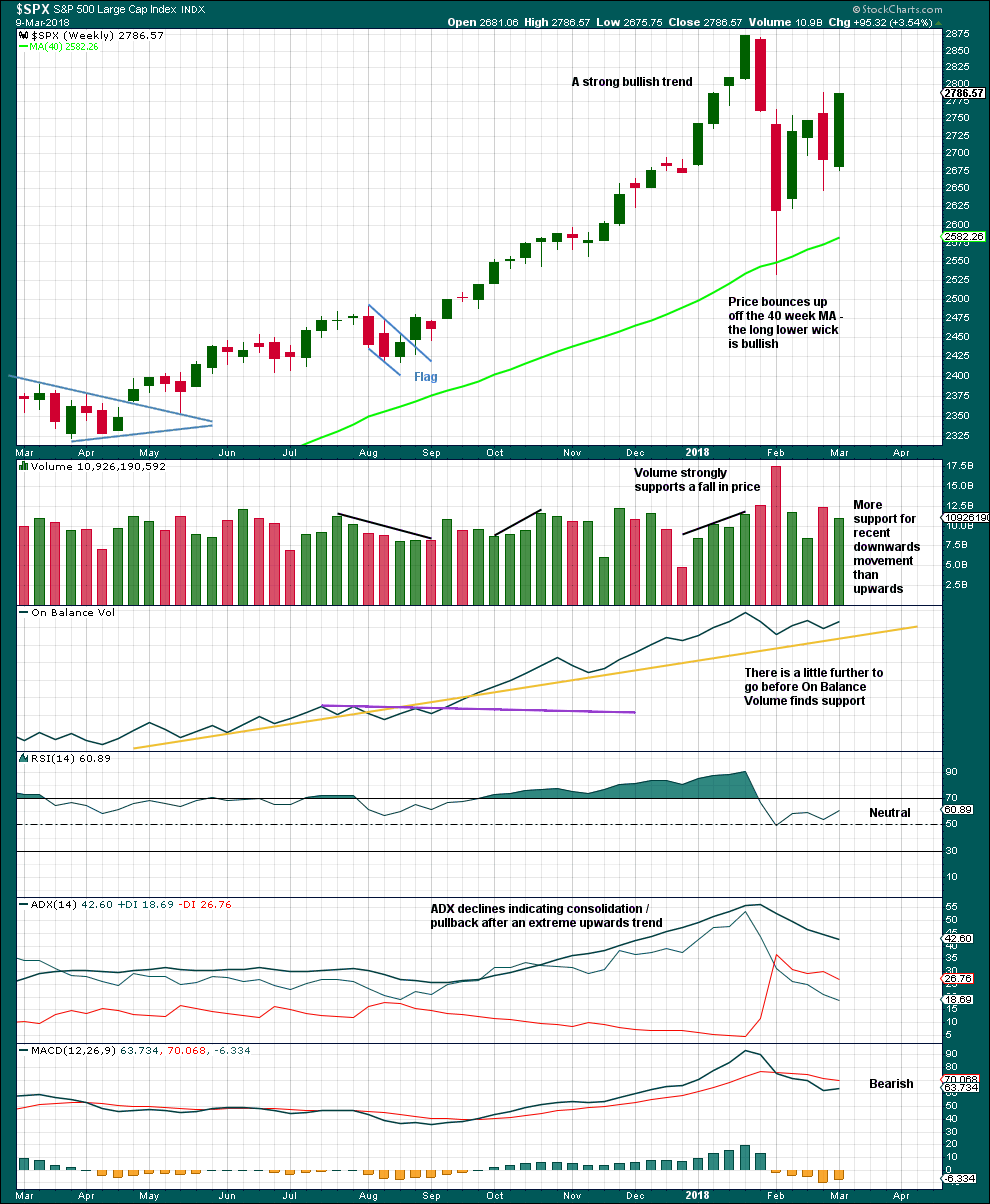
The volume profile is bearish for the short term, but this has been the case for a long time in this market. Price has been rising on light and declining volume for years now. At this time, it will not be given much weight in this analysis.
The pullback has brought ADX down from very extreme and RSI down from extremely overbought. There is again room for a new trend to develop.
DAILY CHART
Click chart to enlarge. Chart courtesy of StockCharts.com.
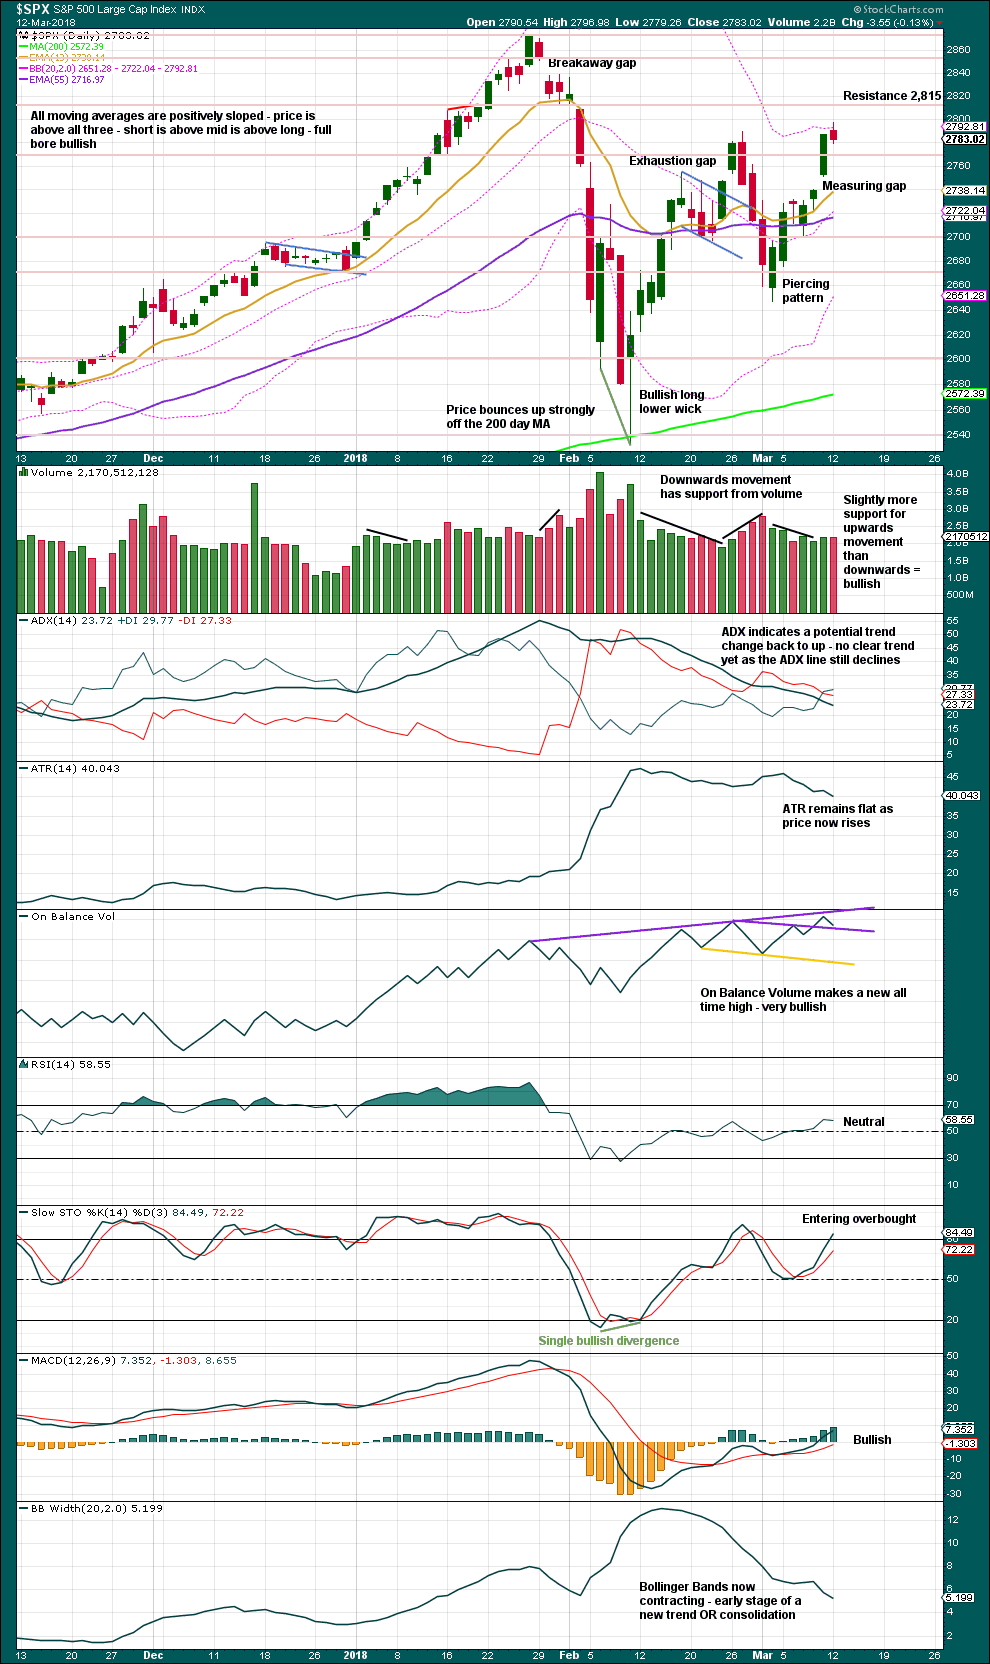
The measuring gap gives a target at 2,845.
Support for On Balance Volume may serve to limit the fall in price, but support here is weak.
VOLATILITY – INVERTED VIX CHART
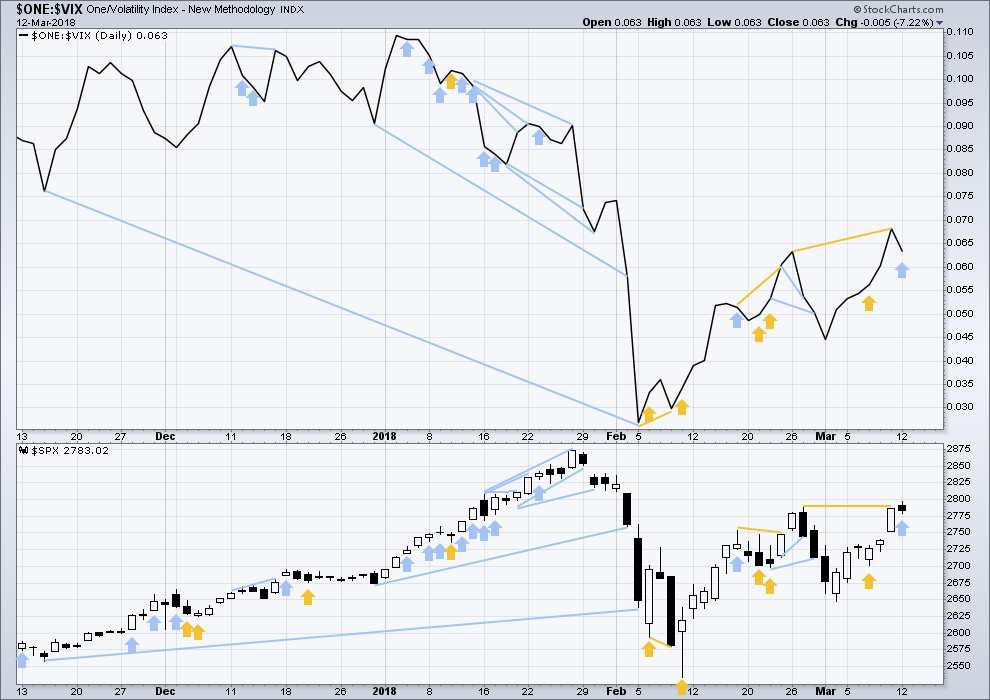
Click chart to enlarge. Chart courtesy of StockCharts.com.
So that colour blind members are included, bearish signals will be noted with blue and bullish signals with yellow.
Normally, volatility should decline as price moves higher and increase as price moves lower. This means that normally inverted VIX should move in the same direction as price.
Price moved higher today, but inverted VIX has moved lower. The rise in price today did not come with a normal corresponding decline in market volatility; volatility has slightly increased. This divergence is interpreted as bearish.
BREADTH – AD LINE
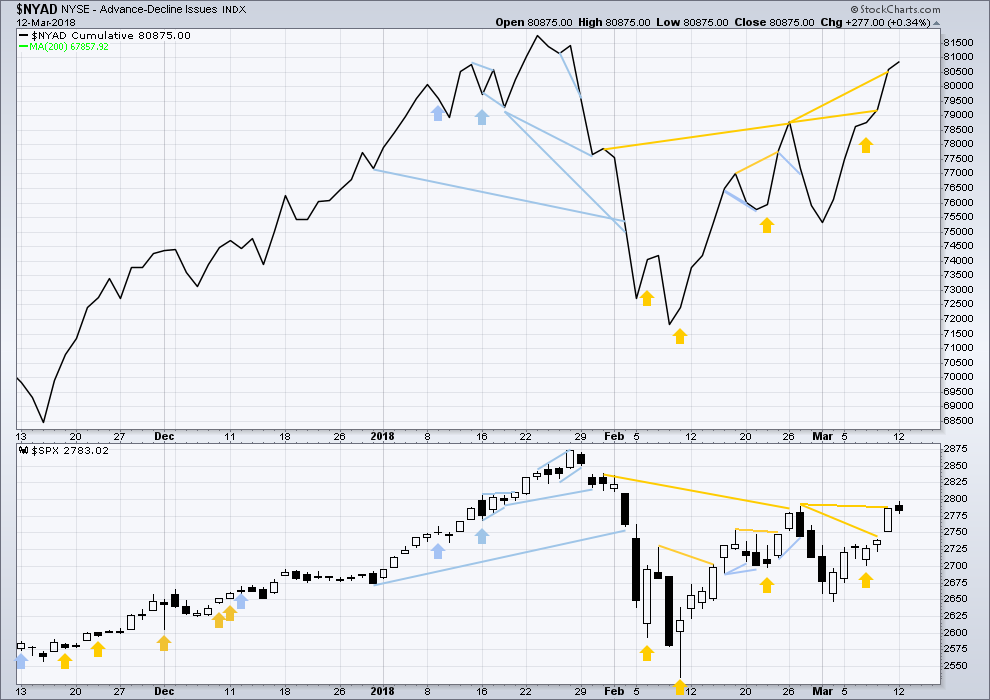
Click chart to enlarge. Chart courtesy of StockCharts.com.
There is normally 4-6 months divergence between price and market breadth prior to a full fledged bear market. This has been so for all major bear markets within the last 90 odd years. With no longer term divergence yet at this point, any decline in price should be expected to be a pullback within an ongoing bull market and not necessarily the start of a bear market.
All of small, mid and large caps last week completed an outside week. All sectors of the market at this time appear to be in a consolidation.
Breadth should be read as a leading indicator.
Upwards movement in price has support from rising market breadth. This is bullish and will be given more weight than bearish divergence from inverted VIX.
DOW THEORY
All indices have made new all time highs as recently as seven weeks ago, confirming the ongoing bull market.
The following lows need to be exceeded for Dow Theory to confirm the end of the bull market and a change to a bear market:
DJIA: 17,883.56.
DJT: 7,039.41.
S&P500: 2,083.79.
Nasdaq: 5,034.41.
Charts showing each prior major swing low used for Dow Theory are here.
Published @ 10:41 p.m. EST.
I think this is minuette (iv), not subminuette iv continuing. It looks too big. So yeah, I agree with you there Kevin.
Redraw the channel now using Elliott’s first technique for an impulse. The lower edge MIGHT show where price finds support. Fourth waves often but do not always do this. Sometimes they overshoot the channel, which is why Elliott developed a second technique.
So in the first instance look for support there.
Alternation with minuette (ii) in depth would mean minuette (iv) here may have a tendency to be deeper rather than shallow.
The high today is very close to the 76.4% retrace of the entire ATH to early Feb low move (I have a very slight overshoot; perhaps it’s perfect on /ES?). On top of that, there are (were) several fibonacci time projections indicating that early this week would be a significant market turn. The other side of of what’s happened is that often/usually when a market pushes through that 76% retrace, it tends to go to at least 100% and often 127% or more. It’s a critical level. SPX’s inability to push through may be significant. At the moment, the channel is holding, and I’d sure like a monster impulsive minuette 5 here, and will take buy triggers if and as it kicks off. But I’m suspicious that maybe, somehow, right here today, the B wave terminated.
With support today from volume, a Bearish Engulfing candlestick reversal pattern, and a bearish signal from the AD line, I agree with you.
It looks like the target at 2,869 will not be met. It looks like we’re in for at least a few days of downwards movement here.
if this sell off is minuette 4 starting up (my best guess), and if it’s of the same depth (price range) as the minuette 2, then the eventual low here is around 2770. Probably tomorrow, maybe Thurs/Fri.
…or subminuette 4 still unfolding as an expanded flat???
Perhaps but it appears a bit oversized for that to me, in both price and time, comparted to the corresponding subminuette 2. My projection of 2770 was hit and for the moment the market is turning up.
Kevin
It looks like you might have nailed it.
Do you think the market is now heading higher?
Thank You
I have several answers for you Eric. One, I don’t know (my best answer!). Two, without knowing the timeframe of your question (in the next hour? Day? Week?) I can’t begin to really attempt to formulate an answer.
That all said…I don’t think this sell off (4 of some kind) action is complete. I only really see an A down so far, and as Curtis points out, it’s a 5 wave move. I expect more churn with some fresh push down (a C down of some sort) before another real impulse launches. And it’s not impossible we’ve just had a weekly top. Not impossible at all. Robert Miner is strongly suggesting if not out right calling a weekly top here, for example.
I am looking at the 2755 to 2750 level to complete the current correction down from this morning’s high. That would bring us to the top of the open gap. The initial five down can be counted as three as well. But then I see the move over 2800 resuming.
I am also of your persuation Kevin, the the bullish alternate is the eventual winner of the current debate of possible EW patterns.
Perhaps, perhaps. I’ve taken this second hit on the 2770 area long as I like the close by logical stop combined with the significant upside, nice reward/risk for a short term guy like me.
I’ve got 2751 as the A=C price, and 2750.3 is the 1.62% extension of the A as well. And of course the gap starts right there. A bit higher is the 1.27% extension around 2761.5. All possible turn spots, should the current low for the day break, which I now suspect is likely.
2750.81 is the 61.8 retrace per lara
Looks like 5 down from this morning’s high. So I’m guessing it’s either the end of an expanded flat or the beginning of something larger that will go a lot lower.
Heck of a reversal this morning in GLD. At the same time as bonds reversed too. Interesting. GLD is still in its hourly squeeze and the last time it did this for this long (about 3 weeks ago) it resolved with a very strong drop in price. TMV continues a squeeze at the daily level. I note that home builders have renewed life, and materials are strong. The bull is certainly roaring again, and my view is the #1 most likely model is the bullish “alternate”, particularly with the clear support of NDX up to new ATH’s. But you never know and nimbleness is key.
So I see intraday and rather strong reversals in GLD, TMV, UUP, FXE. Hmmm. And the equity markets seeming to top and turn too. Interesting.
Thank you, Lara! And yes, we’re now back to that uniquely American self-deception known as Daylight Savings Time.
You’re welcome.
Next up… NZ to end our daylight savings. That’ll throw me again….
It always takes me a few days to wrap my head around time changes. Dunno why, but it’s just something I have a little mental issue with. That and punctuation.