
Upwards movement has unfolded for Thursday’s session as expected.
A new short term target is calculated at two wave degrees.
Summary: Expect now for the short term a little more upwards movement to end about 2,754- 2,758. Thereafter, look for a few days of downwards movement.
A new high now above 2,789.15 would be fairly bullish.
Always practice good risk management. Always trade with stops and invest only 1-5% of equity on any one trade.
The biggest picture, Grand Super Cycle analysis, is here.
Last historic analysis with monthly charts is here. Video is here.
An alternate idea at the monthly chart level is given here at the end of this analysis.
An historic example of a cycle degree fifth wave is given at the end of the analysis here.
MAIN ELLIOTT WAVE COUNT
WEEKLY CHART

Click chart to enlarge.
Cycle wave V must complete as a five structure, which should look clear at the weekly chart level. It may only be an impulse or ending diagonal. At this stage, it is clear it is an impulse.
Within cycle wave V, the third waves at all degrees may only subdivide as impulses.
Intermediate wave (4) has breached an Elliott channel drawn using Elliott’s first technique. The channel is redrawn using Elliott’s second technique as if intermediate wave (4) was over at the last low. If intermediate wave (4) continues sideways, then the channel may be redrawn when it is over. The upper edge may provide resistance for intermediate wave (5).
Intermediate wave (4) may not move into intermediate wave (1) price territory below 2,193.81. At this stage, it now looks like intermediate wave (4) may be continuing further sideways as a combination or triangle. These two ideas are separated into two separate daily charts. They are judged to have an even probability at this stage.
A double zigzag would also be possible for intermediate wave (4), but because intermediate wave (2) was a double zigzag this is the least likely structure for intermediate wave (4) to be. Alternation should be expected until price proves otherwise.
DAILY CHART – TRIANGLE
Click chart to enlarge.
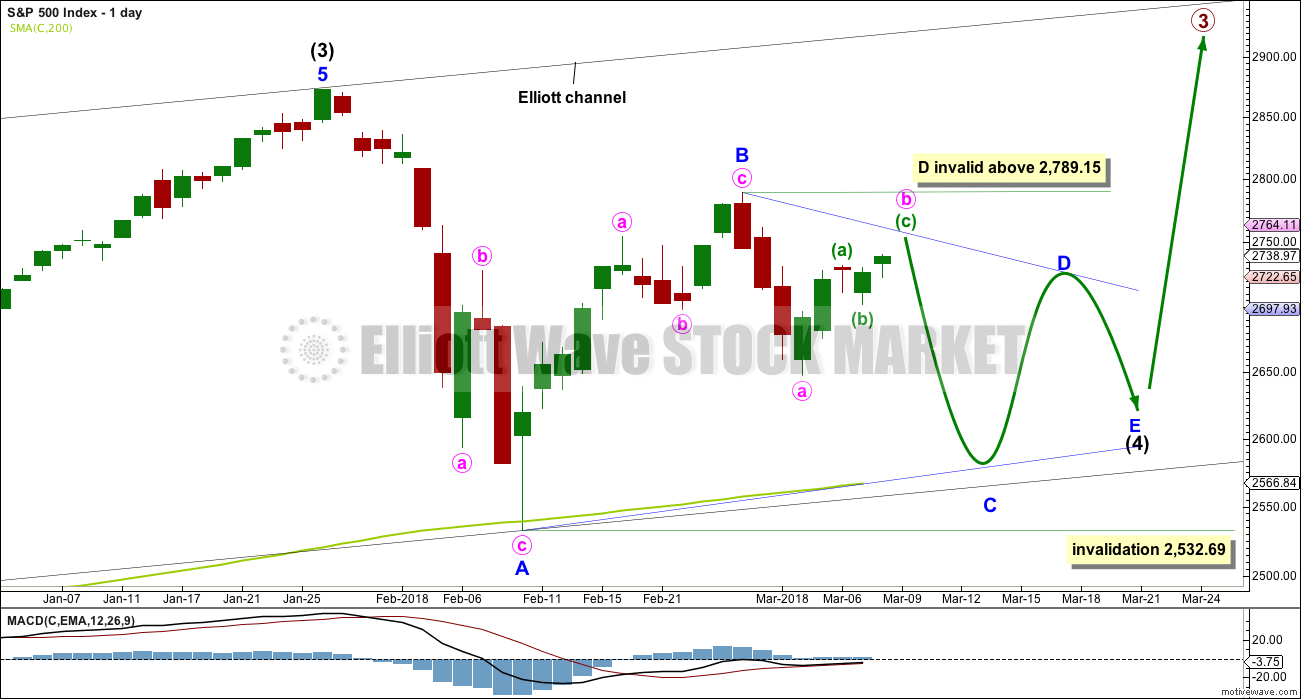
This first daily chart looks at the possibility that intermediate wave (4) may be continuing sideways as a regular contracting or regular barrier triangle.
Four of the five sub-waves within a triangle must subdivide as zigzags. One sub-wave may be a more complicated multiple, most often this is wave C.
Minor wave C may not move beyond the end of minor wave A below 2,532.69.
A common length for triangle sub-waves is from 0.8 to 0.85 of the prior sub-wave. This gives a target range of 2,584 – 2,571 for minor wave C downwards.
Minor wave D of a contracting triangle may not move beyond the end of minor wave B above 2,789.15. Minor wave D of a barrier triangle may end about the same level as minor wave B so that the B-D trend line remains essentially flat. In practice this means that minor wave D may end slightly above 2,789.15. This invalidation point is not black and white.
Thereafter, minor wave E may not move beyond the end of minor wave C.
A triangle may continue to find support about the 200 day moving average, possibly with small overshoots.
An expanding triangle will not be considered because they are extremely rare structures. I have never seen one in my now 10 years of daily Elliott wave analysis, and so we should not expect this to be a first.
DAILY CHART – COMBINATION
Click chart to enlarge.
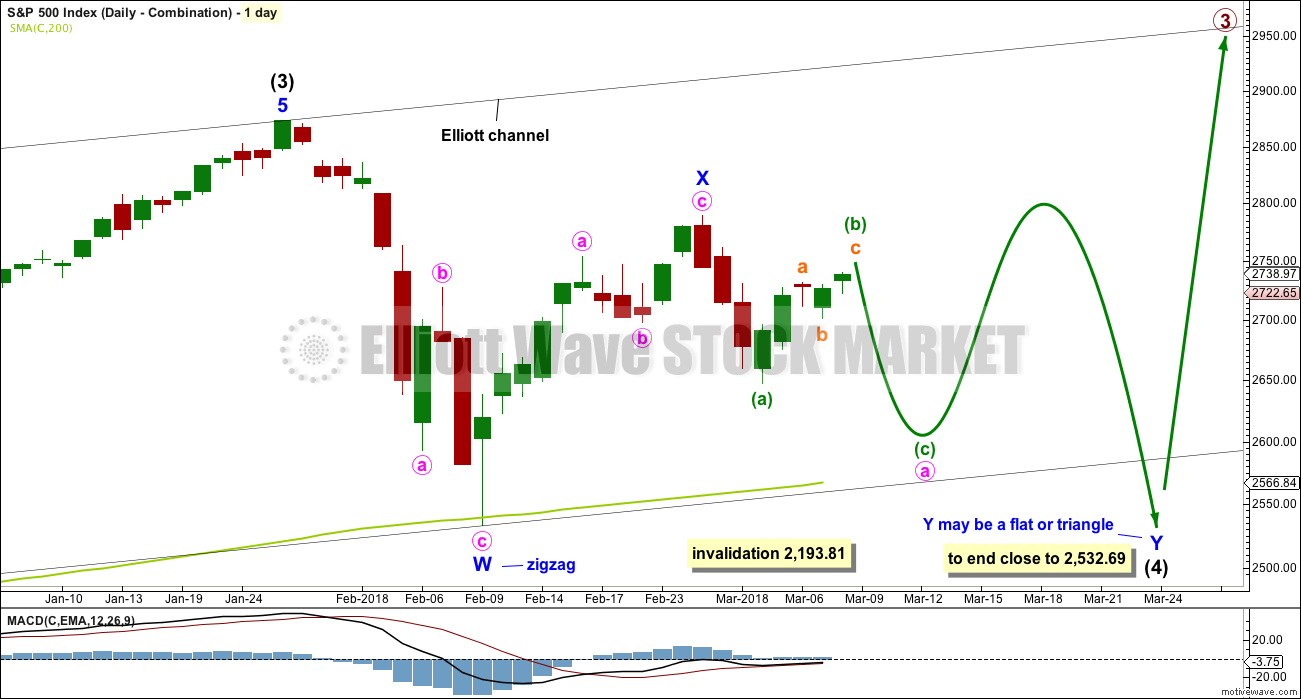
Double combinations are very common structures. The first structure in a possible double combination for intermediate wave (4) would be a complete zigzag labelled minor wave W. The double would be joined by a complete three in the opposite direction, a zigzag labelled minor wave X.
The second structure in the double would most likely be a flat correction labelled minor wave Y. It may also be a triangle, but in my experience this is very rare.
A flat correction would subdivide 3-3-5. Minute wave a must be a three wave structure, most likely a zigzag.
The purpose of combinations is to take up time and move price sideways. To achieve this purpose the second structure in the double usually ends close to the same level as the first. Minor wave Y would be expected to end about the same level as minor wave W at 2,532.69. This would require a strong overshoot or breach of the 200 day moving average.
At this stage, both wave counts expect a zigzag downwards to be unfolding. The degree of labelling would be different, but the structure would be the same. One hourly chart at this time will suffice for both daily wave counts.
HOURLY CHART
Click chart to enlarge.
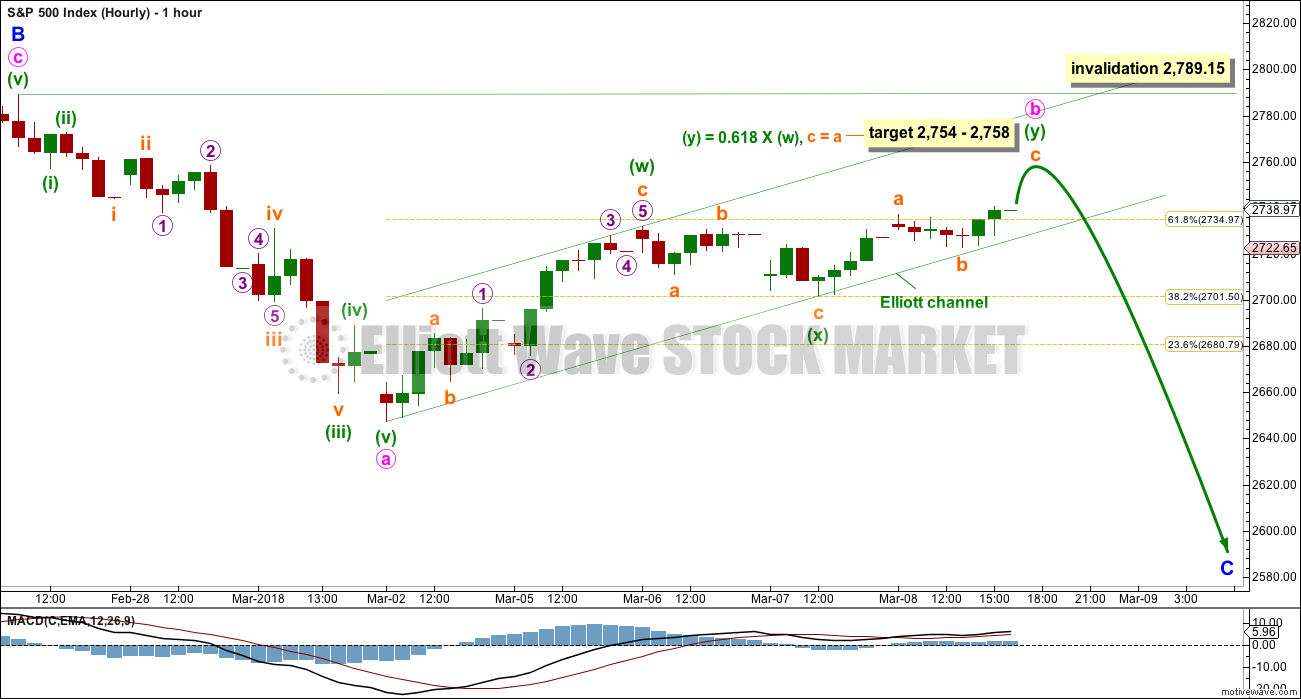
Both daily wave counts expect a zigzag is unfolding lower. The triangle wave count sees it as minor wave C. The combination wave count sees it as minute wave a. The degree of labelling on this hourly chart fits the triangle wave count. It would be labelled one degree lower for the combination wave count.
The last target at 2,734 – 2,735 was met and exceeded. Price keeps rising. A new target is calculated.
Assume the trend remains upwards while price remains within the green Elliott channel. If price breaks below the lower edge of the channel, then assume minute wave b is over and minute wave c has begun. Minute wave c may last a few days.
Minute wave b may not move beyond the start of minute wave a above 2,789.15.
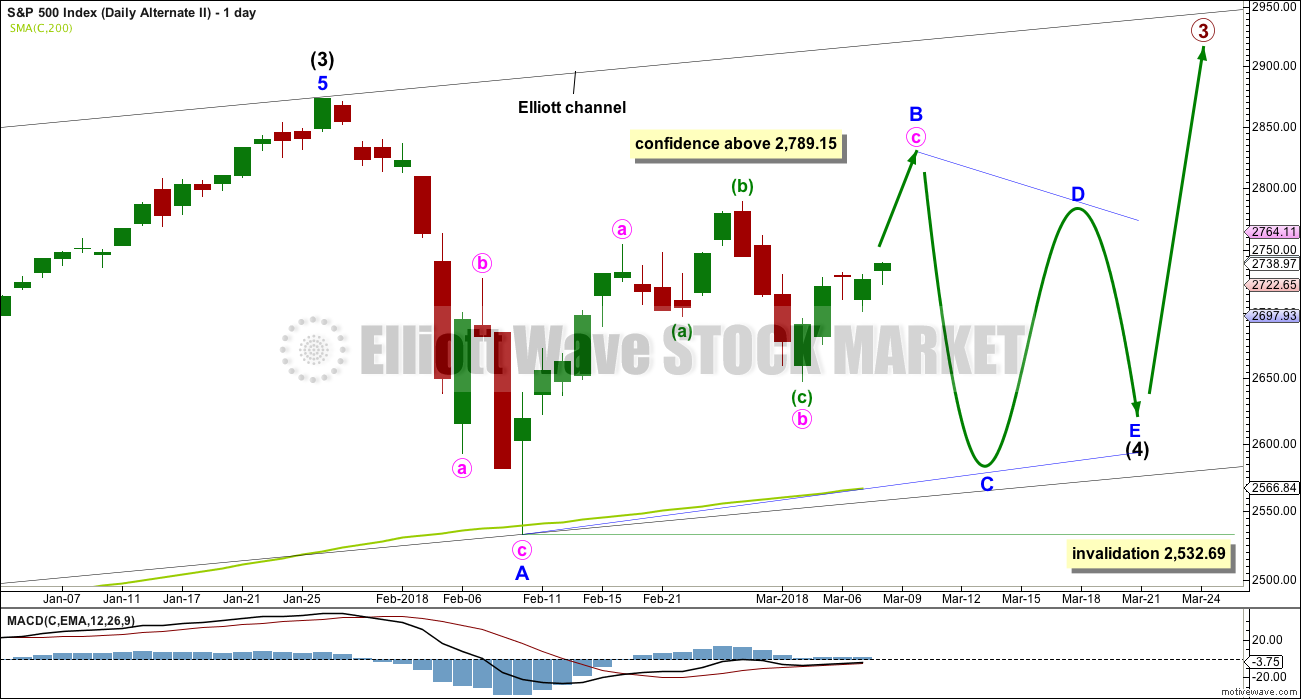
DAILY CHART – ALTERNATE
Click chart to enlarge.
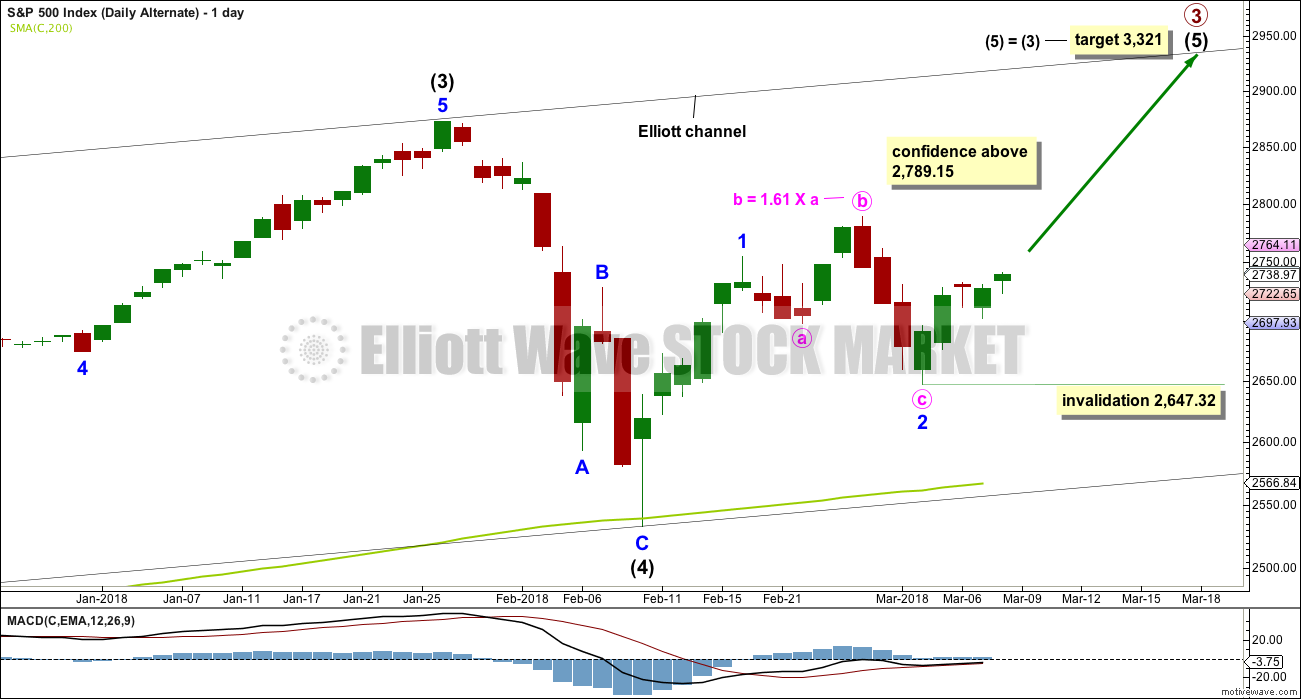
It is possible still that intermediate wave (4) was complete as a relatively brief and shallow single zigzag.
A new high above 2,789.15 would add some confidence to this alternate wave count, but the triangle alternate below would also remain valid.
A new all time high with support from volume and any one of a bullish signal from On Balance Volume or the AD line would see this alternate wave count become the main wave count.
Within minor wave 3, no second wave correction may move beyond the start of its first wave below 2,647.32.
DAILY CHART – TRIANGLE ALTERNATE
Click chart to enlarge.
If price makes a new high above 2,789.15, then this alternate would also be possible. Minor wave B of a triangle may be continuing higher.
A new all time high would see this wave count remain valid. Intermediate wave (4) may be a running triangle where minor wave B makes a new high above the start of minor wave A. If a new all time high came with reasonable weakness in upwards movement, then this would be the preferred wave count. B waves should exhibit weakness in one or more of volume, momentum and strength as measured by RSI.
TECHNICAL ANALYSIS
WEEKLY CHART
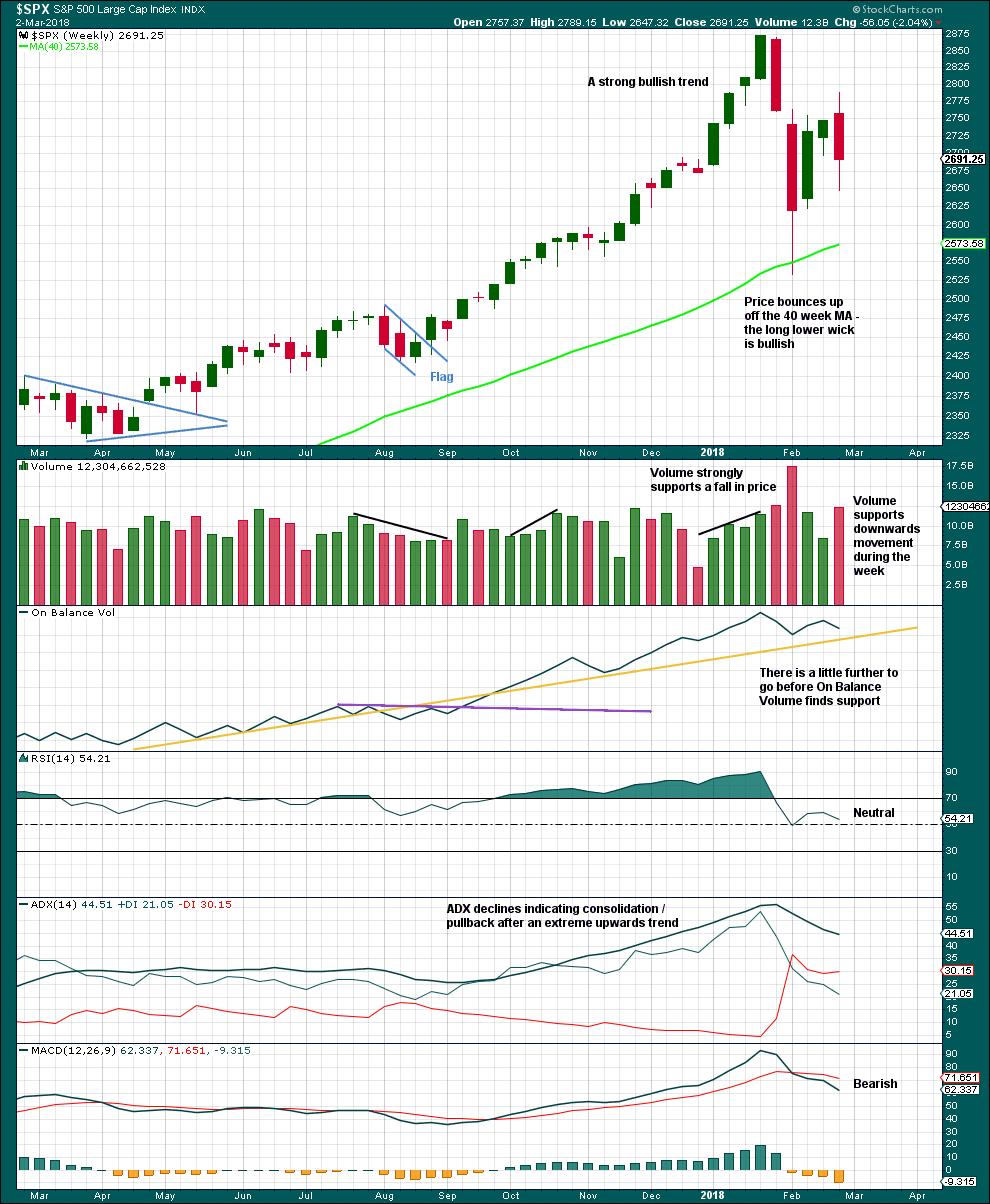
Click chart to enlarge. Chart courtesy of StockCharts.com.
This consolidation is bringing ADX down from very extreme and RSI from extremely overbought. There will again be room for a trend to develop when it is complete.
Short term volume suggests downwards movement is incomplete. Support on On Balance Volume may assist to halt a fall in price along with the 40 week (200 day) moving average.
DAILY CHART
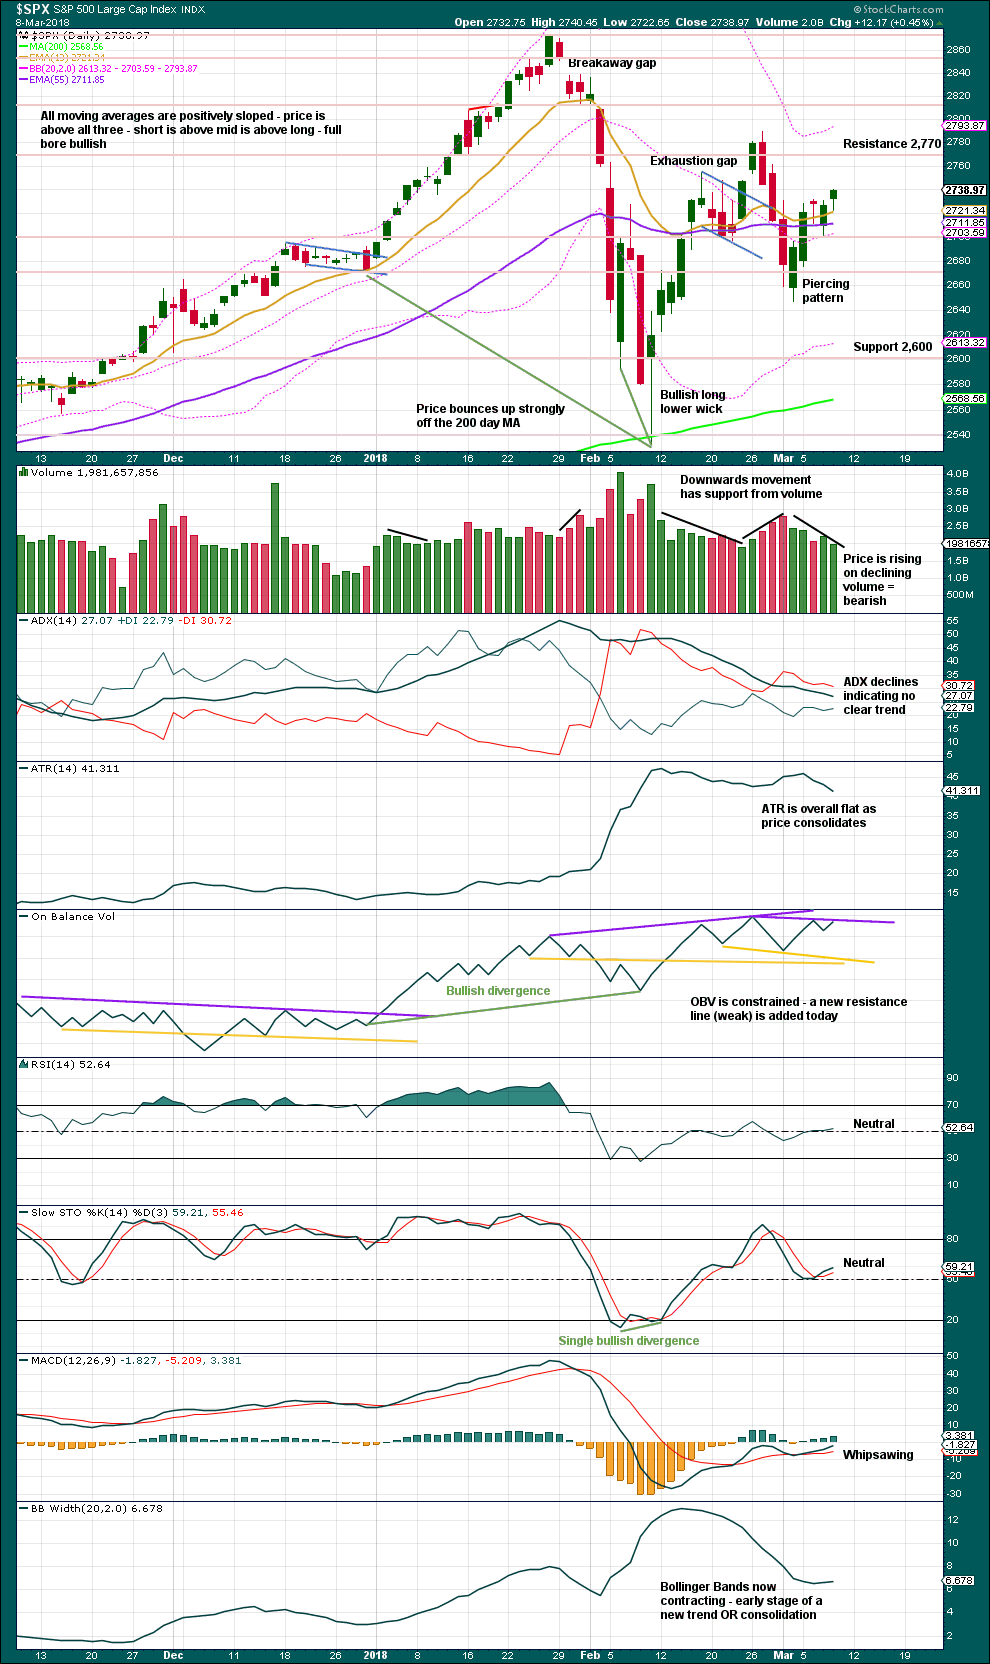
Click chart to enlarge. Chart courtesy of StockCharts.com.
Volume continues to be weak, but this has long been a feature of this market yet price continues to rise. For the short term, a bullish long lower wick on today’s candlestick suggests another upwards day tomorrow.
VOLATILITY – INVERTED VIX CHART
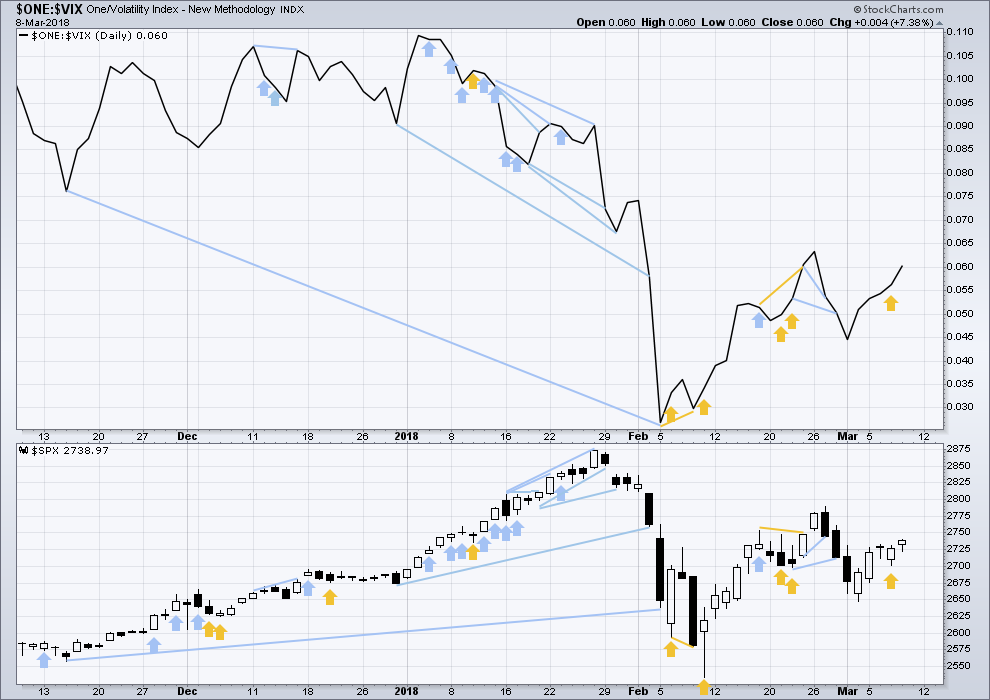
Click chart to enlarge. Chart courtesy of StockCharts.com.
So that colour blind members are included, bearish signals will be noted with blue and bullish signals with yellow.
Normally, volatility should decline as price moves higher and increase as price moves lower. This means that normally inverted VIX should move in the same direction as price.
Upwards movement in price today comes with a normal corresponding decline in market volatility as inverted VIX moves higher.
BREADTH – AD LINE
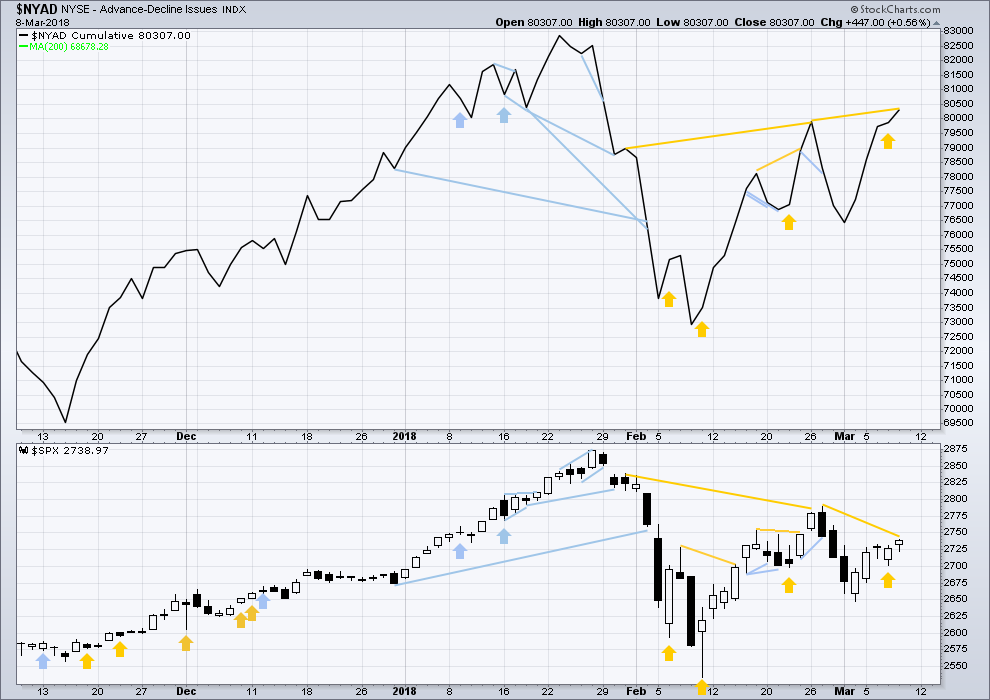
Click chart to enlarge. Chart courtesy of StockCharts.com.
There is normally 4-6 months divergence between price and market breadth prior to a full fledged bear market. This has been so for all major bear markets within the last 90 odd years. With no longer term divergence yet at this point, any decline in price should be expected to be a pullback within an ongoing bull market and not necessarily the start of a bear market.
All of small, mid and large caps last week completed an outside week. All sectors of the market at this time appear to be in a consolidation.
Breadth should be read as a leading indicator.
Upwards movement today has support from rising market breadth. The AD line has made a new high above the prior high of the 26th of February, but price has not yet made a corresponding new high. This is interpreted as bullish divergence, and it may support either of the two new alternate wave counts.
DOW THEORY
All indices have made new all time highs as recently as six weeks ago, confirming the ongoing bull market.
The following lows need to be exceeded for Dow Theory to confirm the end of the bull market and a change to a bear market:
DJIA: 17,883.56.
DJT: 7,039.41.
S&P500: 2,083.79.
Nasdaq: 5,034.41.
Charts showing each prior major swing low used for Dow Theory are here.
Published @ 07:07 p.m. EST.
http://www.longtermtrends.net/market-cap-to-gdp/
When you look at this information it feels like we are in Mid 1999 to early 2000
If history has any factor here this strongly suggest that we are in a topping formation.
Please check out the site and please give feedback.
I think its a great find
Thanks for posting that Eric. I agree, it’s a fantastic find!
I think I’ll add a link to it on the sidebar.
Alternates updated with targets:
It looks increasingly like this upwards movement is not done. And so we need some targets. Today looks strong.
Lets see what volume, On Balance Volume and the AD line have to say after the session is closed.
the other alternate updated:
QQQ above its Jan high. So do the other indexes follow or do we form a bearish divergence between Tech and the other indexes.
If I knew the answer to that question (and it was “yes”), I’d shove long.
In other words, that answer is unknowable. I’d say the odds favor it strongly now, myself, but don’t that let affect your perspective. Let’s see if Lara’s main switches to the bullish count or not over the weekend.
At the moment the stock indexes appear to be fractured.
The Dow Jones industrial average is far from a high.
The RUT is at almost a high.
The biggest index to keep and eye on is the Wilshire 5000 index to me that the big one. Look at the Wilshire to GDP on the guru web site. You will see that in January of this year we surpassed the 2000 high per GDP.
148 was the record back in 2000
recently we slightly broke that record.
But i honestly think that if the market continues higher i think the trend line on that senior index will keep somewhat of a speed limit on the overall stock market.
All comments are welcome.
What a day to be off on vacation. It’s always like that, right? Oh well, there’s always next week. Sure looking like the 4 is over to me! Enjoy the weekend all.
I see a 1-2 late yesterday, and all of the late day push up and all of today is a big hard charging 3. A 4 should start up soon, then a 5, and I’m a guessin’ price will over that “confidence level” of 2789 in the hourly bullish alternate.
Gotta go. Much to do today. Have a great day all.
In the last 3 months (Dec-Feb) the USA has added over 800,000 jobs! The USA is open for business once again. The New York Times wrote, “For Wall Street, the combination of a strong job growth and a modest rise in wages makes for a dream report.” That is being reflected in today’s equities markets.
We will still need to see how the day ends up, but this morning’s gap up could be the opening move of a third wave up, i.e. a break away gap. Just a couple of points more and we will have surpassed 2759.15 which adds ‘confidence’ to the Daily Chart Bullish Alternate.
Bingo – more confidence in Daily Bullish Alternate. Next hurdle is to confirm by exceeding SPX 2789.15.
Note: My above comment should have indicated we needed to surpass 2754.42 which was the resistance / top on Feb. 16th. Sorry for any confusion.
If today’s gap remains open, that will add confidence as well to the Daily Bullish Alternate. In addition, we should get a bullish signal from daily OBV today.
Looks like we are finishing a five up move. Fifth wave looks extended…..unless it is the wrong count. What happens after that corrects will be interesting. Is confidence had if it is only over 2754 intraday?
The break above 2754 is only one small piece of support for the Alternate Bullish Count. That is true upon the break regardless of where today closes. But the real, much stronger confidence comes with a break above 2789.15. That break can also be just intraday.
Here is my current count / labeling. Note: on this chart, colors and designations do not match Lara’s labeling.
Thanks for clarifying. A picture is worth a thousand words
Wow if this is wave iii it is already 2.5 x wave I….maybe going for a fib 2.6.
Hmmm… looks like everyone was bored by the market session today
Lol, the market has trained us recently to expect more!