Upwards movement has unfolded as expected for Monday’s session. The second target was almost reached.
Summary: Look first for a breach of the yellow best fit channel on the hourly chart. When price breaks below that channel, then expect a few days of downwards movement. The target is now at 2,586.
Always practice good risk management. Always trade with stops and invest only 1-5% of equity on any one trade.
The biggest picture, Grand Super Cycle analysis, is here.
Last historic analysis with monthly charts is here. Video is here.
An alternate idea at the monthly chart level is given here at the end of this analysis.
An historic example of a cycle degree fifth wave is given at the end of the analysis here.
MAIN ELLIOTT WAVE COUNT
WEEKLY CHART
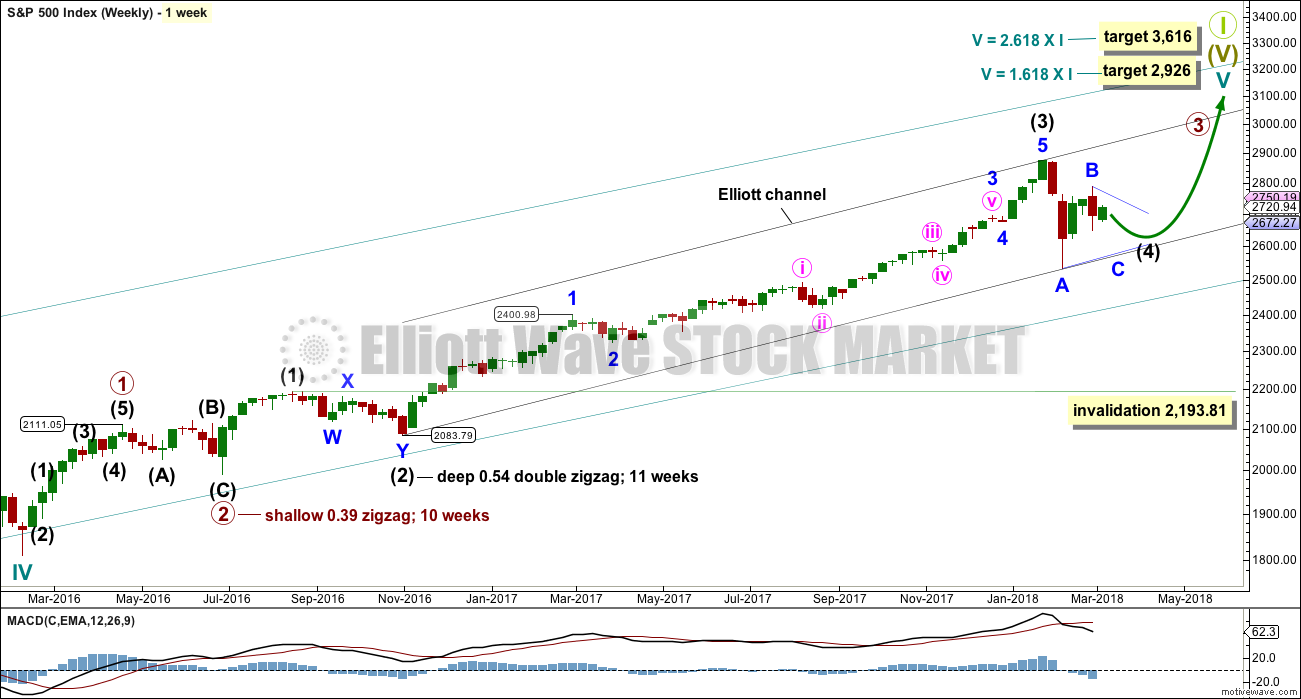
Cycle wave V must complete as a five structure, which should look clear at the weekly chart level. It may only be an impulse or ending diagonal. At this stage, it is clear it is an impulse.
Within cycle wave V, the third waves at all degrees may only subdivide as impulses.
Intermediate wave (4) has breached an Elliott channel drawn using Elliott’s first technique. The channel is redrawn using Elliott’s second technique. The upper edge may provide resistance for intermediate wave (5).
Intermediate wave (4) may not move into intermediate wave (1) price territory below 2,193.81. At this stage, it now looks like intermediate wave (4) may be continuing further sideways as a combination or triangle. These two ideas are today separated into two separate daily charts. They are judged to have an even probability at this stage.
A double zigzag would also be possible for intermediate wave (4), but because intermediate wave (2) was a double zigzag this is the least likely structure for intermediate wave (4) to be. Alternation should be expected until price proves otherwise.
DAILY CHART – TRIANGLE
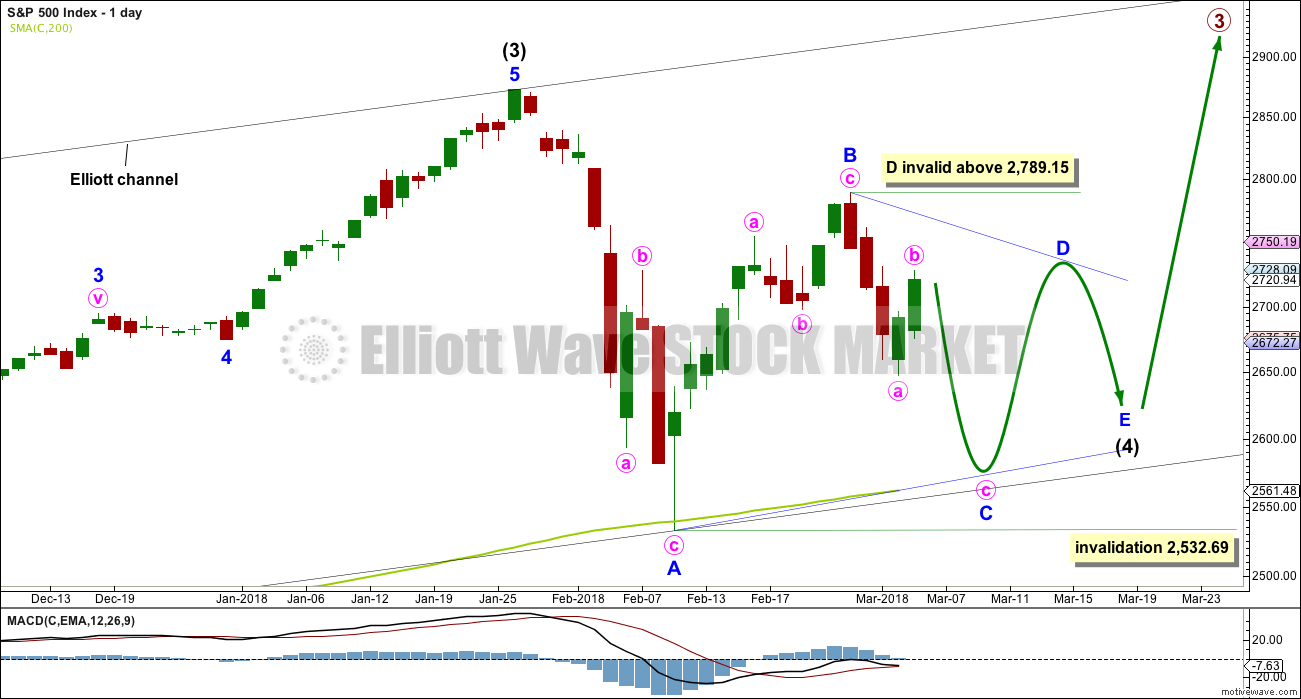
This first daily chart looks at the possibility that intermediate wave (4) may be continuing sideways as a regular contracting or regular barrier triangle.
Four of the five sub-waves within a triangle must subdivide as zigzags. One sub-wave may be a more complicated multiple, most often this is wave C.
Minor wave C may not move beyond the end of minor wave A below 2,532.69.
A common length for triangle sub-waves is from 0.8 to 0.85 of the prior sub-wave. This gives a target range of 2,584 – 2,571 for minor wave C downwards.
Minor wave D of a contracting triangle may not move beyond the end of minor wave B above 2,789.15. Minor wave D of a barrier triangle may end about the same level as minor wave B so that the B-D trend line remains essentially flat. In practice this means that minor wave D may end slightly above 2,789.15. This invalidation point is not black and white.
Thereafter, minor wave E may not move beyond the end of minor wave C.
A triangle may continue to find support about the 200 day moving average, possibly with small overshoots.
An expanding triangle will not be considered because they are extremely rare structures. I have never seen one in my now 10 years of daily Elliott wave analysis, and so we should not expect this to be a first.
DAILY CHART – COMBINATION
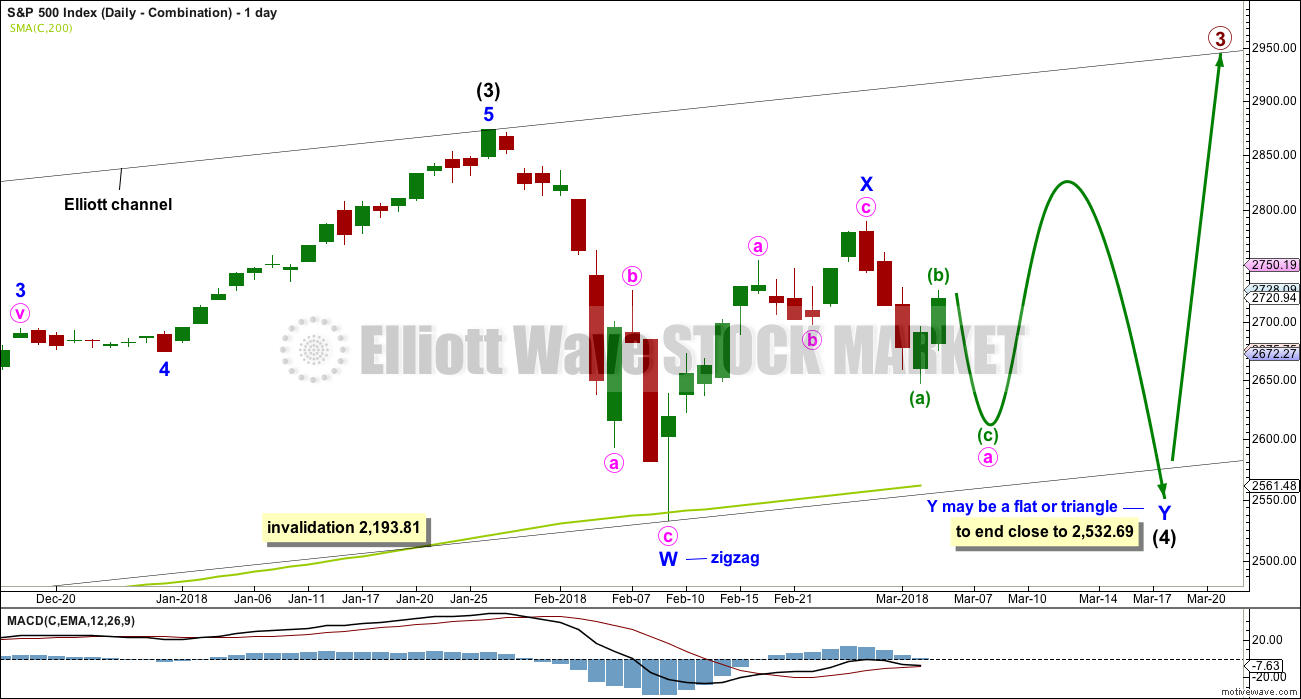
Double combinations are very common structures. The first structure in a possible double combination for intermediate wave (4) would be a complete zigzag labelled minor wave W. The double would be joined by a complete three in the opposite direction, a zigzag labelled minor wave X.
The second structure in the double would most likely be a flat correction labelled minor wave Y. It may also be a triangle, but in my experience this is very rare.
A flat correction would subdivide 3-3-5. Minute wave a must be a three wave structure, most likely a zigzag.
The purpose of combinations is to take up time and move price sideways. To achieve this purpose the second structure in the double usually ends close to the same level as the first. Minor wave Y would be expected to end about the same level as minor wave W at 2,532.69. This would require a strong overshoot or breach of the 200 day moving average.
At this stage, both wave counts expect a zigzag downwards to be unfolding. The degree of labelling would be different, but the structure would be the same. One hourly chart at this time will suffice for both daily wave counts.
HOURLY CHART
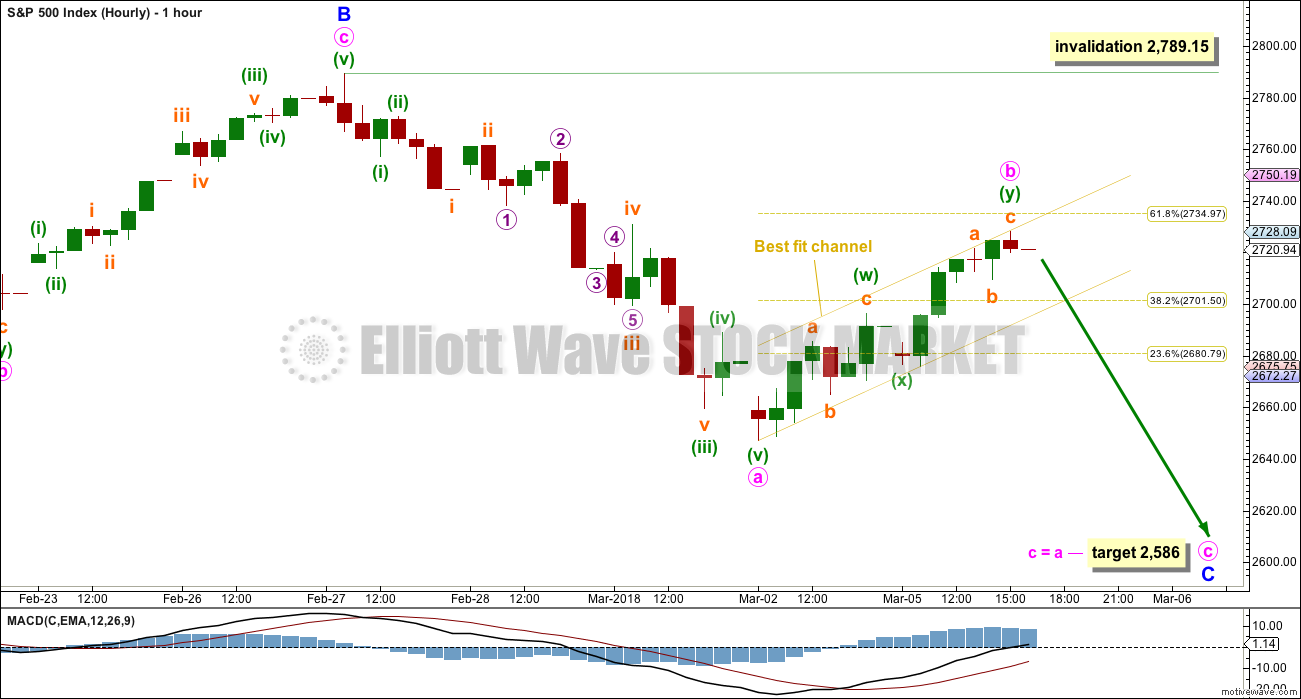
Both daily wave counts expect a zigzag is unfolding lower. The triangle wave count sees it as minor wave C. The combination wave count sees it as minute wave a. The degree of labelling on this hourly chart fits the triangle wave count. It would be labelled one degree lower for the combination wave count.
Minute wave b may now be a complete double zigzag. If it moves higher tomorrow, then the 0.618 Fibonacci ratio at 2,735 would be a reasonable target for it to end.
If minute wave b is over here, then a target may be calculated for minute wave c to exhibit the most common Fibonacci ratio to minute wave a. If minute wave b moves any higher tomorrow, then this target must also move correspondingly higher. At this point, it is just above the target zone shown on the daily chart.
The best fit channel contains all of minute wave b. When this channel is breached by downwards movement (not sideways), it shall then indicate a trend change and the start of minute wave c downwards. Minute wave c may last about two to four sessions. If it lasts four sessions, then minor wave C may total a Fibonacci eight sessions.
TECHNICAL ANALYSIS
WEEKLY CHART
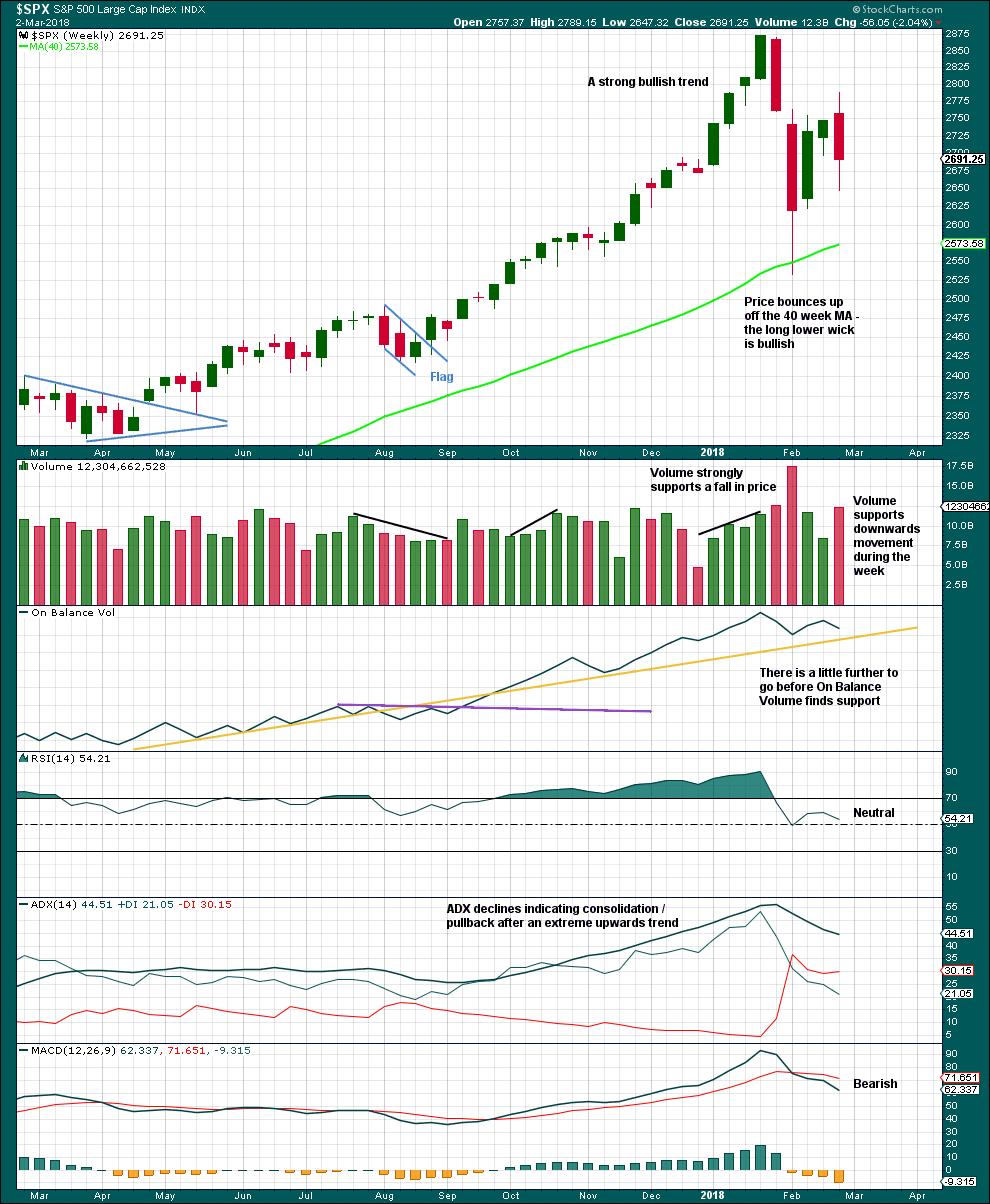
Click chart to enlarge. Chart courtesy of StockCharts.com.
This consolidation is bringing ADX down from very extreme and RSI from extremely overbought. There will again be room for a trend to develop when it is complete.
Short term volume suggests downwards movement is incomplete. Support on On Balance Volume may assist to halt a fall in price along with the 40 week (200 day) moving average.
DAILY CHART
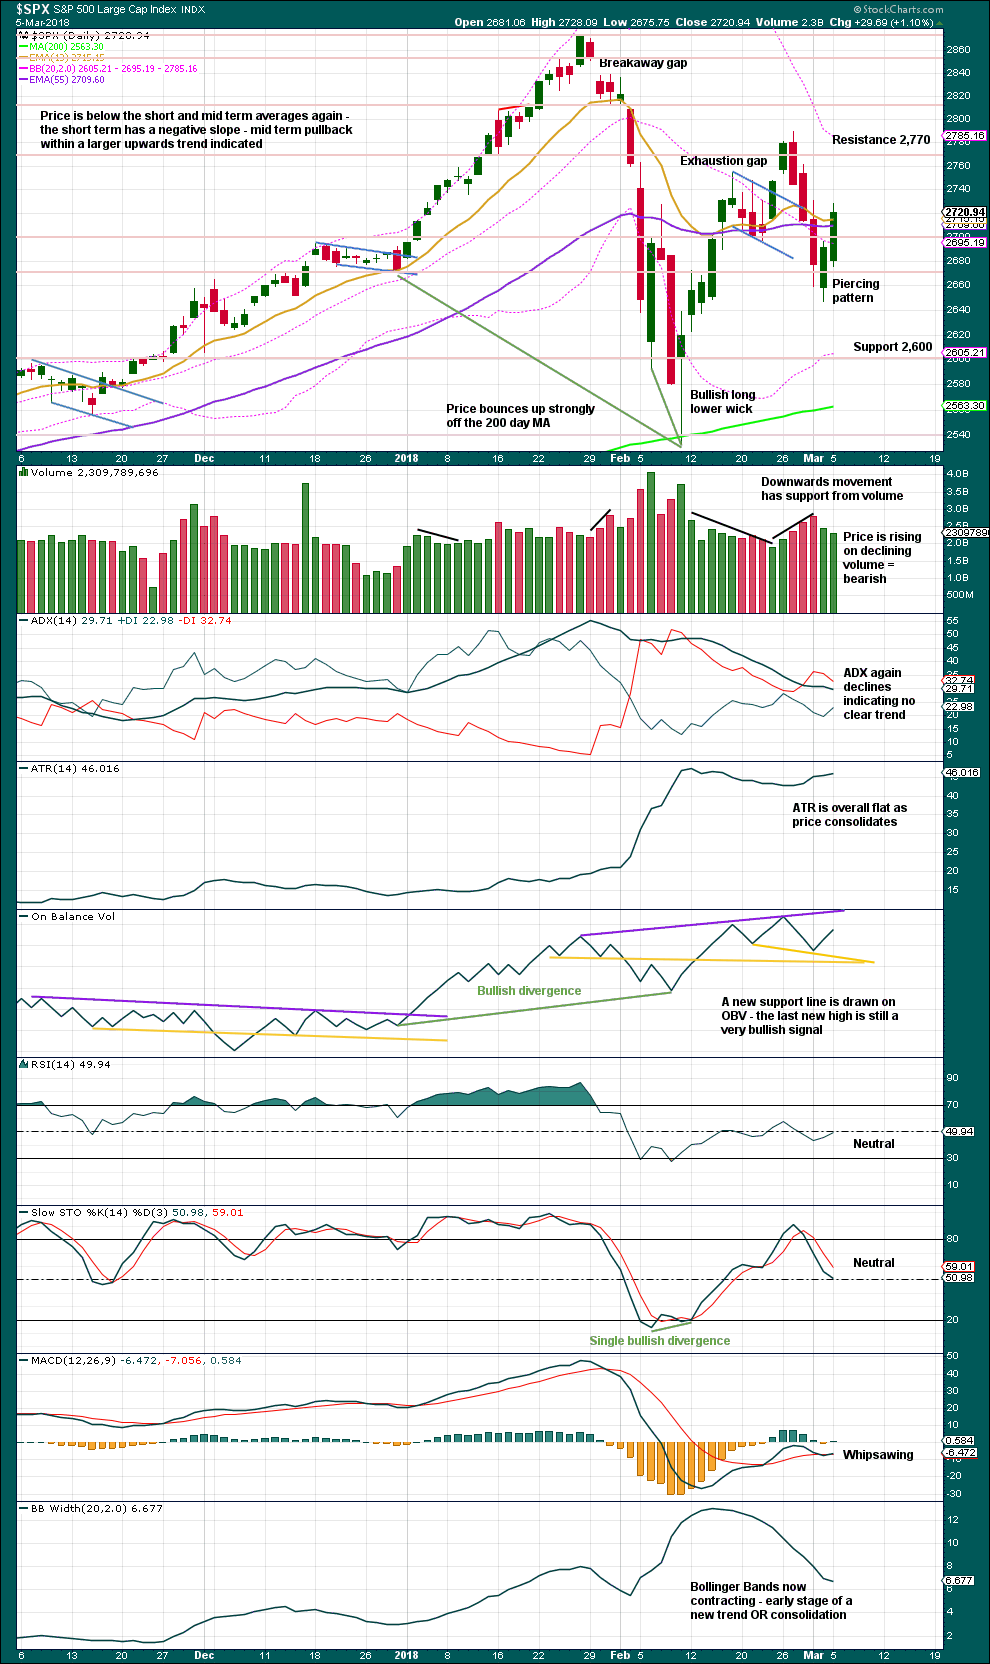
Click chart to enlarge. Chart courtesy of StockCharts.com.
The short term volume profile supports the Elliott wave count.
VOLATILITY – INVERTED VIX CHART
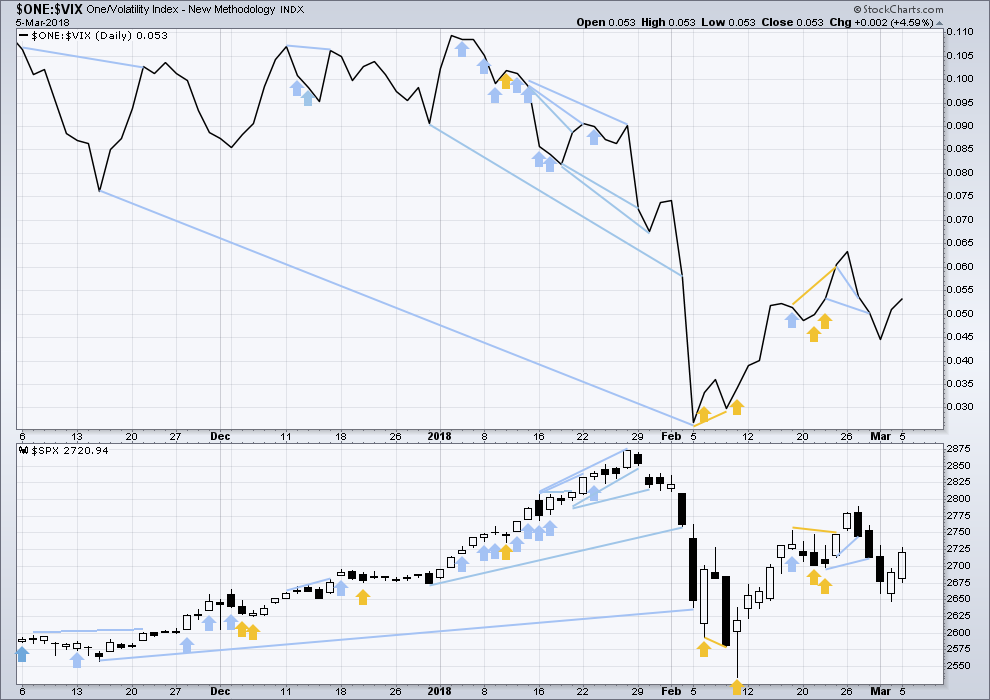
Click chart to enlarge. Chart courtesy of StockCharts.com.
So that colour blind members are included, bearish signals will be noted with blue and bullish signals with yellow.
Normally, volatility should decline as price moves higher and increase as price moves lower. This means that normally inverted VIX should move in the same direction as price.
Upwards movement during Monday’s session has a normal corresponding decline in market volatility. This is bullish.
BREADTH – AD LINE
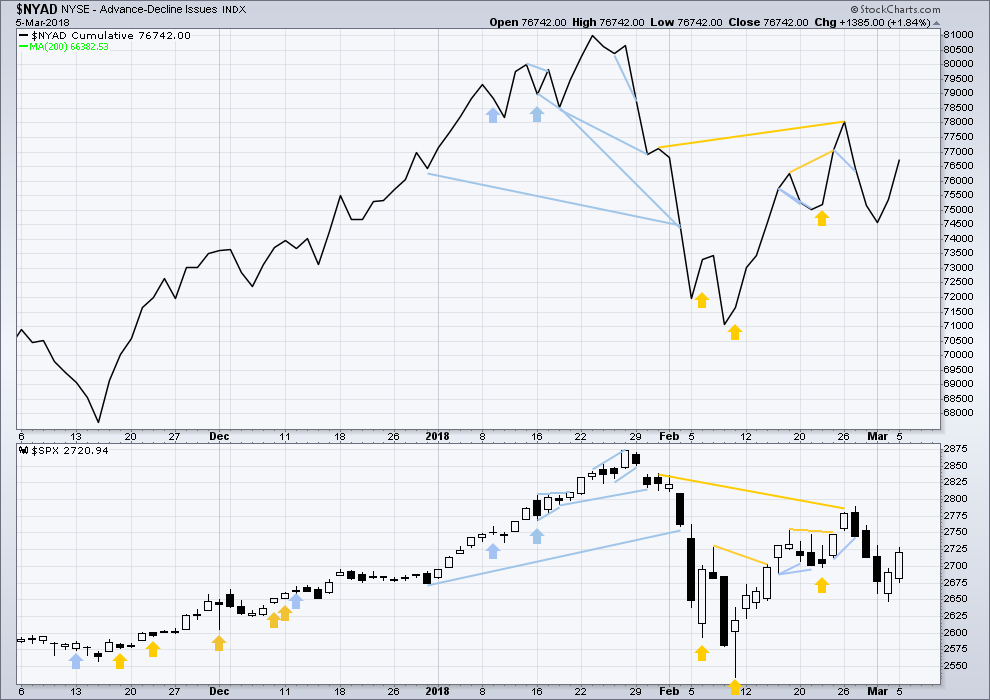
Click chart to enlarge. Chart courtesy of StockCharts.com.
There is normally 4-6 months divergence between price and market breadth prior to a full fledged bear market. This has been so for all major bear markets within the last 90 odd years. With no longer term divergence yet at this point, any decline in price should be expected to be a pullback within an ongoing bull market and not necessarily the start of a bear market.
All of small, mid and large caps last week completed an outside week. All sectors of the market at this time appear to be in a consolidation.
Breadth should be read as a leading indicator.
Upwards movement during Monday’s session comes with support from an increase in market breadth. This is bullish.
DOW THEORY
All indices have made new all time highs as recently as six weeks ago, confirming the ongoing bull market.
The following lows need to be exceeded for Dow Theory to confirm the end of the bull market and a change to a bear market:
DJIA: 17,883.56.
DJT: 7,039.41.
S&P500: 2,083.79.
Nasdaq: 5,034.41.
Charts showing each prior major swing low used for Dow Theory are here.
Published @ 06:55 p.m. EST.

That C wave showed up after hours…yabba dabba doo! Patience is a virtue…and sometimes rewarded!
My apologies to all for being tardy today.
First opportunity to surf in over 2 weeks and my soul really needed it. Now have my zen back.
Did ES really GAP down ?
Yes
Gary Cohen Resigned
Gary Cohn resigning as White House Economic Council Director over dispute with Trump on tariffs. ES futures gap down at the open to 2700 and then trade down.
pretty clear triangle in NDX now (2 day variety), entered from below…that’s pretty bullish. If it starts breaking to the upside, a major short squeeze could fire off very quickly here.
My trend indicator on 5 minute bars has moved from UP through neutral to DOWN, or DOWN through neutral to UP, SEVEN TIMES TODAY. So far. It’s psychotic. Churning at the top??
Yup… the kind of day that can pick your pocket!
It’s a monster coil dude. Big move coming. Beware head fakes!
Have a great evening everyone.
Entered from below.
Still volatile as all get out but today it’s back and forth instead of a steady march in one direction. Is that C wave down coming…or not??? Anytime is fine….
Hi Kevin
Do you think the C is still coming?
Or i saw your chart yesterday do you really think that this is a D wave?
Thanks
Chuckling here…best advice: don’t listen to me.
Yes I think C is coming. I have a short. I suspect there’s going to be one last headfake/short squeeze coming, any moment now, that will push price up to abour 2750, where it will meet the descending channel line (the “big” one off the ATH). And that will turn the market. The movement down is either C of an ABC as charted by Lara, or an E wave of a symmetric triangle with a very short C wave. Which will be decided by how far down it goes. If it pushes deep, Lara’s description is right (and I think this is the most likely scenario). If it’s shallow, it could complete an E wave and we’ve got a completed 4th wave triangle.
I note that NDX overall double topped, and price is now pushing up close to that top zone. The kind of place where it often rolls over and dies often on such a “3rd attempt”.
Of course, the market could just go from here to the moon too. Anything’s possible, as the world around us demonstrates. “Stranger than fiction” indeed.
Oh no!!!
Gartman….again!!! 🙁
Well…even a broken clock is correct twice a day!
Gartman is Short… Going Up for sure!
spx squeezing for last 30 minutes on 5 minute chart
strong indications it’s going to resolve to the downward side….
I think one more run at 50 day…
think Oil may have just turned?!
Are we hunting wabbit today?
We have an exhaustion gap….
Third defiant gap higher in VIX…
Can anyone translate this into English for me? Thanks……
Is anyone else seeing VIX stuck at 17.99???!! What the….####:%£€!!
HaHa. I guess since the attempted smash of the first pre-market gap up failed to do the trick, they decided to take another swing at it. What are they going to do when the people going long vol are not just traders but leveraged longs needing protection?
Well, there you have it…pre-market gap higher in VIX…..rats! 🙂
It appears other traders intetested in going long vol. VIX might not offer another sub 18 entry at the open as I was expecting. If it does, it will be short lived I would wager…
DAX may have resumed downtrend. In sideways coil after initial move down. Looking for same pattern in US indices…
A long upper wick that tags the 50 day would be exquisite!
Adding vol to lower cost basis.
Under 18 is the new ” cheap”.
Rodney, welcome back to the NEW spx. With >1% moves every day. A few days up, a few days down, like high speed gondolas in the Alps, with a drunk operator at the controls.
Yes I have noticed a 30 + point day is no longer necessarily a big day. Interesting. Volatility has returned meaningfully in both directions.
I’m back ……..
And I am first today. How about that.
Finally recovering from jet lag and the stressors of traveling cross county in the USA. I did not catch the flu that I know of so that alone is good news. Glad to be back home and able to read the blog.
Welcome back Doc!
Howzabout some tasty cawot?
My friend, have you ever had a furry psychologist or psychiatrist analyze the gregarious personality you have displayed in these pictorial exhibitions? You are all hare but may not be all there! (he – he)
He’s not furry Doc! 🙂
LOL
Brilliant Rodney
Welcome back