More downwards movement was expected. This is how the session began with a new low.
Summary: A bounce to either 2,701 or 2,735 may continue on Monday. It could be over within Monday’s session, or it could take a few days with choppy and sideways movement. When the bounce is done, another downwards wave may unfold towards 2,585 – 2,571.
Always practice good risk management. Always trade with stops and invest only 1-5% of equity on any one trade.
The biggest picture, Grand Super Cycle analysis, is here.
Last historic analysis with monthly charts is here. Video is here.
An alternate idea at the monthly chart level is given here at the end of this analysis.
An historic example of a cycle degree fifth wave is given at the end of the analysis here.
MAIN ELLIOTT WAVE COUNT
WEEKLY CHART
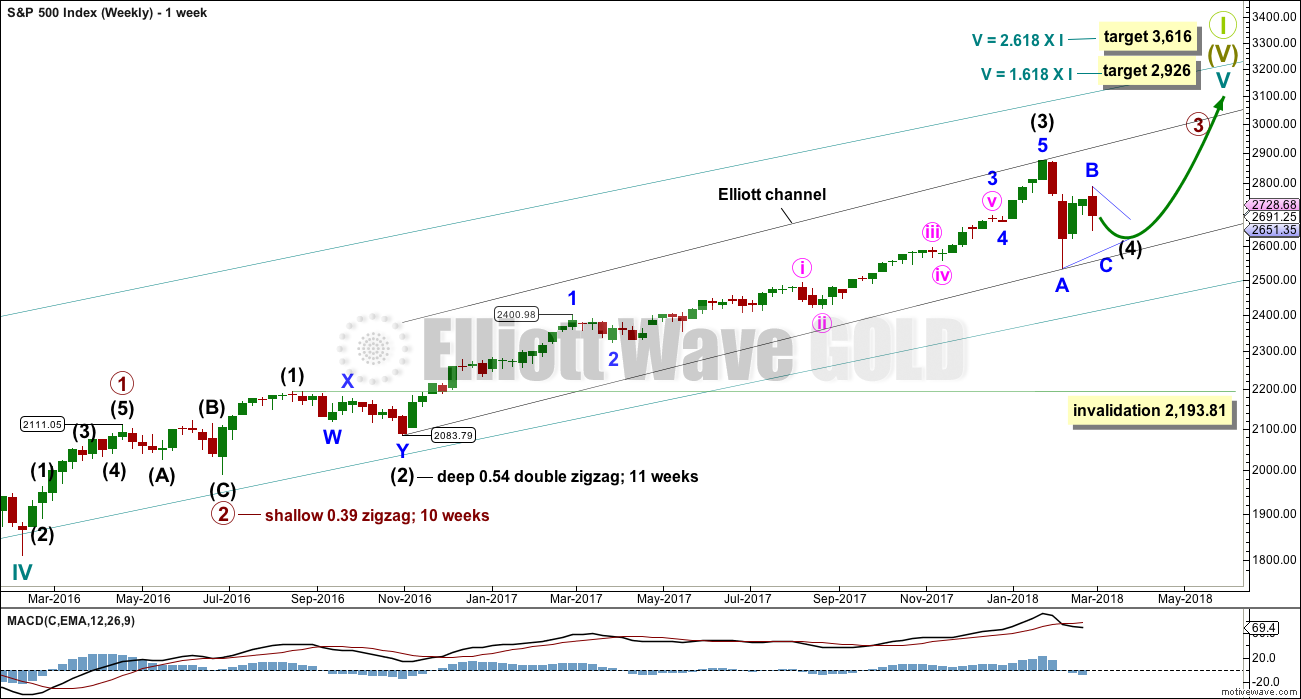
Cycle wave V must complete as a five structure, which should look clear at the weekly chart level. It may only be an impulse or ending diagonal. At this stage, it is clear it is an impulse.
Within cycle wave V, the third waves at all degrees may only subdivide as impulses.
Intermediate wave (4) has breached an Elliott channel drawn using Elliott’s first technique. The channel is redrawn using Elliott’s second technique. The upper edge may provide resistance for intermediate wave (5).
Intermediate wave (4) may not move into intermediate wave (1) price territory below 2,193.81. At this stage, it now looks like intermediate wave (4) may be continuing further sideways as a combination or triangle. These two ideas are today separated into two separate daily charts. They are judged to have an even probability at this stage.
A double zigzag would also be possible for intermediate wave (4), but because intermediate wave (2) was a double zigzag this is the least likely structure for intermediate wave (4) to be. Alternation should be expected until price proves otherwise.
DAILY CHART – TRIANGLE
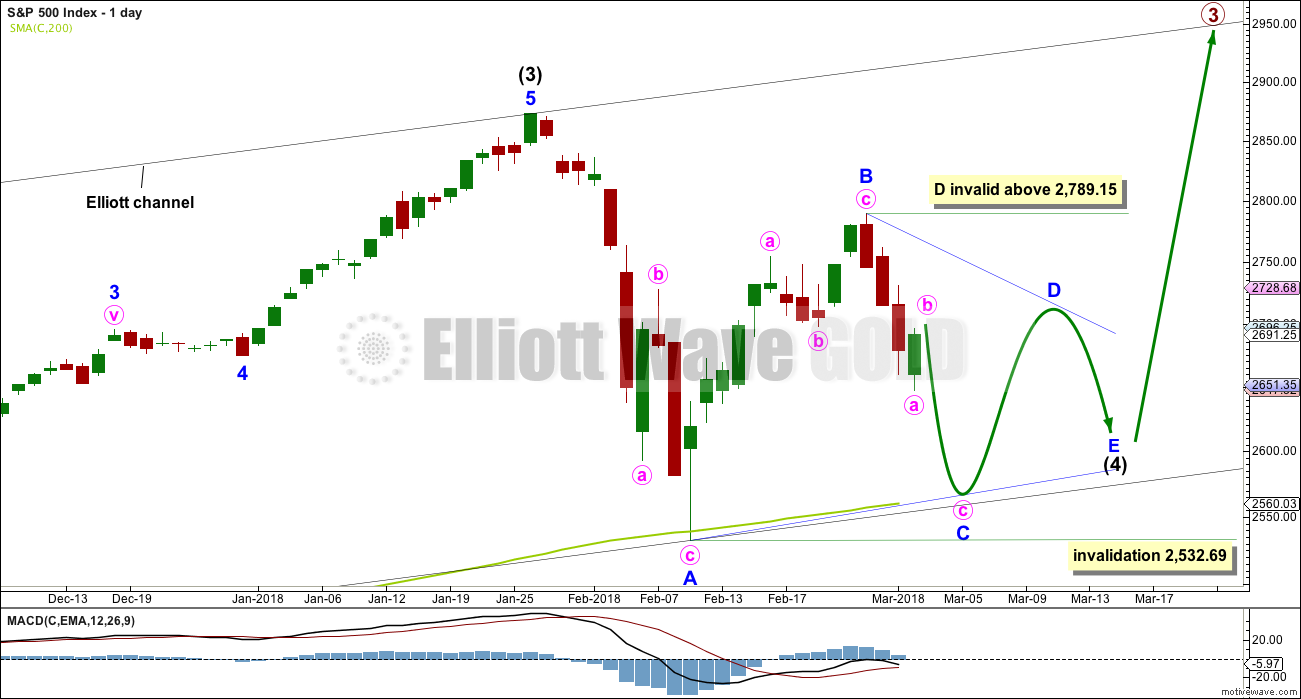
This first daily chart looks at the possibility that intermediate wave (4) may be continuing sideways as a regular contracting or regular barrier triangle.
Four of the five sub-waves within a triangle must subdivide as zigzags. One sub-wave may be a more complicated multiple, most often this is wave C.
Minor wave C may not move beyond the end of minor wave A below 2,532.69.
A common length for triangle sub-waves is from 0.8 to 0.85 of the prior sub-wave. This gives a target range of 2,584 – 2,571 for minor wave C downwards.
Minor wave D of a contracting triangle may not move beyond the end of minor wave B above 2,789.15. Minor wave D of a barrier triangle may end about the same level as minor wave B so that the B-D trend line remains essentially flat. In practice this means that minor wave D may end slightly above 2,789.15. This invalidation point is not black and white.
Thereafter, minor wave E may not move beyond the end of minor wave C.
A triangle may continue to find support about the 200 day moving average, possibly with small overshoots.
An expanding triangle will not be considered because they are extremely rare structures. I have never seen one in my now 10 years of daily Elliott wave analysis, and so we should not expect this to be a first.
DAILY CHART – COMBINATION
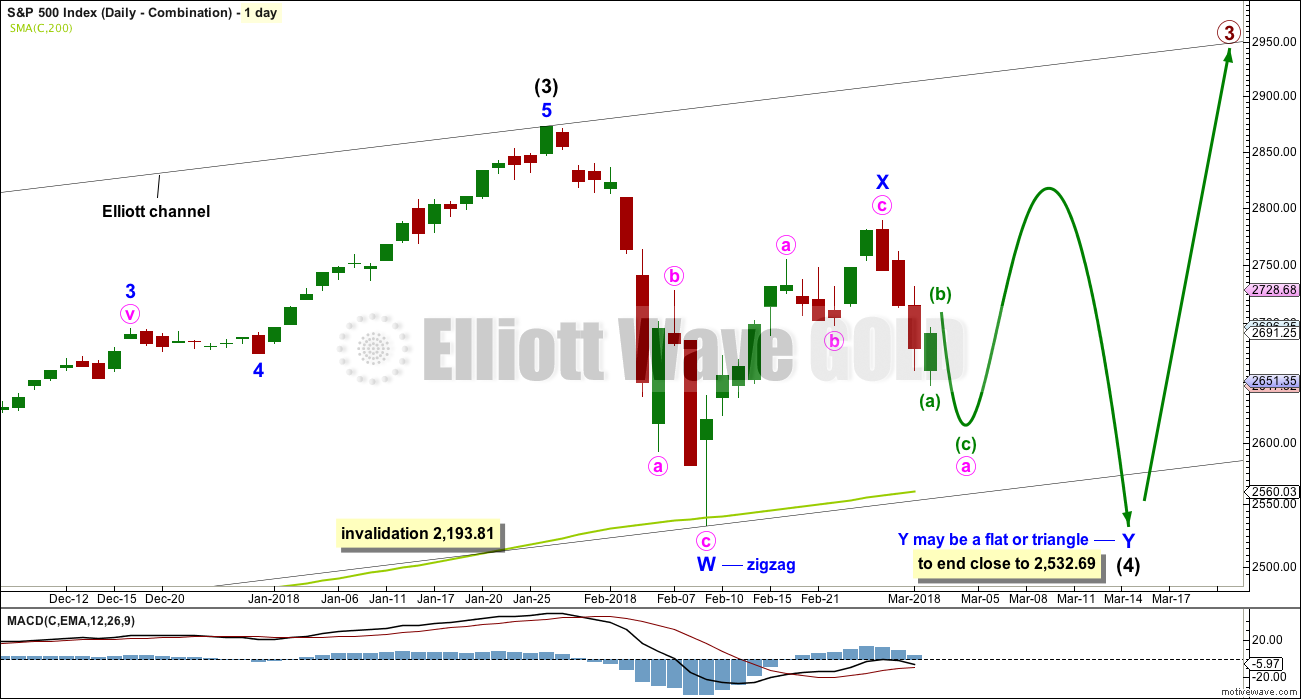
Double combinations are very common structures. The first structure in a possible double combination for intermediate wave (4) would be a complete zigzag labelled minor wave W. The double would be joined by a complete three in the opposite direction, a zigzag labelled minor wave X.
The second structure in the double would most likely be a flat correction labelled minor wave Y. It may also be a triangle, but in my experience this is very rare.
A flat correction would subdivide 3-3-5. Minute wave a must be a three wave structure, most likely a zigzag.
The purpose of combinations is to take up time and move price sideways. To achieve this purpose the second structure in the double usually ends close to the same level as the first. Minor wave Y would be expected to end about the same level as minor wave W at 2,532.69. This would require a strong overshoot or breach of the 200 day moving average.
At this stage, both wave counts expect a zigzag downwards to be unfolding. The degree of labelling would be different, but the structure would be the same. One hourly chart at this time will suffice for both daily wave counts.
HOURLY CHART
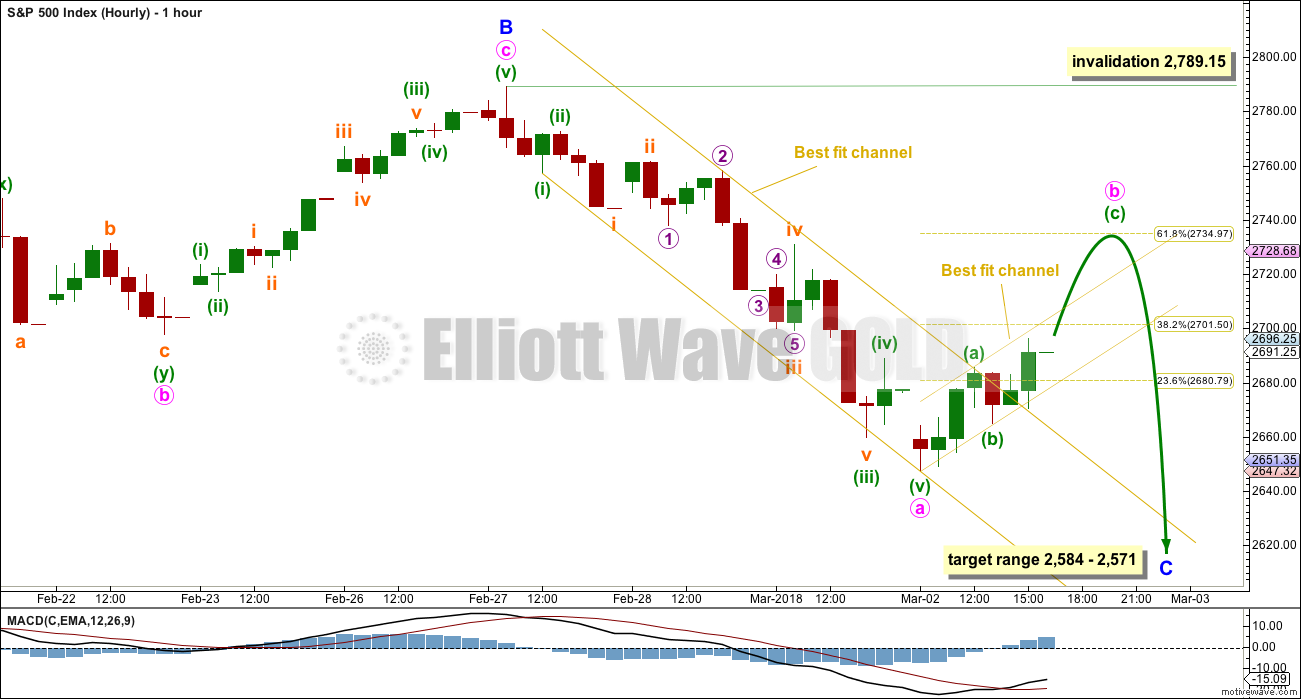
Both daily wave counts expect a zigzag is unfolding lower. The triangle wave count sees it as minor wave C. The combination wave count sees it as minute wave a. The degree of labelling on this hourly chart fits the triangle wave count. It would be labelled one degree lower for the combination wave count.
A strong breach of the downwards, sloping, yellow best fit channel by the end of Friday’s session indicates the downwards wave labelled minute wave a should be over and now minute wave b should be underway. Minute wave b may end either about the 0.382 or 0.618 Fibonacci ratios of minute wave a. It may be over early on Monday, or it may continue sideways for a few days.
This wave count now expects price may be within a B wave within a correction. B waves exhibit the greatest variety in structure and price behaviour. They present the worst trading opportunities.
When minute wave b is complete, then minute wave c downwards should unfold towards the target zone. When minute wave b is complete, then a target may be calculated for minute wave c downwards by using the Fibonacci ratio between minute waves a and c.
TECHNICAL ANALYSIS
WEEKLY CHART
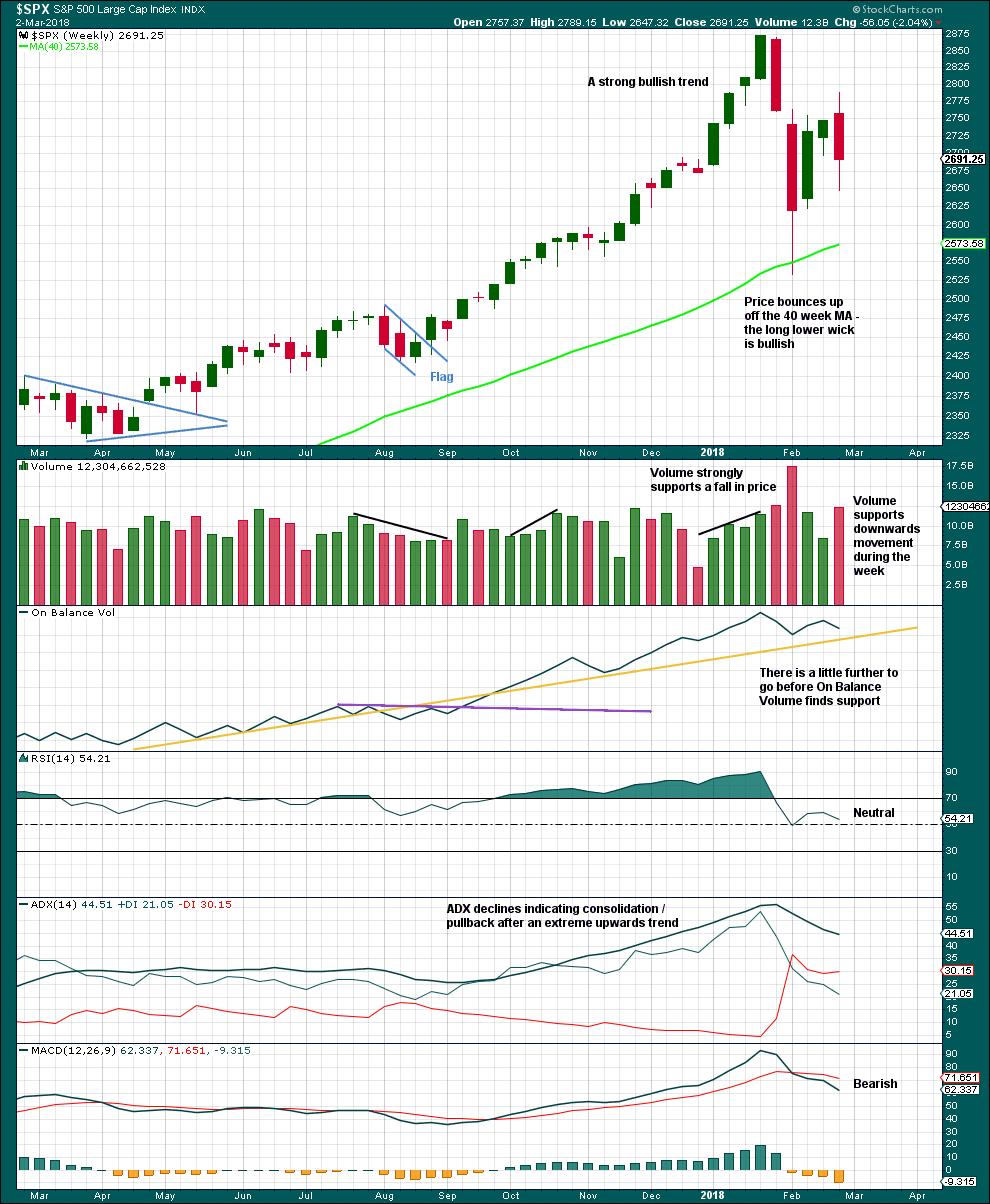
Click chart to enlarge. Chart courtesy of StockCharts.com.
This consolidation is bringing ADX down from very extreme and RSI from extremely overbought. There will again be room for a trend to develop when it is complete.
Short term volume suggests downwards movement is incomplete. Support on On Balance Volume may assist to halt a fall in price along with the 40 week (200 day) moving average.
DAILY CHART
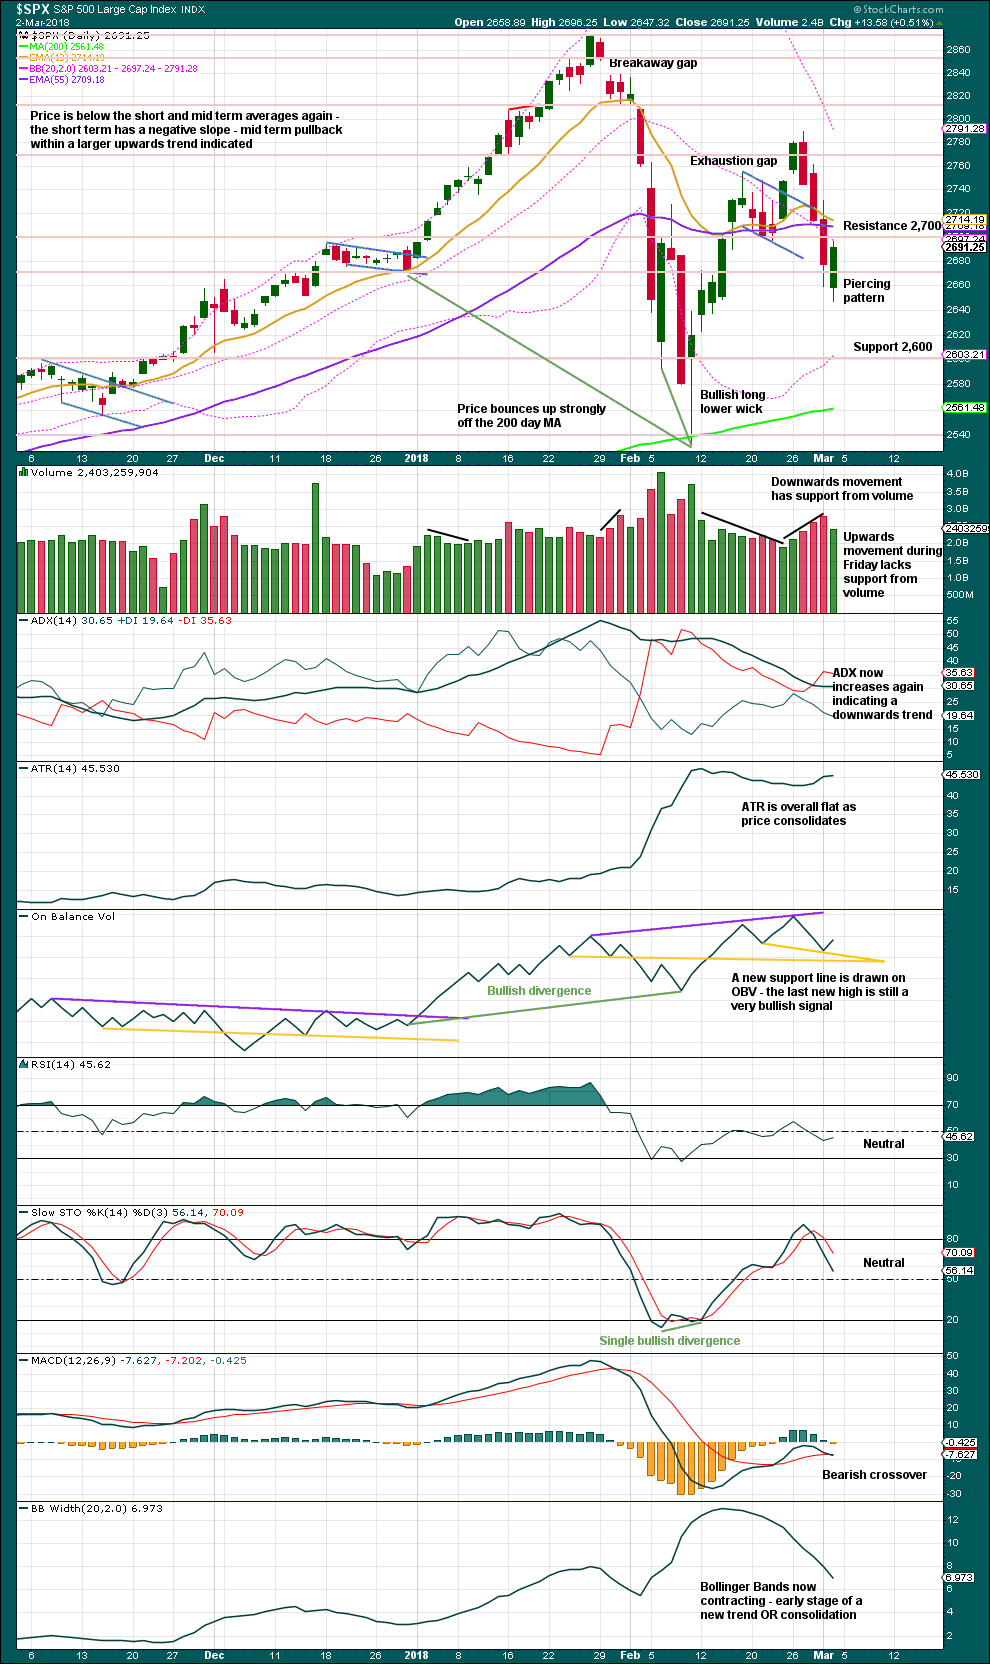
Click chart to enlarge. Chart courtesy of StockCharts.com.
The bullish Piercing pattern suggests more upwards movement on Monday. However, a lack of support from volume suggests it may be short lived. This supports the Elliott wave count which sees this bounce as a B wave.
VOLATILITY – INVERTED VIX CHART
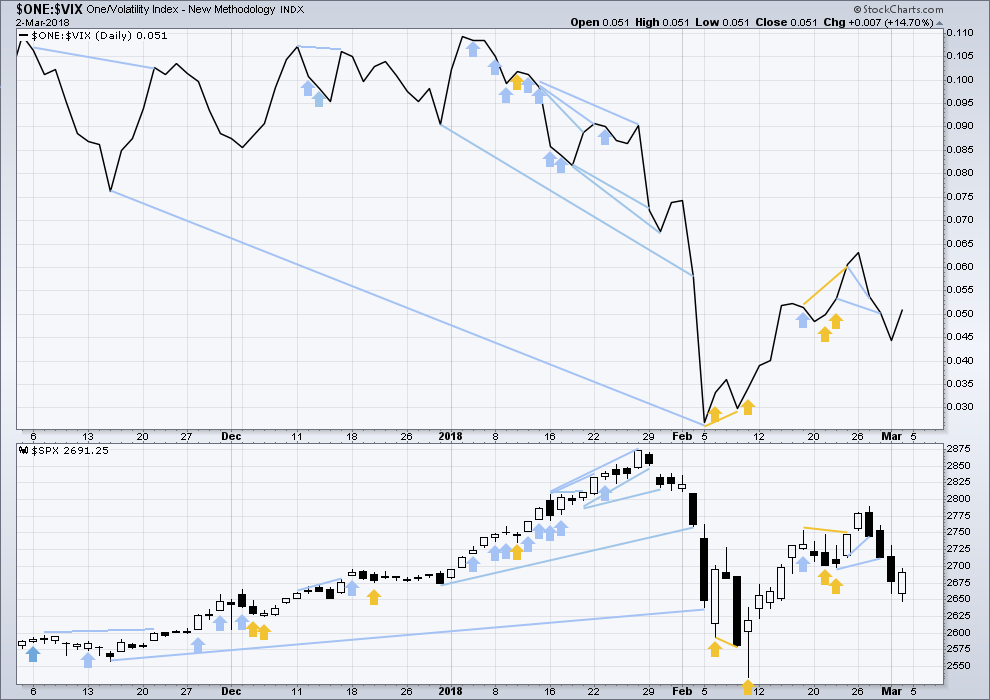
Click chart to enlarge. Chart courtesy of StockCharts.com.
So that colour blind members are included, bearish signals will be noted with blue and bullish signals with yellow.
Normally, volatility should decline as price moves higher and increase as price moves lower. This means that normally inverted VIX should move in the same direction as price.
Upwards movement during Friday’s session has a normal corresponding decline in market volatility. This is bullish.
BREADTH – AD LINE
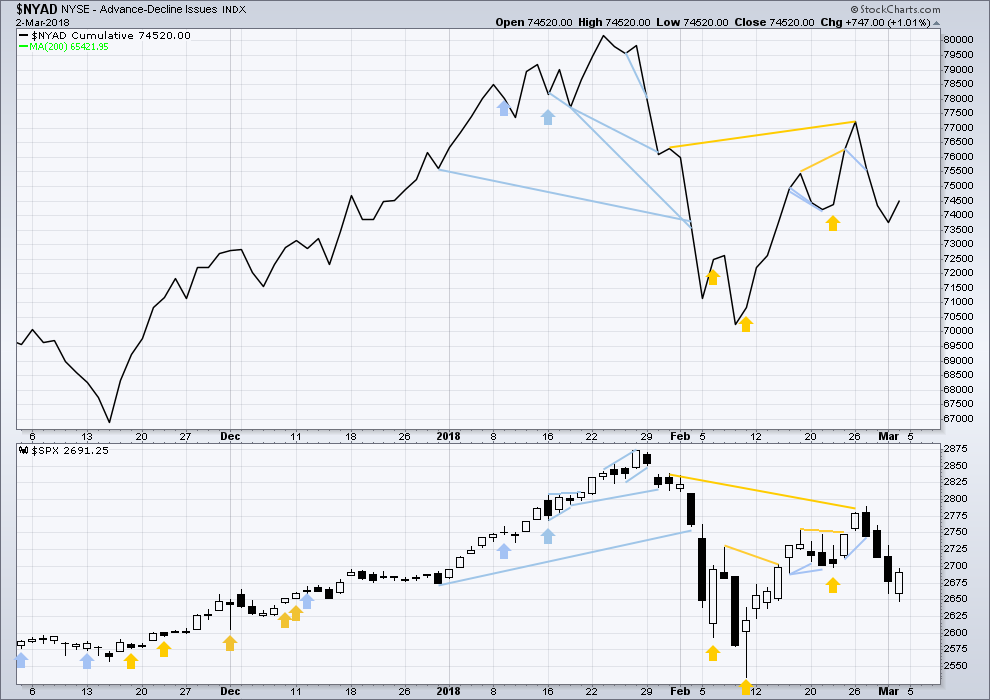
Click chart to enlarge. Chart courtesy of StockCharts.com.
There is normally 4-6 months divergence between price and market breadth prior to a full fledged bear market. This has been so for all major bear markets within the last 90 odd years. With no longer term divergence yet at this point, any decline in price should be expected to be a pullback within an ongoing bull market and not necessarily the start of a bear market.
All of small, mid and large caps this week completed an outside week. All sectors of the market at this time appear to be in a consolidation.
Breadth should be read as a leading indicator.
Upwards movement during Friday’s session comes with support from an increase in market breadth. This is bullish.
DOW THEORY
All indices have made new all time highs as recently as six weeks ago, confirming the ongoing bull market.
The following lows need to be exceeded for Dow Theory to confirm the end of the bull market and a change to a bear market:
DJIA: 17,883.56.
DJT: 7,039.41.
S&P500: 2,083.79.
Nasdaq: 5,034.41.
Charts showing each prior major swing low used for Dow Theory are here.
Published @ 08:52 p.m. EST.

Capture of 2720 opens the door for a move up to 2740. Keep and eye on futures. If we are going there futures will lead the way. We will most certainly tag the underside of the 50 day around 2736 prior to a turn. Have a great evening all!
Verne, VIX calls in the green already….hmmm
Yep! After that third dip below 18.00 I could not pass up the opportunity. Grabbed a fistful of VIX 20 strike calls expiring next week for 1.00 even….
What about the possibility that legs A, B, and C are complete in this emerging triangle, and this push up is leg D.
There are two 62% fibos looming overhead, the 62% of the recent downmove around 2734, and 62% of the entire crash move around 2742.5.
C looks a bit small to my eyes…. 🙂
It generally has a lot more ooomph….even for a contracting triangle….
i agree, it’s unlikely.
Hourly update:
A double zigzag to end about 0.618 of the last wave down?
Lets see how the session ends for volume. If it’s weak then that’d fit a B wave. If it’s strong then I’d expect another upwards day.
Lara, what is the reason you don’t view 50% fibo levels as significant?
Good morning fearless (and fearsome!) leader!
Hope you had a restful and relaxing week-end! 🙂
I really like it. It will serve nicely to dislodge the early eager beavers…BUT NOT US!!
He! He!
Notice the nice divergence with vol on this last ramp up ladies and bundlemen! 🙂
Aaahh…Yes! SPX 2720
Visions of Gandalf on the bridge of Khazad-dum….
“You…shall…not…PASS!!!” 🙂
I can just see the bears now: “What??? You again??!!!”
Opening “stink bid” to buy March 14 20 strike calls for limit price of 0.50. GTC.
Here is hoping we see yet another Wed morning “anomalous” downward spike…wink, wink! 🙂
Are we done?? Let’s get some VIX confirmation….Thank You! 🙂
Hi Lara
What do you consider weak Volume?
For example 10% below the daily average?
What Percentage below the 3 month average would you consider weak volume?
Thank You
Hi Lara
What do you consider weak Volume?
For example 10% below the daily average?
What Percentage below the 3 month average would you consider weak volume?
FED came in huge at exactly 11:03am Lara, so that might skew volume a bit, although its trailed ever since.
Get ready for the typical “shake the trees” manuever…these guys can be truly vicious! 🙂
Any opinions about (or suggestions for “better” alternatives to) PCN for parking cash to earn some regular dividend income? PCN is in a 13 week squeeze on the weekly, pays about 8%, and the last time it squeezed like that (early 2016) it proceeded to go up about 15% very quickly. I like the set up and am thinking of pushing some of my otherwise idle cash into it the moment I see my weekly trend indicator move from neutral to up. Any other suggestions for best ways to “park” cash for relatively low risk profits?
CCT, a BDC run by KKR trading at a massive discount to NAV (Disclaimer: Not trading advice) I think you’ll dig it Kevin.
TY and Cheers, Chris!
welcome bro
Hi Kevin
How is PCN able to pay such a high Dividend?
Thank You
VIX double bottom around 18 even?
The big A wave down had a very nice skinny doji for the small b wave up ahead of the dive. It took the entire session to form…deja vu all over again?! 🙂
Looks like the bears putting the kibosh on the party at 2720. Look for another last gasp cash dump before the bulls get hammered…
The spike up out of the current coil should be violently reversed….
I’m trying short here. Probably dooms it. We’ll see…
Good for you Kevin, welcome to the party….hopefully you don’t pull the Gartman curse on us 🙂
“He who must not be named…!!!” 😀
“Something wicked, this way comes..!” 🙂
If we get a green VIX print today, back up the truck…!
I believe this actually sets up more downside than if they let it fall 500 today. Taking out a decent size in the money bear put spread on QQQ April expiration.
Indeed. Their idiocy knows no bounds…! 🙂
The narrowness of the advance in tech is absolutely stunning. Something fishy is going on there as the leaders are already rolling over…I suspect we could see a heart-stopping downside gap…
Yes, indeed. I opened a very risky April bear straddle on NFLX as I had too due multiple negative divergences, and I have a feeling I’ll wish I did it larger. It’s already up 10% somehow.
Nice! 🙂
NFLX is going to make a lot of bears who get the right timing a lot of moo-lah…!
Pushback at 2720…will they ramp it past….? 🙂
Buying back 271 puts. Positioned nicely at Mr Markets kind expense. If we move past 2720 will sell 272 puts. Watching for now….
We could see a brief spike to 2720…50 day remains the short term key I suspect…
They cannot even get JNK, perennial market bellweather, to participate in the fraud with a single green candle lol!
I have been noticing that a great “tell” on upward movement topping is that my short puts quickly flip from green to red…very few false flags so I don’t mind going under water for a bit before buying back to ensure we have a turn.
Widening spread. Cashing in 270, selling 271. Close to zero cost basis for being long puts. I think the next dive will rattle quite a few cages…
We could go higher but I am taking the money on SPY 270 calls.
Still holding bull SPY 269/270 bull put spread for long upper wick to manifest.
Look for the long upper wick to once again signal the next downside move. This could go on for a few days until Wednesday when the “rip off sloppy traders with the VIX ambush spike down” usually shows up. You would think traders would have figured this out by now.
I guess more traders need to open massive stink bids Tuesday evening to make them pay for this subterfuge…! 😉
I’m now re-loading VOL Verne
What a gift!! 🙂
Market seems to be idling time until the sell off starts in a few hours. We’ll see.
Yep. After the head-fake. 😉
To the 38% fibo and general resistance at 2700-2702, yea most likely.
I timed my exit last Thursday well in UUP. Reentered first thing this morn, taking another shot there.
Probably higher…
Man the futures ramp at 3am was silly….but also par for the course
Hope, (and connivance) springs eternal…they are dumping cash on the DAX…a thimbleful on an inferno…
Number Uno again:)
Doncha just love weekends Doc?