The new main Elliott wave count expected another downwards day, which is exactly what has happened.
Summary: Expect overall downwards movement to continue to about 2,584 – 2,571. Price may find support about the 200 day moving average.
Always practice good risk management. Always trade with stops and invest only 1-5% of equity on any one trade.
The biggest picture, Grand Super Cycle analysis, is here.
Last historic analysis with monthly charts is here. Video is here.
An alternate idea at the monthly chart level is given here at the end of this analysis.
An historic example of a cycle degree fifth wave is given at the end of the analysis here.
MAIN ELLIOTT WAVE COUNT
WEEKLY CHART
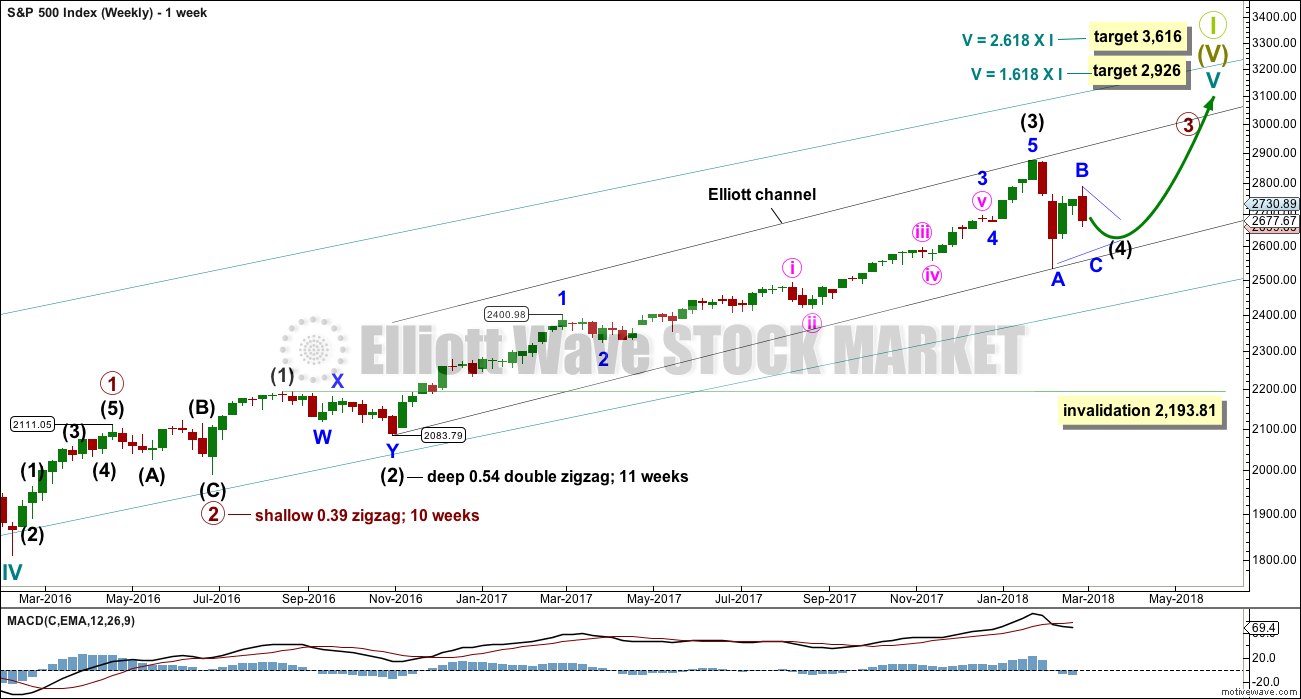
Cycle wave V must complete as a five structure, which should look clear at the weekly chart level. It may only be an impulse or ending diagonal. At this stage, it is clear it is an impulse.
Within cycle wave V, the third waves at all degrees may only subdivide as impulses.
Intermediate wave (4) has breached an Elliott channel drawn using Elliott’s first technique. The channel is redrawn using Elliott’s second technique. The upper edge may provide resistance for intermediate wave (5).
Intermediate wave (4) may not move into intermediate wave (1) price territory below 2,193.81. At this stage, it now looks like intermediate wave (4) may be continuing further sideways as a combination or triangle. These two ideas are today separated into two separate daily charts. They are judged to have an even probability at this stage.
A double zigzag would also be possible for intermediate wave (4), but because intermediate wave (2) was a double zigzag this is the least likely structure for intermediate wave (4) to be. Alternation should be expected until price proves otherwise.
DAILY CHART – TRIANGLE
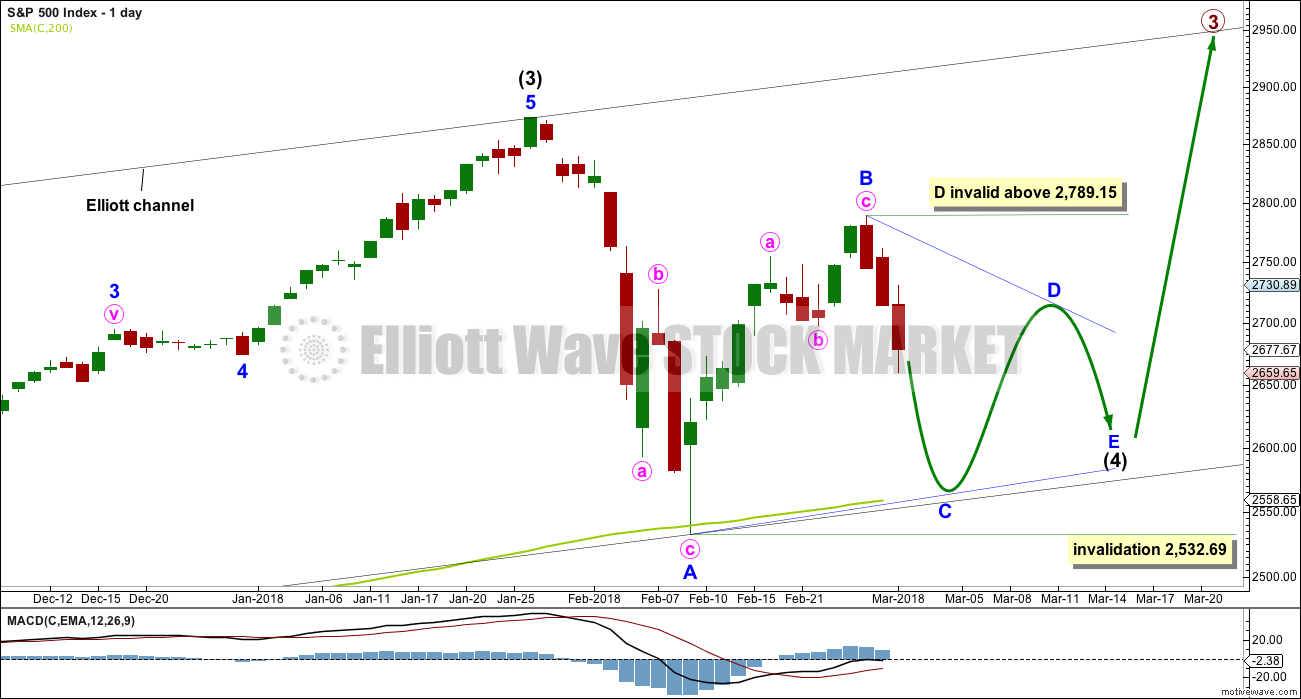
This first daily chart looks at the possibility that intermediate wave (4) may be continuing sideways as a regular contracting or regular barrier triangle.
Four of the five sub-waves within a triangle must subdivide as zigzags. One sub-wave may be a more complicated multiple, most often this is wave C.
Minor wave C may not move beyond the end of minor wave A below 2,532.69.
A common length for triangle sub-waves is from 0.8 to 0.85 of the prior sub-wave. This gives a target range of 2,584 – 2,571 for minor wave C downwards.
Minor wave D of a contracting triangle may not move beyond the end of minor wave B above 2,789.15. Minor wave D of a barrier triangle may end about the same level as minor wave B so that the B-D trend line remains essentially flat. In practice this means that minor wave D may end slightly above 2,789.15. This invalidation point is not black and white.
Thereafter, minor wave E may not move beyond the end of minor wave C.
A triangle may continue to find support about the 200 day moving average, possibly with small overshoots.
An expanding triangle will not be considered because they are extremely rare structures. I have never seen one in my now 10 years of daily Elliott wave analysis, and so we should not expect this to be a first.
DAILY CHART – COMBINATION
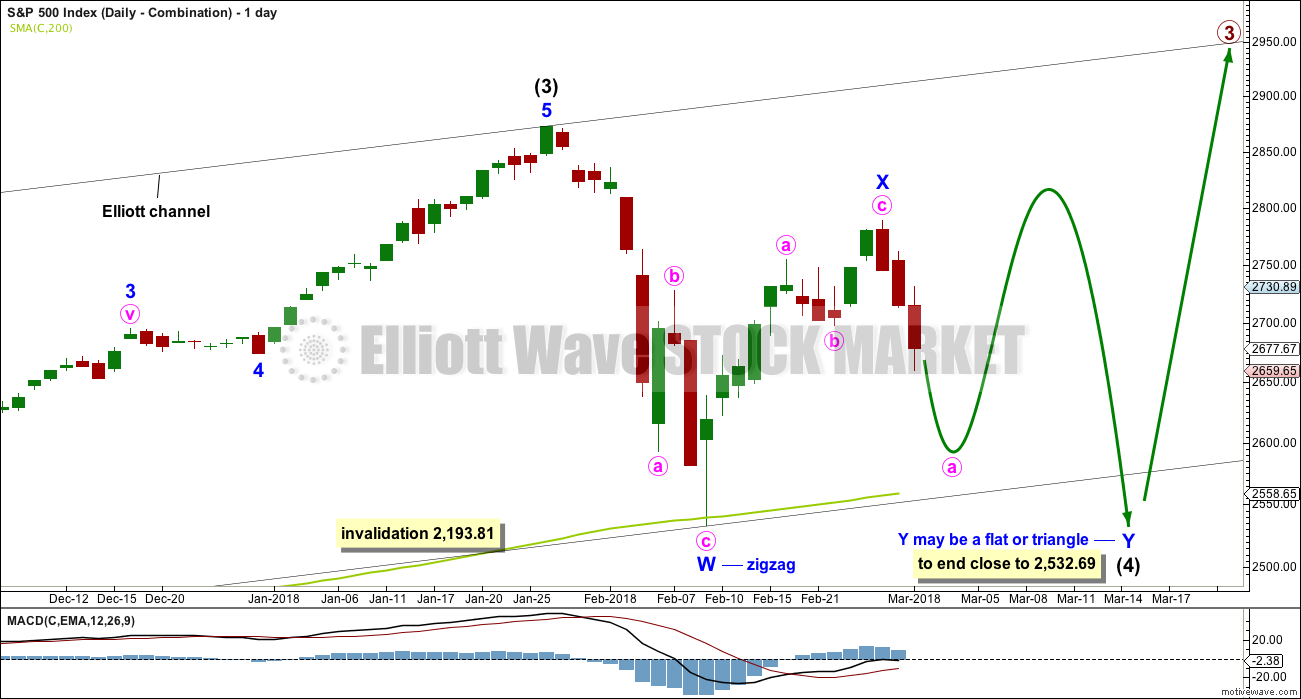
Double combinations are very common structures. The first structure in a possible double combination for intermediate wave (4) would be a complete zigzag labelled minor wave W. The double would be joined by a complete three in the opposite direction, a zigzag labelled minor wave X.
The second structure in the double would most likely be a flat correction labelled minor wave Y. It may also be a triangle, but in my experience this is very rare.
A flat correction would subdivide 3-3-5. Minute wave a must be a three wave structure, most likely a zigzag.
The purpose of combinations is to take up time and move price sideways. To achieve this purpose the second structure in the double usually ends close to the same level as the first. Minor wave Y would be expected to end about the same level as minor wave W at 2,532.69. This would require a strong overshoot or breach of the 200 day moving average.
At this stage, both wave counts expect a zigzag downwards to be unfolding. The degree of labelling would be different, but the structure would be the same. One hourly chart at this time will suffice for both daily wave counts.
HOURLY CHART
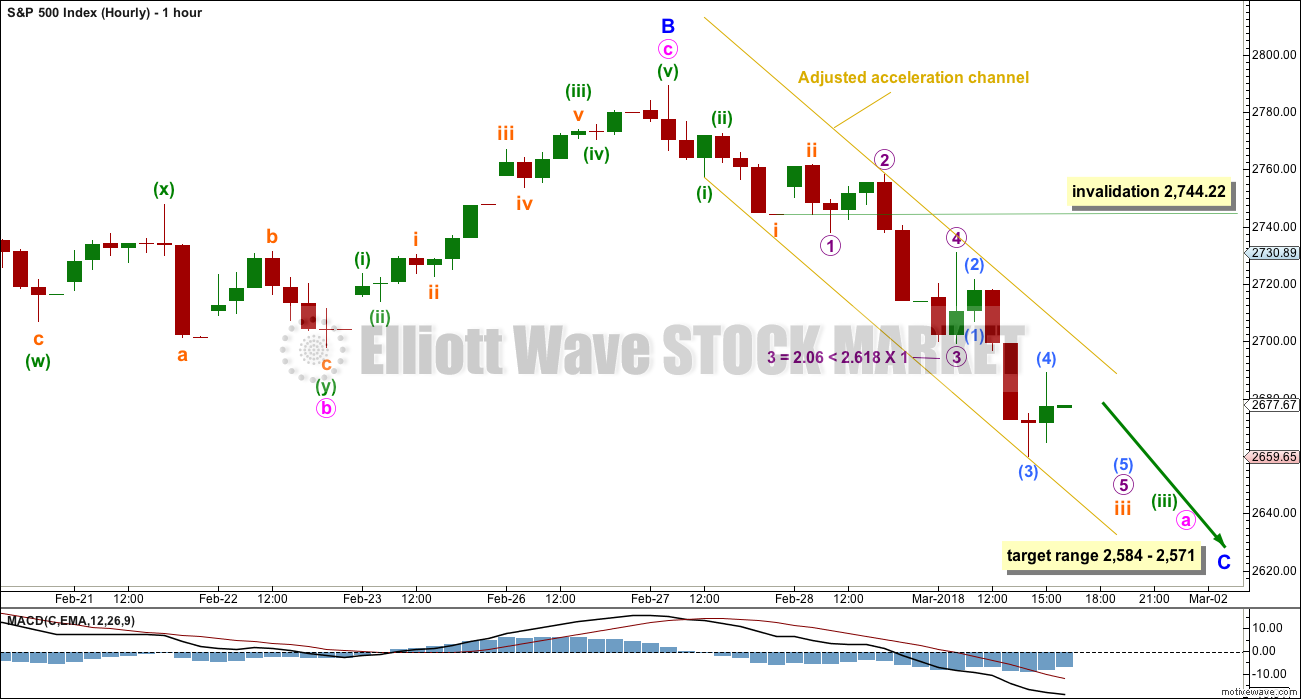
Both daily wave counts expect a zigzag is unfolding lower. The triangle wave count sees it as minor wave C. The combination wave count sees it as minute wave a. The degree of labelling on this hourly chart fits the triangle wave count. It would be labelled one degree lower for the combination wave count.
Minute wave a is an incomplete impulse within the zigzag unfolding lower. The adjusted acceleration channel is redrawn today. Keep redrawing it as price moves lower. Draw the first trend line from the low labelled minuette wave (i) to the last low, then place a parallel copy up on the high labelled micro wave 2 so that all downwards movement is contained. Expect price to continue falling while price remains within this channel. If and when this channel is breached by upwards movement (not sideways), that shall indicate minute wave a should be over and minute wave b should have begun.
Along the way down, to the target zone for minor wave C, a larger bounce for minute wave b would be expected. Do not expect price to move in a straight line.
Within minute wave a, the upcoming small correction for subminuette wave iv may not move into subminuette wave i price territory above 2,744.22.
TECHNICAL ANALYSIS
WEEKLY CHART
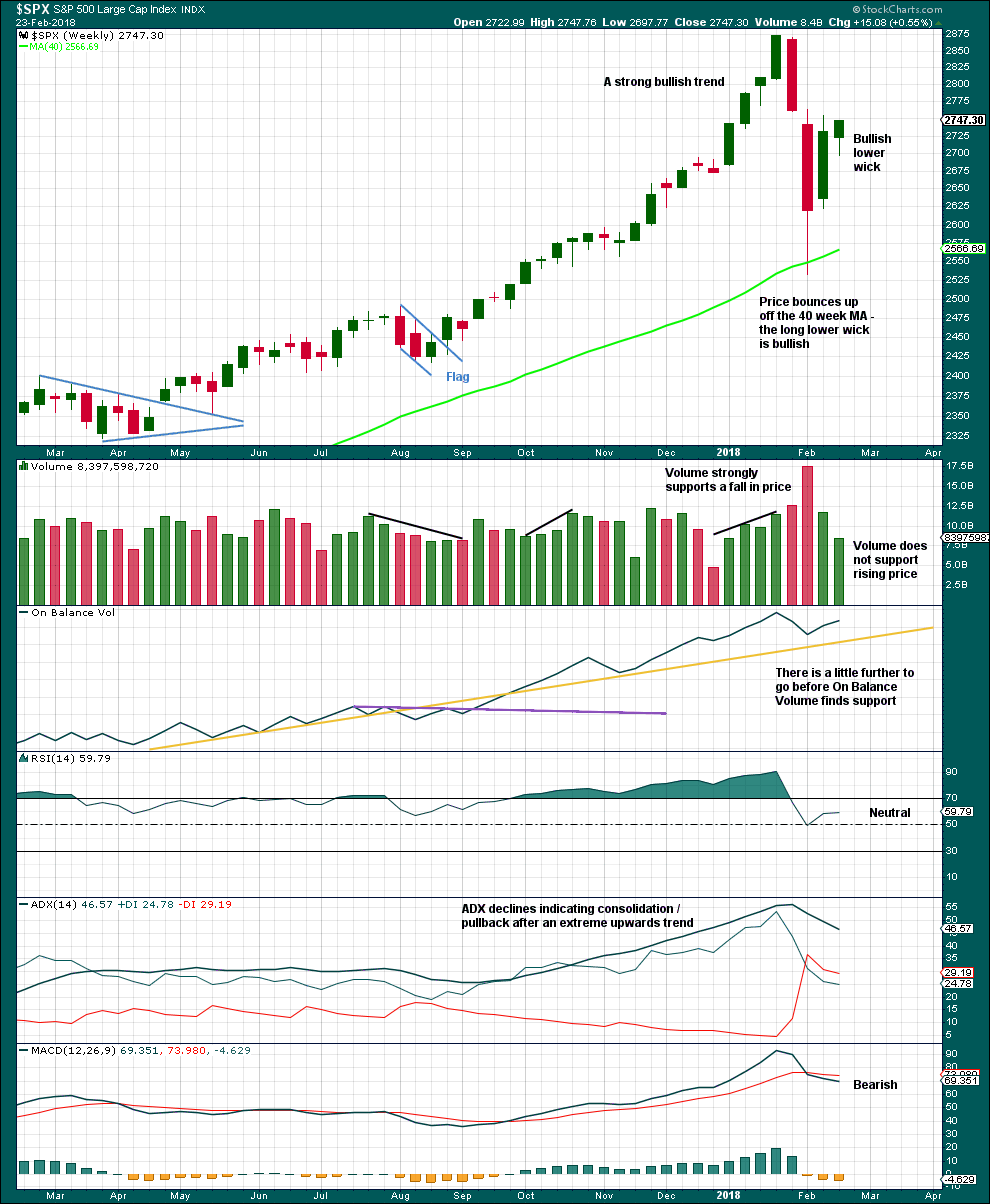
Click chart to enlarge. Chart courtesy of StockCharts.com.
Volume last week is much lower than the prior week, which is bearish.
The longer lower wick on the last weekly candlestick and the shaven head are bullish.
The pullback has brought ADX down from very extreme. A possible trend change to down is indicated, but as yet no new trend is indicated.
DAILY CHART
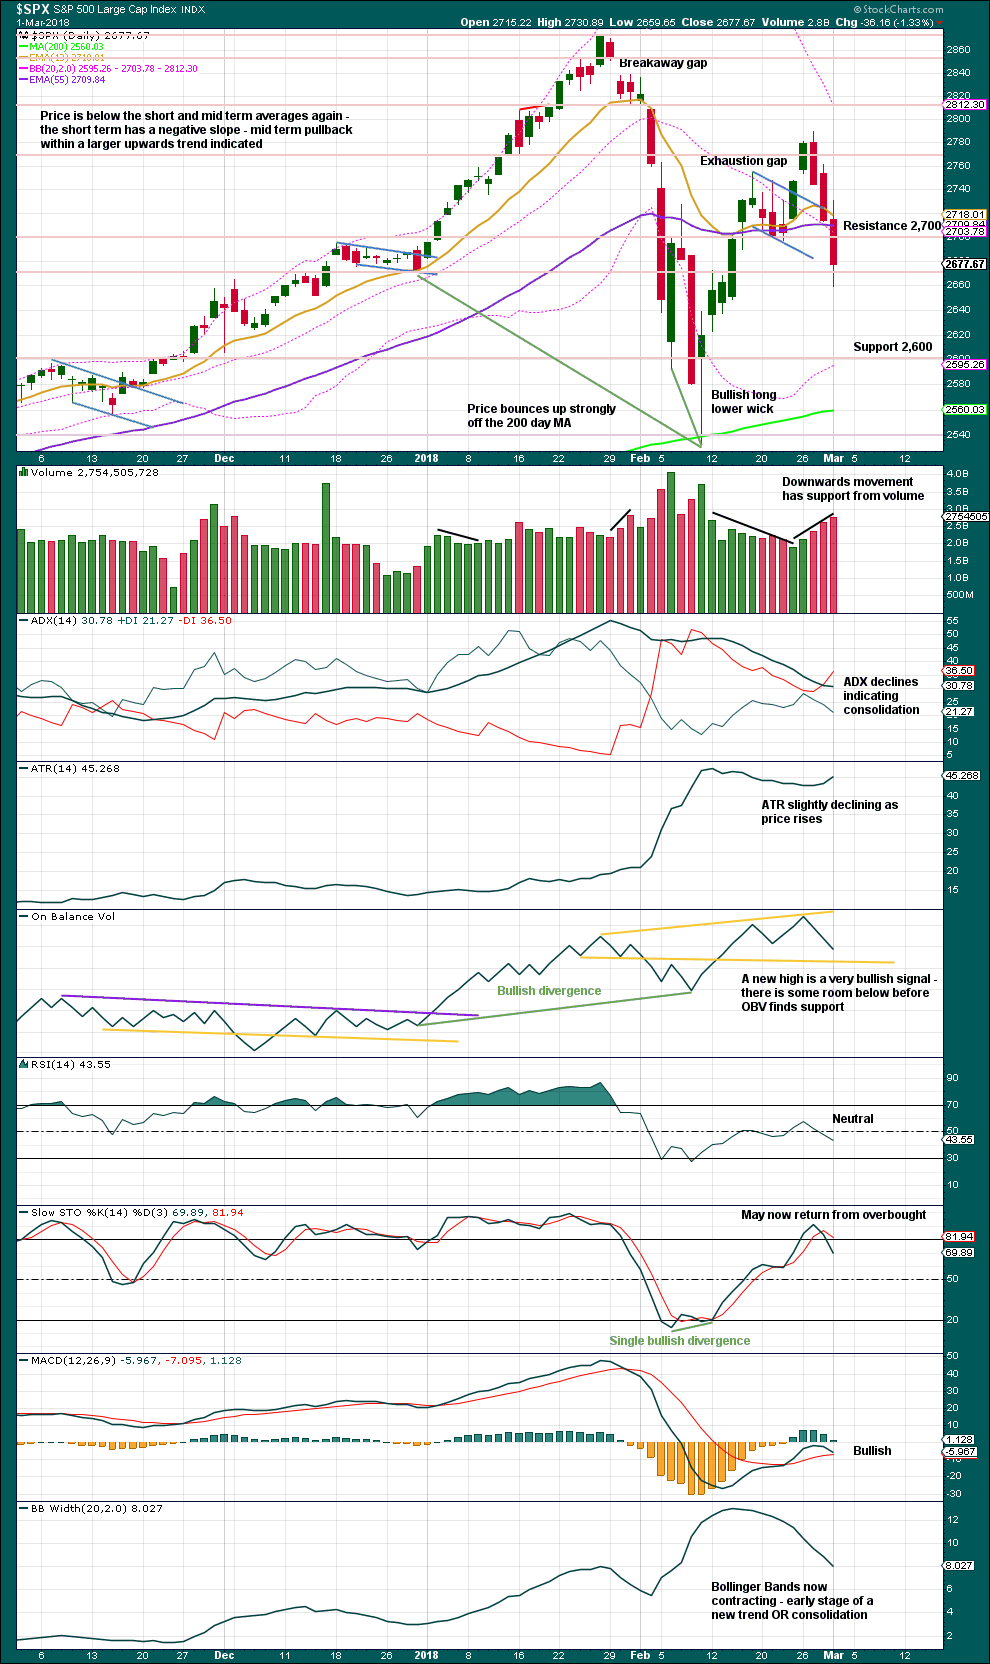
Click chart to enlarge. Chart courtesy of StockCharts.com.
Long lower and upper wicks on today’s candlestick is indecisive. This can be read as neither bullish nor bearish. The support from volume is bearish.
With RSI and Stochastics both neutral, there is plenty of room for price to fall. Support for On Balance Volume may halt the fall in price.
VOLATILITY – INVERTED VIX CHART
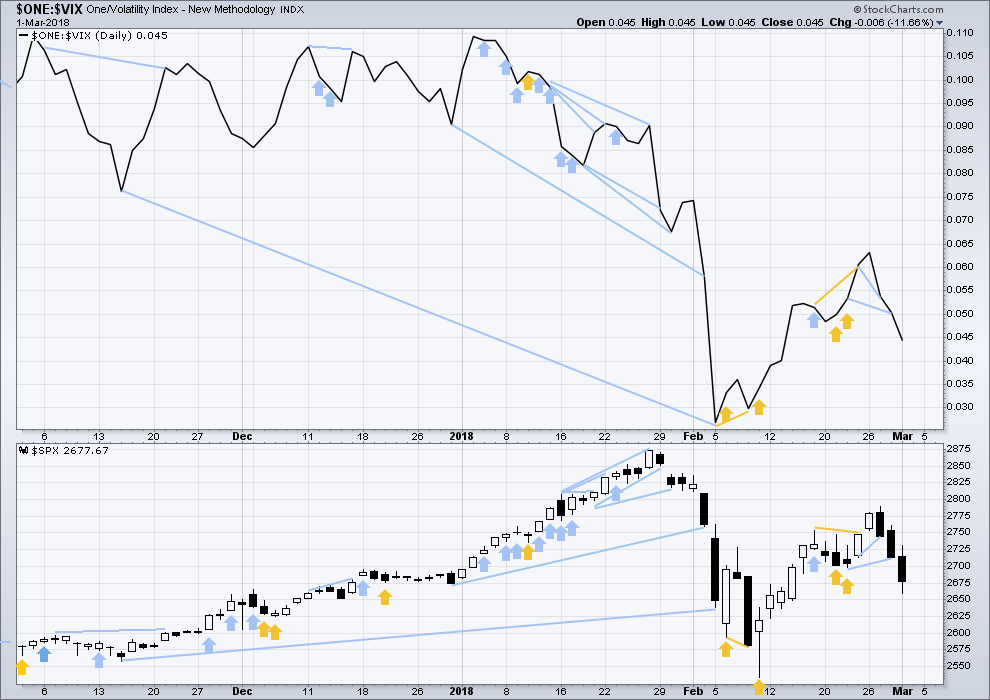
Click chart to enlarge. Chart courtesy of StockCharts.com.
So that colour blind members are included, bearish signals will be noted with blue and bullish signals with yellow.
Normally, volatility should decline as price moves higher and increase as price moves lower. This means that normally inverted VIX should move in the same direction as price.
Bearish divergence has now been followed by another downwards day. It may be resolved here, or it may need another downwards day to resolve it. The new lows for price today come with a corresponding increase in market volatility.
BREADTH – AD LINE
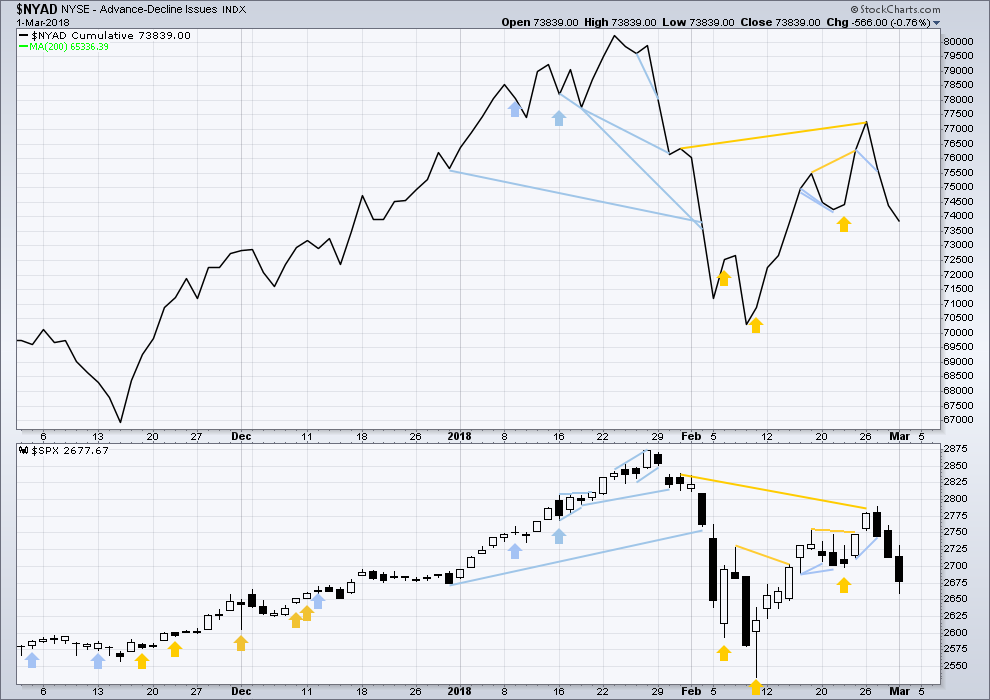
Click chart to enlarge. Chart courtesy of StockCharts.com.
There is normally 4-6 months divergence between price and market breadth prior to a full fledged bear market. This has been so for all major bear markets within the last 90 odd years. With no longer term divergence yet at this point, any decline in price should be expected to be a pullback within an ongoing bull market and not necessarily the start of a bear market.
All of small, mid and large caps last week moved upwards. The bounce has support from wide breadth.
Breadth should be read as a leading indicator.
Downwards movement today in price has support from declining market breadth. This is bearish.
DOW THEORY
All indices have made new all time highs as recently as five weeks ago, confirming the ongoing bull market.
The following lows need to be exceeded for Dow Theory to confirm the end of the bull market and a change to a bear market:
DJIA: 17,883.56.
DJT: 7,039.41.
S&P500: 2,083.79.
Nasdaq: 5,034.41.
Charts showing each prior major swing low used for Dow Theory are here.
Published @ 07:28 p.m. EST.

The breach of the channel indicates this may be possible:
but as you can see minuette (i) is a bit problematic. that looks like a three not a five
Hi Lara
Do you give this wave count a Low probability?
Like % odds do you give this alternative?
Thank You
With a very clear breach at the close of the session I’m going to have this as my only hourly wave count.
I have to say that was a sneaky end to the move down. I think you are right about the next move up being underway.
No fish in the barrel today?
Not as many as I thought! 🙂
My big miss of the day was getting a squeeze indication on SPX at the 5 minute level as price was rising and not immediately turning around my position and going long. Trade and learn and adapt!!!
Yep. A good remimder that you can never get complacent about price action. I will continue accumulating long vol on any move higher.
Is 4 over?
Not per Lara’s latest (below). I personally agree with her primary model(s). No sign of a 5 launching, and another (at least) leg down expected at some point here. And that in turn is probably just another leg of a larger 4 structure, as described well in last nights update. So it’s more 4, down, up, down, all around, most likely. Awful for investing. Tradeable, but challenging.
Note though that if SPX gets above the last swing high from yesterday (around 2690), that might kick start a short squeeze that could spike price very quickly.
Hi Kevin
We got above the 2690
Have your thoughts changed on the current wave count?
Thank You
It looks an awfully lot like Lara’s final “this may be possible” B wave up chart is the right one, off hand, to me. That said, careful, because it may only go to the 38% or 50% and turn around and start dropping, etc. No guarantee it’s going to the 62% as indicated may happen on Lara’s chart.
Good morning everybody.
There’s more than one way to see this downward wave so far. Here’s one idea:
And here’s another idea:
There’s no target for minute a.
I can’t calculate a target for it until minuette waves (i) through to (iv) are complete. The target for minute a needs to be calculated at minuette degree.
Catching the c up of subminuette 4
A VIX red print today has got to be the funniest thing I have seen in a very long time.
We have really gone through the looking glass!
🙂
Why should the VIX be going up when the market is going up and volatility is at least instantaneously going down? Just curious. I recognize sometimes the VIX anticipates price action coming soon vs. what’s happening now, but MOST of the time, is it not just discounting the actual price action of the moment, against the backdrop of the recent historical price action? Your model of how the VIX works still holds some mystery for me.
Let us assume, for the sake of argument that VIX TRULY represents the SPX put call ratio and nothing else. I am not arguing that there are NOT a hell of a lot of call vs puts being bought; not at all!
I am just expressing surprise, assuming that is true, that it is actually happening under these circumstances, nothing more! 🙂
But VIX isn’t a ratio. It’s a summation of put and call option prices. Oh well, I think we’ve been through this before. This is an interesting “VIX is worthless” theses: http://www.priceactionlab.com/Blog/2012/08/further-analytical-evidence-that-vix-just-tracks-the-inverse-of-price/ I don’t have any horse in this race, I’m just curious about it. I am aware we saw odd VIX behavior just in advance of the start of this big 4; that seemed predictive to me, ala it was discounting the very near future.
I had to take gains on my VIX positions this am, and I am impressed with the valiant effort to keep the illusion going……not gonna re-load yet but think about it
I scooped up some UVXY calls at the low that ate already in the green… 🙂
Fascinating article in the Daily Beast about the sonic problems diplomats in Cuba have been having. A couple of smart guys at the University of Michigan reversed engineered the sound and have figured it comes from listening devices placed too close together. What is interesting is that the inaudible frequencies of the devices when they interact seem to have produced an audible tone to some people that caused all that neurological damage. There are so few guys in the field there is no one competent to peer review the study (except these guys!), so they gave the paper to the State Department. Anybody wants to bet that DARPA comes calling??! lol! 🙂
Tones that cause neurological damage? I thought that only happened at Motorhead concerts. Well, and one I went to in ’75 with Jeff Beck and John McGlaughlin. My ears rang for a full day afterward.
Huge John Mcglaughlin fan. Got every Mahavishnu Orchestra album…
That’s awesome! In addition to show mentioned, I saw him after the Johnny McGlaughlin Electric Guitarist album. Then I saw him at a very small jazz club in Oakland eight or so years ago with one of the Shakti type bands, where he played a nylon string guitar through effects that made it sound the whole time like a hammond B3! My pretty good seat was perhaps 15 feet from the stage, nice! My Goals Beyond…to play tasteful lead lines at JM speed!!
The man is scary good. I bought a compendium of all the MHO scores…most people I try to get to play them take one look and run for dear life! 🙂
He played in Urbana awhile back with Larry Coryell.
Larry Coryell!!!!
Larry is, in my humble opinion (okay, was, so sad he passed!) one of the absolute greatest guitar players of all time. His acoustic versions of Ravel (Pavane Pour Une Infante Defunte and Bolero and Sleeping Beauty) and Rimsky-Korsakov (Scheherazade), OMG!!!!! His bebop work, his fusion work. Larry was the man. I play a version of Ravel’s Pavane on classical guitar, and I’ll work for the rest of my life to improve it based on Larry’s version. Just sumptuous!!!
Neat! I am going to see David Russell at Northwestern this month. Xavier Jara played there last week as part of the same series.
Odd. In my 40 years as an audio engineer, I’ve never encountered a “listening device” that emits audible tones.
Exactly. The interaction of the inaudible frequencies somehow produced the audible tone, according to their study of the wave forms…
Even more basic than that… emitting tones, whether audible or inaudible, is pretty much the opposite of “listening.”
I suspect some subsonic or ultrasonic mischief by Castro’s crew. But it most certainly wasn’t a “listening device.”
I am sure the Spooks have stuff we have never heard of…
Here’s a slightly different way of counting this overall downmove, looking at the initial action as a leading diagonal 1. By this, next up is the final minute 5 down. I dunno…
There are some strange things going on in the PM sector. It looks to me like there is some serious short selling going on. I don’t think it is going to stick though as I suspect price action is forming bull flags. Those are some serious red candles!!
Price moving up to probe this morning’s gap.
Also looks like market makers trying to shake out short positions ahead of the close….same old, same old….
Yep….the commercials should tell the story. What are those in the know doing? Guessing commercials lopped off more shorts and are close to net neutral in silver, which has been bullish in the past. Gold commercials not as bullish. Slv calls and puts worthless today around 15.5, so who ever is capable of keeping it there is going to make some money.
C O I L? and then down?
Looks like the PPT decided not…!
Does anyone know why the robust bid under small caps??
Am I missing somethin’??!! 🙂
If I were to guess, I would hazard that they are going to dally until right into the close and send futures rocketing Sunday evening. Probably not a bad idea to ring the register if your are short before the close. You know these banksters…!!! 🙂
My trend indicator at the 5 minute level has gone green (up trend). Probably doesn’t last. The downtrend channel line is getting closer. I would not be suprised by fireworks before the day session closes. Recently it’s been that 3.5 to 5 hour range into the trading day when the strong selling has been occurring…but that could be random chance giving a fake clue. I’m watching carefully for a possible start of sell off off that channel line. Or….the launch of the 5??? Despite the assessments of total market meltdown? Market action speaks…
I think we need a series of fourth and fifth waves to conclude the move down…
So says EW theory and our best counts. That said, no cooperation today!
Verne, please pardon my ignorance, but what is a TWS signal? Google points me to Interactive Brokers’ Trader Workstation Signal, and nothing else.
Aha! I wasn’t the only one trying to figure that out! I’ll second the question…
Meanwhile, a little backtest by SPX of the 50% fibo, which held…so far.
TWS is Three White Soldiers.
UVXY back to showing only HALF the gains of VIX. What the….????!!!!
Are the gains now being registered the NEXT trading day???!! That means we could have UVXY go up huge the day AFTER VIX has peaked and already retreated and that makes no sense whatsover. If that is true it is going to throw a lot of traders off….
Thank you!
Well,well,well! As if my magic, UVXY is suddenly back to 1.5X VIX.
I am guessing I was not the only trader crying foul… lol!
Hi Verne,
what literature would you recommend as an introduction to Option trading?
Anything written by Ken Trester.
Nick, My advice stay away from options. Not only do you have to be right on the direction of the market… you have to be right on that call in a very specific period of time. Even if you get that right you may still lose money if the market doesn’t move fast enough or far enough to overcome time erosion. In a higher VOL market like right now, you have to pay through the nose to put a position on which means you have to be right on the direction and the size of the move.
You’re better off in ETF’s 100% cash… trading in and out every few days. Here you only have to get your entry point right and the direction of the wave… be ready to cash out to lock in profits and have a tight limit on loss if wrong.
Or buy individual stocks like AG.
I have lost more money on options than any other vehicle I have traded over 30 years. Even when I think I have everything right and figured out… something goes wrong and I lose. Keep trades simple!
They are certainly not for every trader. The most common mistakes beginners make are position sizing, paying too much, and not having a trading plan, including profit target and stop loss.
It is almost impossible to get good at it without some mentoring from people who know what they are doing, as was true in my case! 🙂
Vern, too many decisions with options that you need to have right!
It’s hard enough to make one decision ( to be long or short) on anything and then when to cash out!
Need to keep it as simple as possible… this is my advice! Long or Short … Buy or Sell … Cash out!
I agree Joe. I paid some serious dues learning how to trade them.
I know you are not going to believe this but once you get the hang of it, they are FAR less risky than actually owning shares of the underlying asset. 🙂
Here is one example. Say I wanted to buy shares of AG, I would never buy the shares outright. Instead I would sell a naked put for each 100 shares of AG I wanted to buy. This would GUARANTEE that I either
1. Got shares for less than the price they were trading at at the time I sold the put (if in the money puts you keep the premium which amounts to buying at a discount)
2. I keep the premium if put expires out of the money and I get to rinse and repeat until I get filled, kinda like getting paid while I wait to take delivery of my shares.
Not bad huh? 🙂
OK, Joseph and Verne thanks for your advice
Good Morning!
There’s a storm on the horizon people. Once again, we can look at DAX for some clues as to what we may be facing. Everyone knows very well the concerns I have voiced ad nauseam about this market over the years. Some have offered sound reasons for a differing point of view. Others have resorted to thoughtless name calling with insults like “permabear” despite the literally dozens of bullish trades I have made AND POSTED IN DETAIL, on the forum. I talked for months and months about the incredible situation in short vol and I know I looked like the boy who cried “Wolf!”, as it went on for almost two years! Even the TWS VIX signal in Dec was a bit early. We all know what happened. Every thinking person has got to recognize that what happened with VIX is NOT yet reflected in market price, it CANNOT be. Now I fully understand that not everyone has traded and paid attention to vol the way Chris and I have over the years, but that is just the problem is it not? Ignorance is bliss. We now have another TWS signal from UVXY and spreads are screaming “trouble ahead”. We may want to re-examine our current market expectations.
Have a great trading day!
Verne,
Agree with you and both S&P and NDX are in downtrend with SELL signals active since Feb 28 and MAR 1 respectively. Let’s see what today brings to these shores..
Indeed. I generally am not in the habit of telling people how and what to trade but man alive! Doubling your money on option contracts expiring today will be like shooting fish in a barrel. Don’t let the ridiculous spread scare you as that is just a smoke- screen to discourage buying the contracts. Fill is much better than they are telling. I know not everyone has a day-trading account, but it’s not very often you get to really stick it to market makers! 🙂
Remember the most efficient way to trade bear markets is to scalp the moves. Long term investors can take a buy an hold, and of course the same is true for bull markets. Getting out of trades quickly also reduces third party risk. Before this is over circuit breakers could be triggered. Some of the most furious rallies you will ever see are bear market rallies!
If you have been paying attention to the candles, you will have noticed that the banksters have been furiously buying as price keeps falling in a “managed decline”
Yes Verne that signal is huge and we could see a 70 VIX by mid-next week when another 20b rolls off the FED balance sheet, btw folks, my firm would hire Verne in 2 seconds, he’s that good. The best guidance here would be to sit out, unless you are a professional. The Vol, whips, and confusion will be immense, and de-leveraging has not even begun. Also, our systems are now showing confirmation of sell signals at the weekly level. Everyone please make sure that you are not over exposed to one banking relationship, as there will likely be a run on one major bank near term that will provide a catalyst for more, and the banks are infinitely more levered than they have been in all of history.
Sage advice…!
Thanks for the advice. I’m wondering if your firm has a plan to park it’s money somewhere outside of the dollar. I was thinking canadian cef might be a good. They hold gold and silver. Gold and silver are the only real money in my mind and having it in your possession is best but this may be the next best thing. Although gold and silver got wiped out during the 2008 debacle. The silver commercials are considered bullish as they are probably close to net neutral.
We have insurance contracts on much of our AUM, but we also diversify across currency swaps, a bit of cryptos and across insured prime brokerage accounts. I don’t believe gold and silver will be a place to hide, but it is always discipline to a have a portion of one’s net worth allocated to precious metals. The next few years are not going to be easy; with no clear pathway to safety.
Thanks
Chris, could you send me some more detailed reading material on your theories and the specifics of why you think this is occurring now? (bolives1969@gmail.com). VIX 70 would be the third highest reading, behind only 1987 and 2008. This implies a cataclysm of epic proportions. And by next week?
The issue I have here is that if it’s a 1987 repeat, then it’s nothing. 1987 did not result in any major financial collapses and the ensuing bull market was the strongest in history. It was a panic-driven selloff. On the other hand, a 2008 repeat implies a major instability in the financial system. You have suggested this is the case, and perhaps it is, but it seems you are suggesting that the collapse is imminent, and yet there is no talk of such possible as there was in 2007 and early 2008. In August 2007, Jim Cramer of all people had a now infamous rant about how the Fed was asleep at the wheel. This was over half a year before Bear Stearns and a year before Lehman. The stock market hadn’t even peaked and yet there were rumblings all over. I am simply curious to see a source if you have one. Where are the rumblings today?
Verne, I never meant any offense so I hope none was taken. You are clearly a great trader. I agree you will be vindicated if this is the end of the bull market, and a major financial crisis lies ahead with VIX 70+. If that happens, I will be the first one to post that you were right and everyone should have listened to you all along. We are not, however, at that stage yet. Even now, the market is positive for the year (barely). There is the distinct possibility that this ends up being nothing. Even if we do see -20% and a technical bear market, that doesn’t mean we are on the verge of catastrophe. I apologize for using the term “permabear”, but like you say, you’ve been bearish for at least two years in the face of a relentless rally. Eventually the boy who cried wolf is going to be right by sheer luck. All throughout this bull market, we have had bears decrying the rallies and declaring victory when the corrections came in 2010, 2011, 2012, 2014, 2015, and 2016. You and the bears are still a long way from victory. But like I said, if this is truly the end, and the market collapses into an epic, multi-year bear market, you will be vindicated.
Bo I cannot be certain that it is the end of the bull market. No one can. The simple point I have been making all along is that knowing how we got here, ond cannot help but be nervous. I was nervous about skewed vol for quite a long time but nothing happened. I realise the same could certainly be true of this market, but it makes me no less nervous. As for taking offence, no worries. My skin is not that thin and it was silly of me to even mention it- a case of fingers working faster than brain! 🙂
I’m a bit confused what the target is for minute a. Can anyone please advise?
There isn’t one. I can’t calculate one until minuette waves (i), (ii), (iii) and (iv) are complete. Because I can only calculate it at minuette degree.
Hi all
Where do we have the 200 day average at please?
Go to “indicators” on your chart screen and choose “simple moving averages” then fill in the time period you are interested in, in this case, the 200 day SMA. Choose “update” and line will be drawn for you.
Paresh,
Chart above for S&P Weekly shows 40 week MA in green line at 2,566.99.
Thank You
Anyone for big surf? ‘Cuz these be big darn Minute Waves stacked out in a set reaching to the horizon! You know that look and feeling, when you pull up to the beach and see the lines and go “oh my —- —-!!”. That’s kind of how I feel about this right now.
“Blow wind, swell billow, and swim bark!
The sea is up, and all is on the hazard.” -Shakespeare, Julius Caesar
I’m your Huckleberry…
I just LOVE Val Kilmer as Doc Holliday in Tombstone….what a performance!!! 🙂
“I have not yet begun to debase myself!”
Yeah, one of my fav’s as well.
Hmm where is everyone…
What a day in the markets Doc!