
An upwards day was expected to continue the new trading week for Tuesday. The session did make a higher high, but then price turned down strongly. Signals today from both the AD line and VIX indicate the direction for price tomorrow.
Summary: Assume the trend for now remains up while price remains above 2,697.86. The target is still at 2,920. Tomorrow may see more downwards movement for a second wave correction, which may end about 2,733.
A new low now below 2,697.86 would add confidence to alternate wave counts. At that stage, the most likely scenario would be the continuation of a big consolidation to end either about 2,532.69 or possibly reasonably above that if a triangle unfolds.
Always practice good risk management. Always trade with stops and invest only 1-5% of equity on any one trade.
The biggest picture, Grand Super Cycle analysis, is here.
Last historic analysis with monthly charts is here. Video is here.
An alternate idea at the monthly chart level is given here at the end of this analysis.
An historic example of a cycle degree fifth wave is given at the end of the analysis here.
MAIN ELLIOTT WAVE COUNT
WEEKLY CHART
Click chart to enlarge.
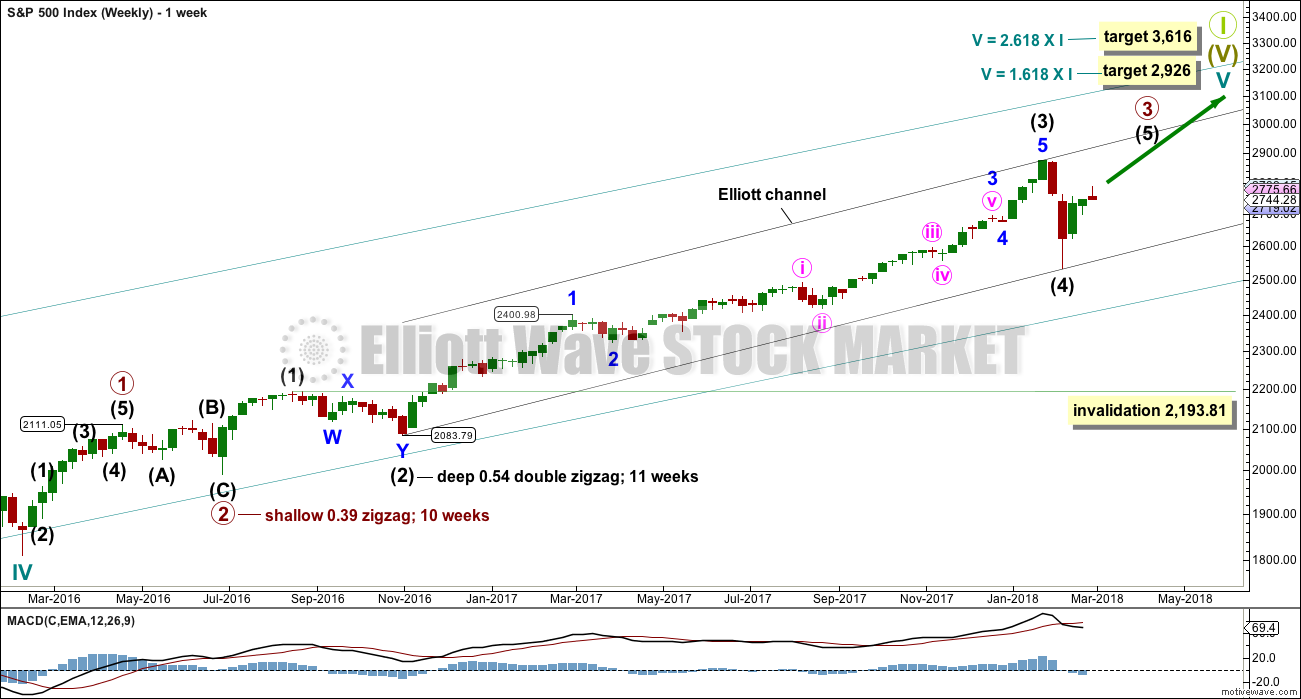
Cycle wave V must complete as a five structure, which should look clear at the weekly chart level. It may only be an impulse or ending diagonal. At this stage, it is clear it is an impulse.
Within cycle wave V, the third waves at all degrees may only subdivide as impulses.
Due to its size intermediate wave (4) looks proportional to intermediate wave (2), even though their durations so far are quite different.
Intermediate wave (4) has breached an Elliott channel drawn using Elliott’s first technique. The channel is redrawn using Elliott’s second technique. The upper edge may provide resistance for intermediate wave (5).
Intermediate wave (4) may not move into intermediate wave (1) price territory below 2,193.81.
DAILY CHART
Click chart to enlarge.
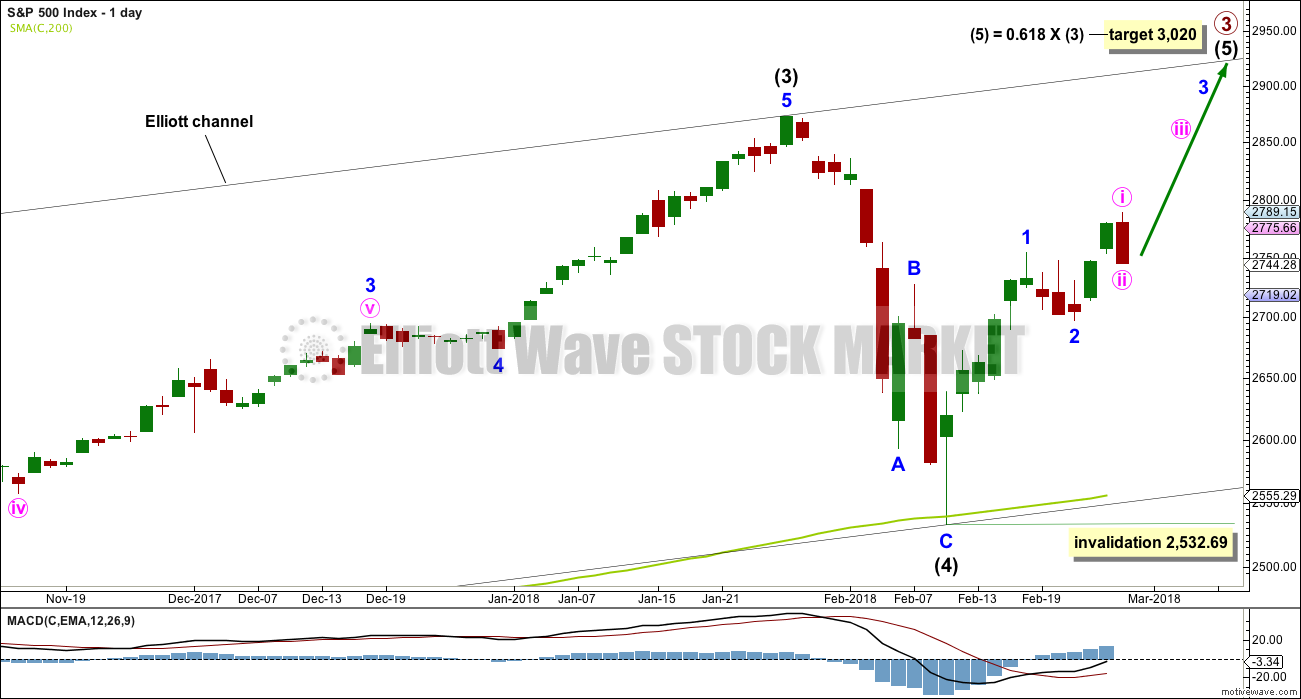
Despite the duration of intermediate wave (4) being much quicker than intermediate wave (2), the size is proportional. On weekly and monthly time frames intermediate wave (4) now has the right look.
Intermediate wave (5) may only subdivide as either an impulse (more likely) or an ending diagonal. An impulse will be assumed, and a diagonal will be charted if overlapping begins to indicate it.
The downwards wave labelled intermediate wave (4) may be seen as either a three wave zigzag, as labelled on this daily chart, or it may be seen as a five wave impulse. Both possibilities must be considered. The main hourly and alternate hourly charts consider it as a zigzag. The second alternate hourly chart considers it may have been a five.
HOURLY CHART
Click chart to enlarge.
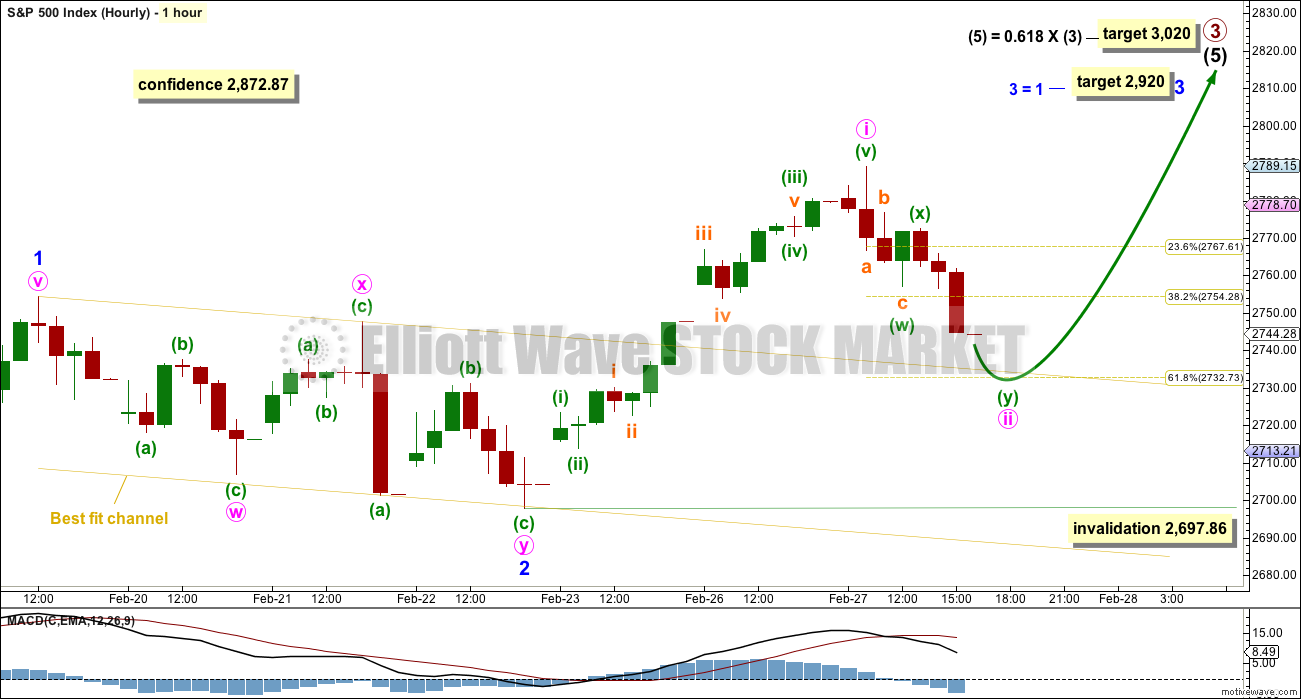
So far minute wave ii now shows up on the daily chart as one red candlestick. The structure on the five minute chart looks like an incomplete double zigzag, so it may continue lower tomorrow to end close to the 0.618 Fibonacci ratio about 2,733.
Minute wave ii may not move beyond the start of minute wave i below 2,697.86. This price point now differentiates this main hourly wave count from the alternates below.
ALTERNATE ELLIOTT WAVE COUNT
ALTERNATE DAILY CHART
Click chart to enlarge.
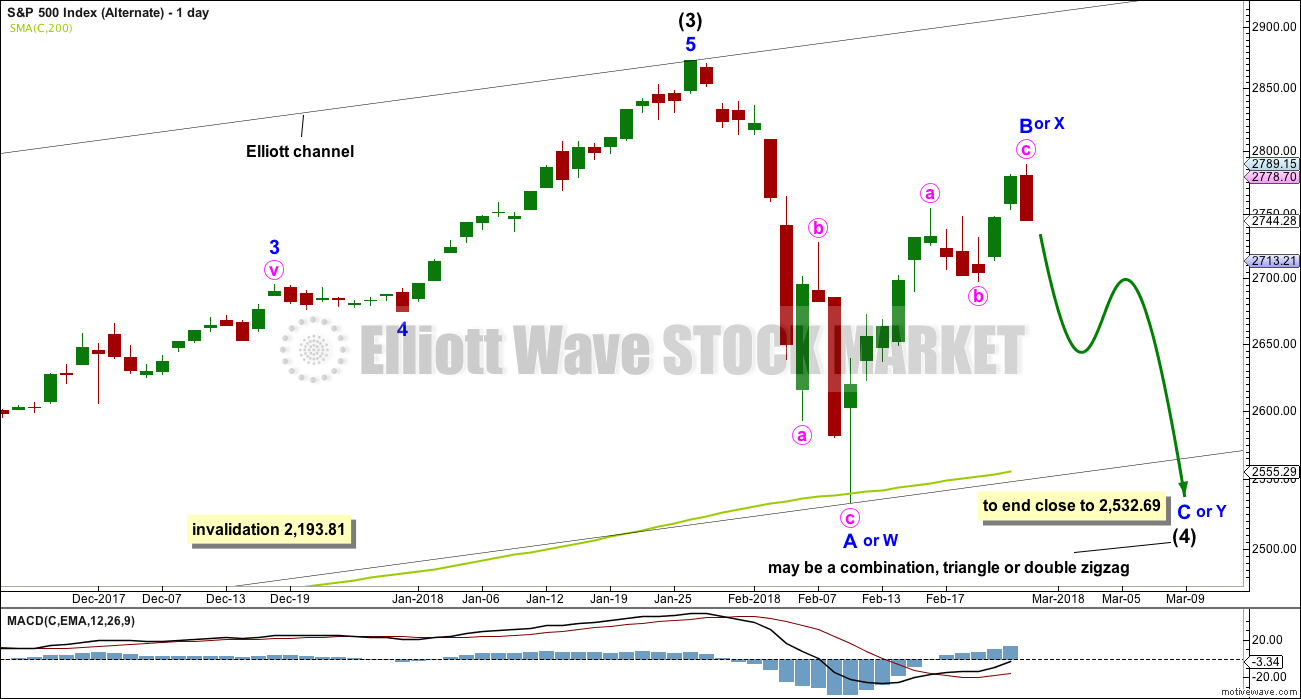
This wave count is identical to the main daily chart, with the exception of the degree of labelling within intermediate wave (4). If the degree is moved down one, then only minor wave A may be complete within a continuing correction for intermediate wave (4).
Intermediate wave (2) was a double zigzag. While it is possible that intermediate wave (4) may also be a double zigzag, this would be the least likely structure as intermediate wave (4) would be likely to exhibit alternation in structure with intermediate wave (2).
Intermediate wave (4) may be continuing further sideways as a combination or triangle, with either of these structures about equally as likely.
If intermediate wave (4) is unfolding as a combination, then the first structure would be a zigzag labelled minor wave W. The zigzag would now be joined by a complete three in the opposite direction, a zigzag labelled minor wave X. The second structure may be either a flat (most likely) or a triangle labelled minor wave Y. Minor wave Y would most likely end about the same level as minor wave W at 2,532.69, so that the whole structure takes up time and moves price sideways.
If intermediate wave (4) is unfolding as a triangle, then it may be a regular contracting triangle. Minor wave C may not move beyond the end of minor wave A and may most likely end about 0.8 to 0.85 the length of minor wave B, giving a target range about 2,584 to 2,571. Thereafter, minor wave D may not move beyond the end of minor wave B above 2,789.15 and minor wave E may not move beyond the end of minor wave C. A triangle may see intermediate wave (4) remain above the 200 day moving average, finding support there.
Minor wave B has not met the minimum requirement for a flat correction within intermediate wave (4). With today’s strong red daily candlestick, it looks like a zigzag upwards may now be complete for this wave count. If this is correct, then intermediate wave (4) may not be a flat correction.
ALTERNATE HOURLY CHART
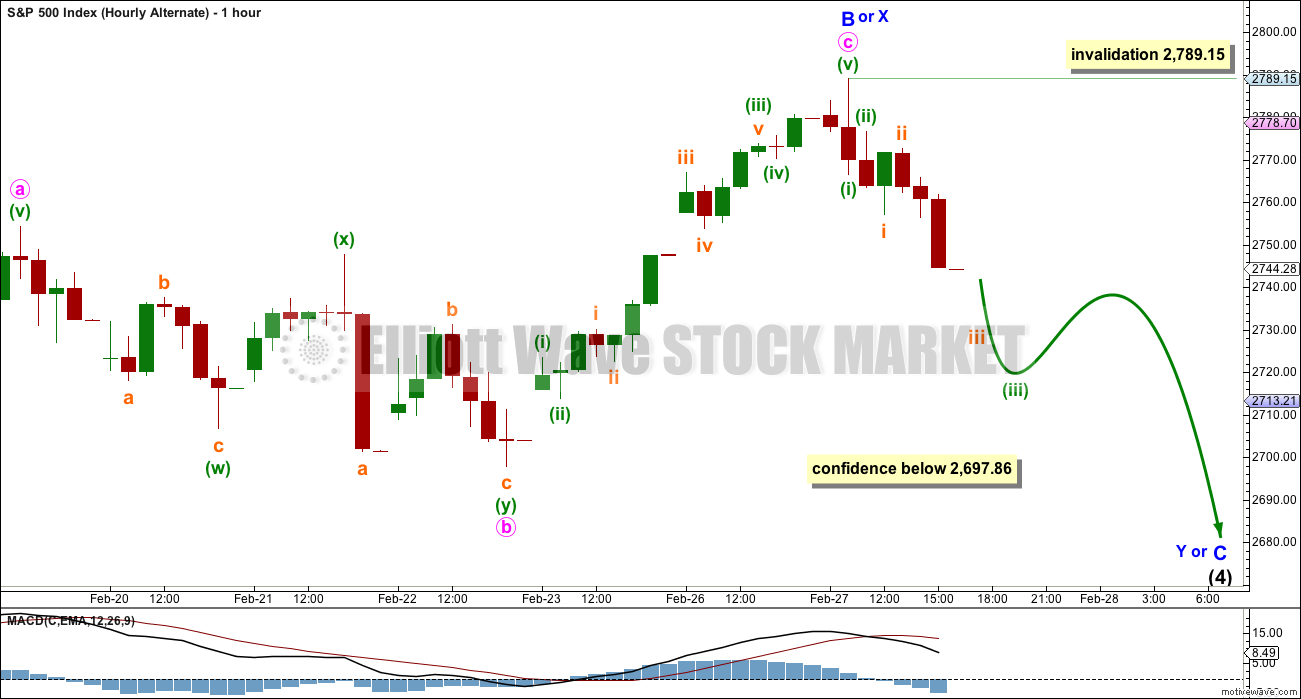
Click chart to enlarge.
A five down should develop at the hourly chart level first within minor wave Y or C downwards. This would be incomplete. So far a series of two overlapping first and second waves may be complete.
If intermediate wave (4) is unfolding as a combination, then minor wave Y should be a flat or triangle.
If intermediate wave (4) is unfolding as a triangle, then minor wave C would most likely be a zigzag.
SECOND ALTERNATE HOURLY CHART
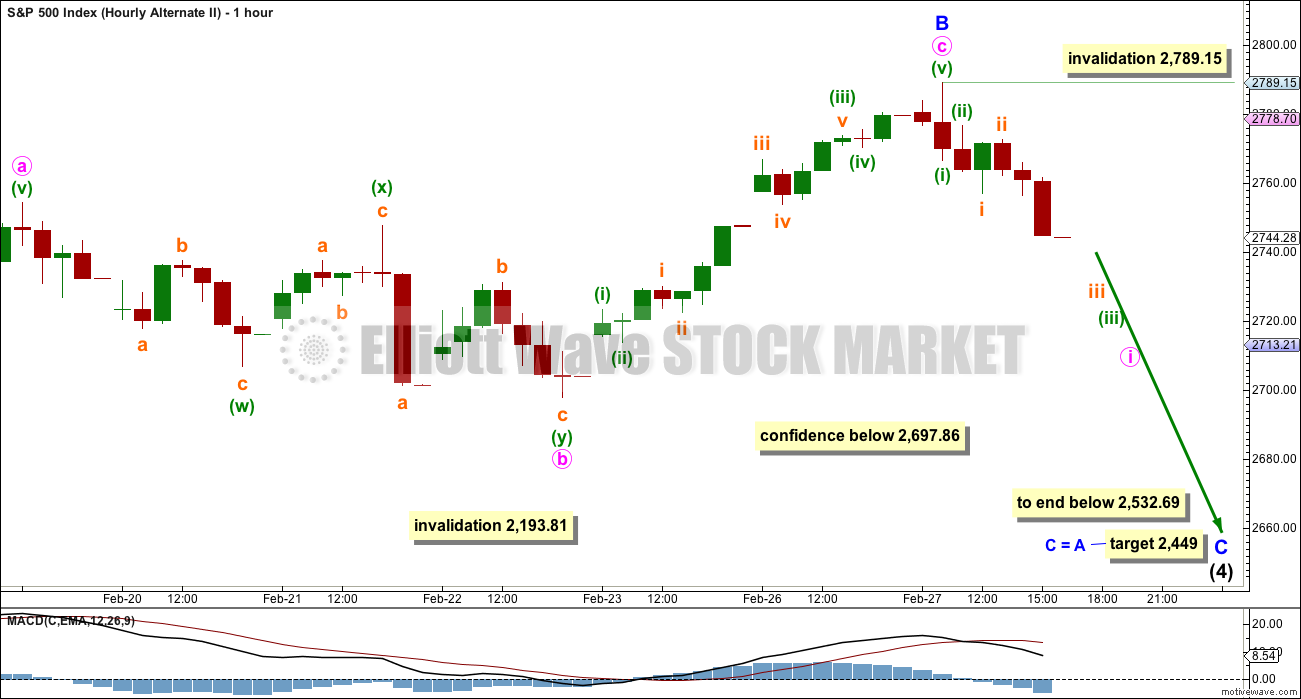
Click chart to enlarge.
It is also still possible that minor wave A on the daily chart was a five wave impulse and not a three wave zigzag. If minor wave A was a five, then intermediate wave (4) may be an incomplete zigzag.
The target expects to see the most common Fibonacci ratio of equality in length between minor waves A and C. This would require a strong breach of the 200 day moving average, which must be judged to have a low probability.
Low probability does not mean no probability. Low probability outcomes do occasionally occur, and when they do they are never what was expected as most likely to happen. This wave count illustrates the risk today to any longer term long positions.
TECHNICAL ANALYSIS
WEEKLY CHART
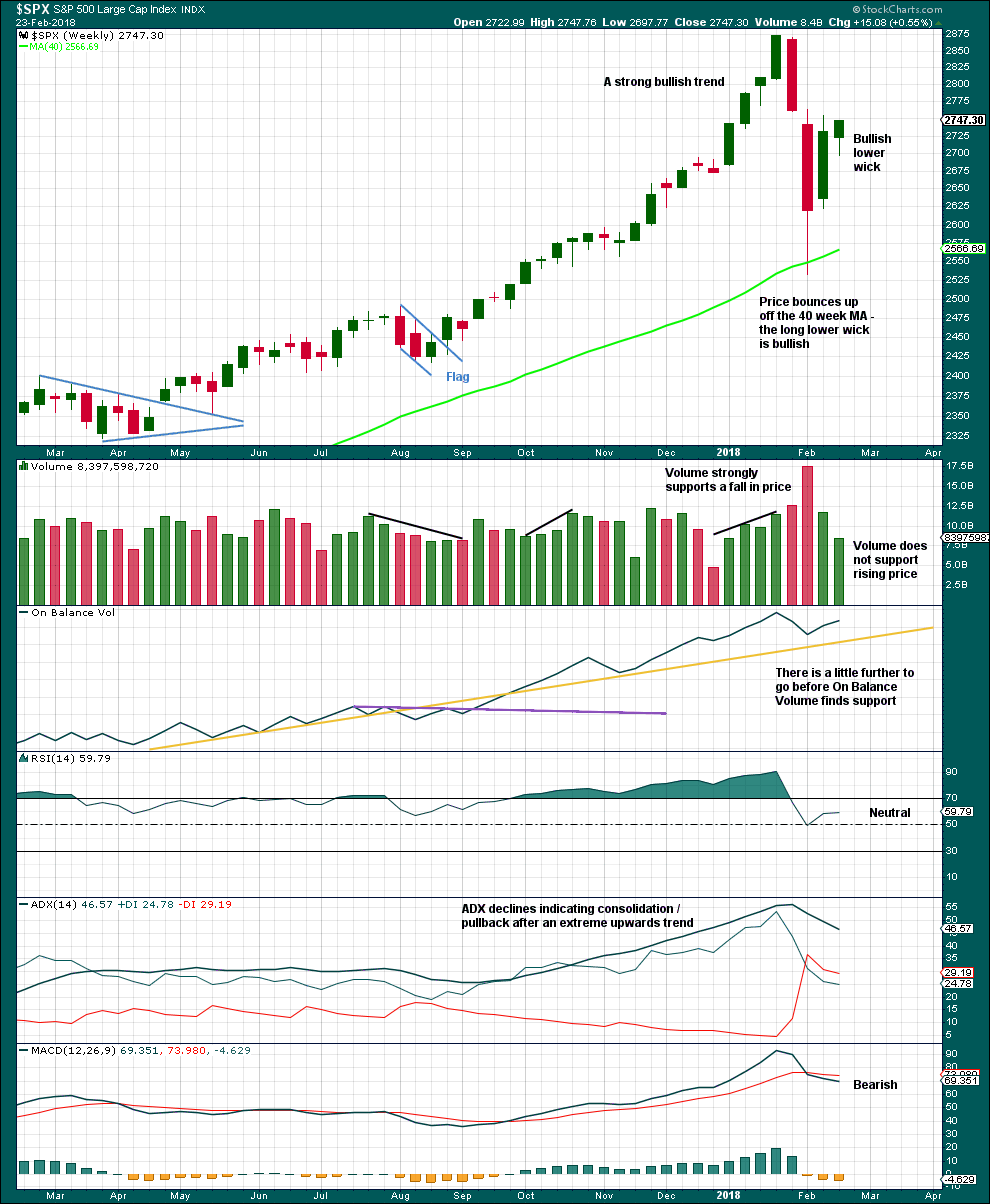
Click chart to enlarge. Chart courtesy of StockCharts.com.
Volume last week is much lower than the prior week, which is bearish.
The longer lower wick on the last weekly candlestick and the shaven head are bullish.
The pullback has brought ADX down from very extreme. A possible trend change to down is indicated, but as yet no new trend is indicated.
DAILY CHART
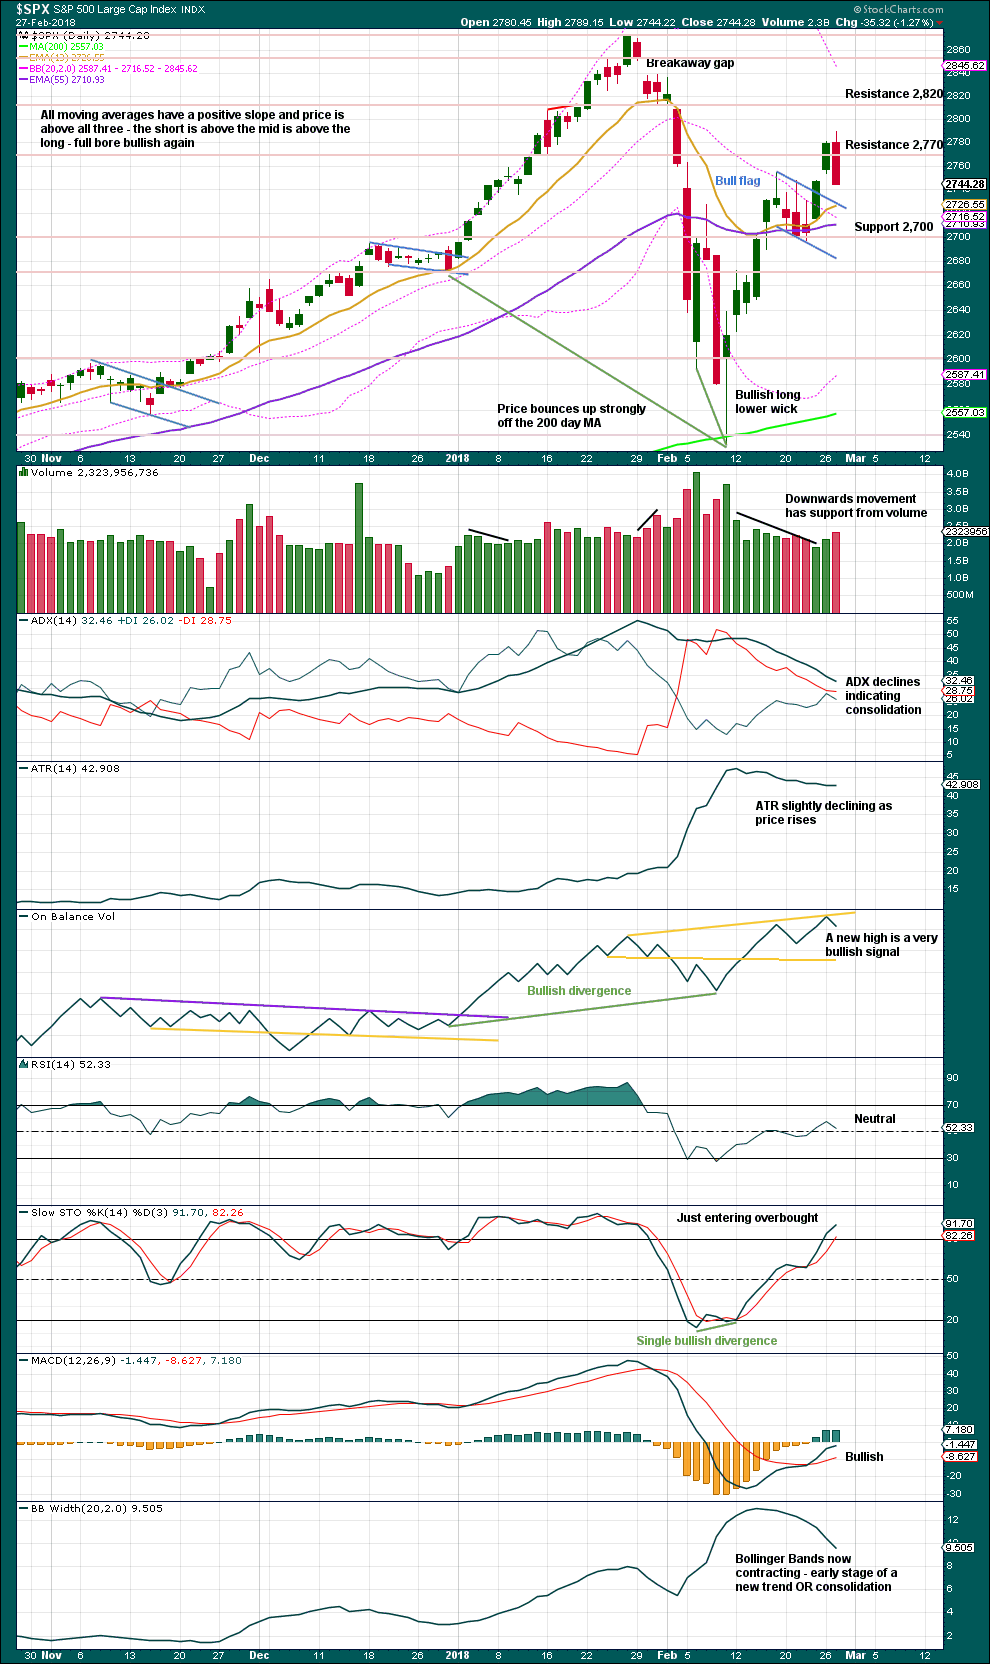
Click chart to enlarge. Chart courtesy of StockCharts.com.
The strong bullish signal from On Balance Volume still supports the main Elliott wave count. It does not preclude a pullback here though.
The upper yellow resistance line on On Balance Volume is slightly adjusted today.
Because today’s candlestick has no lower shadow and has support from volume, it looks like downwards movement here is incomplete. Today’s candlestick completes a Bearish Engulfing reversal pattern.
VOLATILITY – INVERTED VIX CHART
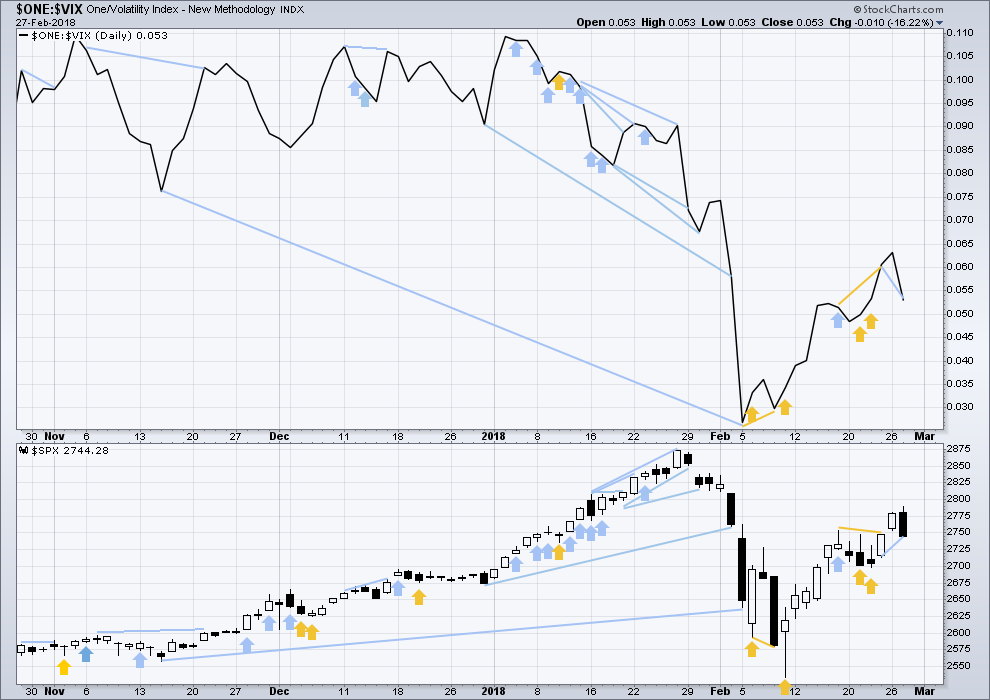
Click chart to enlarge. Chart courtesy of StockCharts.com.
So that colour blind members are included, bearish signals will be noted with blue and bullish signals with yellow.
Normally, volatility should decline as price moves higher and increase as price moves lower. This means that normally inverted VIX should move in the same direction as price.
Inverted VIX today has made a new low below the low of three sessions prior, but price has not. This divergence is bearish if inverted VIX is read as a leading indicator.
BREADTH – AD LINE
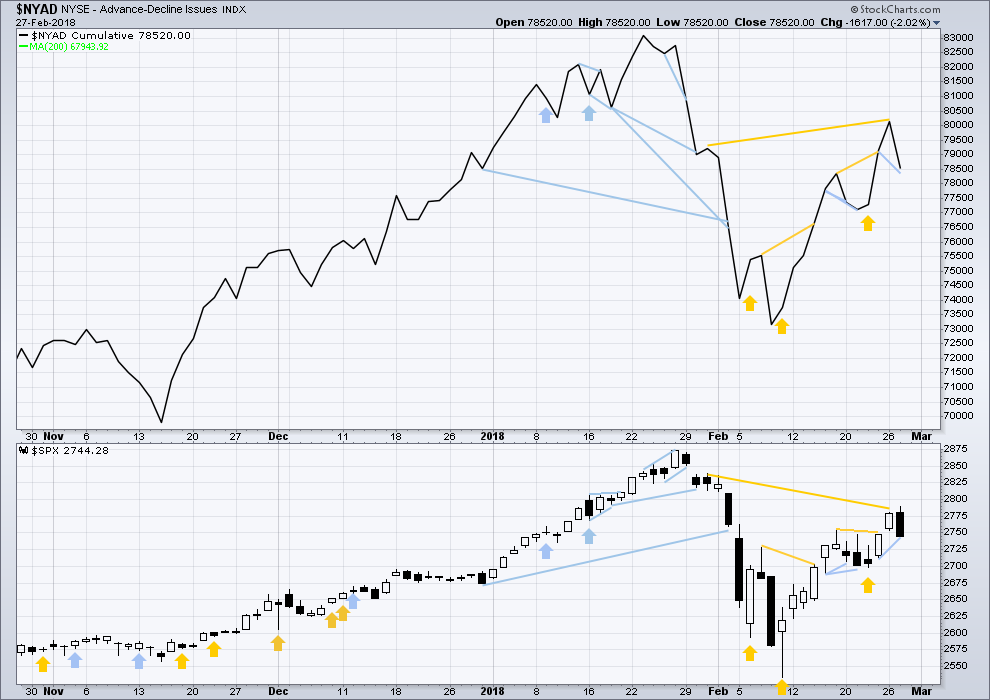
Click chart to enlarge. Chart courtesy of StockCharts.com.
There is normally 4-6 months divergence between price and market breadth prior to a full fledged bear market. This has been so for all major bear markets within the last 90 odd years. With no longer term divergence yet at this point, any decline in price should be expected to be a pullback within an ongoing bull market and not necessarily the start of a bear market.
All of small, mid and large caps last week moved upwards. The bounce has support from wide breadth.
Breadth should be read as a leading indicator.
The last bullish signal from the AD line has now been followed by a downwards day. It may have failed, or it may be still followed by price to a new high above the high of the 31st of January.
The AD line today has made a new low below the low three sessions prior, but price has not. This is a short term bearish signal and indicates downwards movement tomorrow.
DOW THEORY
All indices have made new all time highs as recently as five weeks ago, confirming the ongoing bull market.
The following lows need to be exceeded for Dow Theory to confirm the end of the bull market and a change to a bear market:
DJIA: 17,883.56.
DJT: 7,029.41.
S&P500: 2,083.79.
Nasdaq: 5,034.41.
Charts showing each prior major swing low used for Dow Theory are here.
Published @ 08:00 p.m. EST.
I have to swap the main and alternates around today.
A three up now looks complete on the daily chart. Two strong downwards days, support from volume, shaven bottoms, all looks very bearish.
So now the most likely expectation looks to be intermediate (4) continuing sideways. Probably to retest the 200 day moving average, but remain above it.
We may be headed for a re-test of the 200 day folks.
Have a great and restful evening everyone!
There’s a VERY long way to go to get there. This is “just” a 2, until it isn’t. Everything right now is magnified because of the generally super high level of volatility. That all said, yes, price may be headed all the way down there. But one thing at a time. Let’s see if last week’s low holds or not.
Hi Kevin what do you have for last weeks low?
Price about to slice cleanly through 50 with nary a bounce. Beacoup Bearish!
Tomorrow is gonna be ugly….
How convenient at the close yesterday UVXY went from 2X to 1.5X VIX. Any you guys think this system is not crooked!? 🙂
Figures!
It’s crooked but just hurts options holders.
I think this is more like the start of an impulse down. If it is a wave 2 it has already retraced 78.6% which is deep when you think minor 2 retraced less than 38.2%
Until it breaks below last week’s low, it’s still a 2. That said, it mah very well do that soon enough. Looks like the the fear is just ramping up here.
Agreed. The alternate is looking better now.
Geez this is fun, lol
You must be tired of….WINNING! 🙂 🙂 🙂
Bulls may be catching a break. Looks like and exhaustion move up on VIX. If it moves back down into that gap and keeps going we may have an interim bottom in place.
Hi vern is it at 2736.42 the 50 day?
Just about…
The bulls really need to hold the 50 day. We knew from the price action yesterday it was going to be in play and they HAVE to hold it, cuz if they don’t…….
The 50-day has no relevance in this downtrend. Hasn’t provided resistance or support at any level.
I guess the bears not too interested in dancing huh? 🙂
This is way too funny!!
Can you BELIEVE this? Yet ANOTHER sideways mamba!! These guys just never give up do they??! lol!
Taking another triple off the morning’s highs. Holding a little bit for a possible bounce and re-load…are we having fun yet?
You just gotta love bread and butter trades! 🙂
When you say you made a triple, I assume a 3:1 winner. But what exactly did you trade? /ES? SPX? What contract and what expiration?
Hard to say how deep the move out of the coil will go. Knowing the banksters, they are probably going to try and whipsaw traders with a snappy reversal so it would not hurt to take some moolah off the table if you traded the “Verne Coil” to the downside.
You are very welcome!! 🙂
Updated hourly chart:
Nope.
This?
Either this, or a very rare triple zigzag
https://www.bloomberg.com/news/articles/2018-02-28/s-p-500-hits-tech-heavy-milestone-last-seen-amid-dot-com-bubble
Is SPX going to finally take out an hourly swing high this week? That would be a nice bullish indicator. And in general, it now appears that maybe those two fibo’s are going to hold. Maybe maybe maybe.
Remember the initial move out of a coil can often be a misdirection… 😉
Word!!
Did you nail ’em??! 😀
Too late! I should have popped the quiz earlier! 😉
If you were thinking of snakes…bingo!!!
O.K. folk, pop quiz:
What is the market doing as we speak?!
Just LOOK at it…!! 🙂
I know Kevin knows more than he lets on… lol!
Never show your full hand…but it’s fun to flash a single card now and then! So…NO, it’s not a triangle. It’s a Verne Coil!! Lol!!
This is looking more and more like a repeat of last week (so far).
He!He! 🙂
An important consolidation zone now being fiercely contested. It was broken and is being back-tested…
I see this more as a question of whether the market is going to break down through an overlay of two fibos: the 50% of the Feb 23-27 upmove, and the 62% of the massive 11% downmove. They are both right here around 2742-3. Market has been hesitating around this area over and over for about 4 hours now. It is a key decision level. Next up is of course 2732 the 62%, then 2720 the 76%.
I am curious…how many traders on the forum shorted the pop this morning?
(Chris not talking to you! 🙂 )
Guilty
I know…you’re a trader…! 🙂
My hourly system (only one I short in in current market conditions) has not yet triggered a short. The hourly 8 EMA is still above the 34 EMA (and has been for many, many days). With more downward movement today, it may trigger. I try to remove personal judgement from the equation, because I’m a bloated bag of fear and greed when it comes right down to it, lol!!
Good for you Kevin. I respect a man that plans his trade and trades his plan.
Hi Kevin
Take a look at the S & P for the year 2000
from what Lara here says wave 5 could be 3050ish to 3600ish
3000 – 3100 might be it when you look at the SPX in 2000 it rallied into march at 1550. looking at the percentages then to now that would put the index going to 2936 – 3050ish.
Now with the largest hedge funds coming out and saying there’s a 70% chance of a recession before 2020.
All thoughts and comments welcome.
Thank You
What do you think?
Eric honestly I have no clue what the markets are going to do. I don’t know what they are going to do in 10 minutes, much less next week, and certainly not over the next several months. I dunno!!! I recognize I don’t know, and while I could allow myself to “form a view” based on all kinds of perspectives, including some of the historical things you’ve brought up…my chance of being wrong is probably larger than that of being right. That’s why I’m leaning hard into multi-time frame mechanical systems. I’m striving to “just let the market decide”. Sorry I can’t help you!!
Thanks Kevin
Great insight there.
There are some technical analysis that indicate bull market end Jan. 27,2018. I guess each analysis is based on specific assumptions and must be taken with a grain of salt.
Holding short from yesterday’s pop.
Expecting a 10% drop from yesterday’s high, so watching the market tantrums with amusement
Yep! Tempest in a tea-cup! 🙂
a pretty hesitant start to a wave 3 up!
It has taken me an awfully long time to come to the realisation that that there are far many more stupid people trading the markets than there are intelligent ones. If you doubt that assertion, just take a look at the VIX candles on the five minute chart…..
I see a fake print on the VIX down to 15.65. If that happens the market is going higher.
Not fake. That was serious. I am surprised more people did not comment on it.
They pull that crap commonly on expiration Wednesdays to steal from traders holding options through expiration.
Because most people don’t know what it is.
VIX just closed the gap from yesterday at 18.75.
I love credit spreads!
Selling remaining long side for 50% pop on relief bounce. Watching VIX….
Lets see if momo folks will arrive as smart money sure isnt buying this rally..
Insiders have been selling for quite some time. Its too bad about those folk owning pension funds and other automatic investing vehicles that have to choice but to be long the market.
Read about calpers running into issues and might have to declare insolvency.
https://www.zerohedge.com/news/2018-02-24/former-calpers-board-members-shocking-admission-calpers-near-insolvency-it-needs
Very sad indeed! That is the world’s worst kept secret. Think about all the unfortunate lives that are going to be destroyed by that debacle. The news is even worse than they are letting on. They are not marking to market the unbelievable junk they invested in the last several years to try and make up lost ground after catastrophic losses during the FC. The projected returns of 6% needed to fulfill the fund’s obligations has been a complete lie and a fraud for years.
There will be riots! 🙁
Sad realities ahead for many unsuspecting retirees.
For now I’m happy to trade long or short as the waves dictate, but man-o-man when this bull finally lays down and dies, watch out below!
Interesting to see where we go from here. If we spend too much time back by the 62% Fib level I may open a small short even. BTW, I want to make clear that I meant no offense with my skepticism of having a bearish fundamentals perspective here. I have heard many perspectives over the years, including Prechter’s annual predictions of a multi-generational bear market since 1987. If Verne or Chris or anyone else has some interesting resources to explain why the deleveraging is imminent and won’t be able to be contained this time, I would be interested if you can send it my way (bolives1969@gmail.com).
Bo, back in late 2015, early 2016, I did some personal research while I was a bear. Based on my findings of where the SPX was in the ’80’s, with keeping inflation and GDP in mind, the SPX has lagged where it should be. I have also adjusted for dividends. It’s been awhile, so take it with a grain of salt.
From my findings, the SPX should be trading over 4000 today. We haven’t even gotten to 3000 yet. Plus, we have a president (think what you will of him) who will do anything for the US economy and to pump up the stock market. How is this not bullish?
My source is the historical S&P prices, GDP per year, and the Federal inflation rates.
Maybe I’m missing something here, but I don’t see why the market wouldn’t want to push to those levels at some point in the distant future. Granted I was a bear for several years…maybe now that I’m temporarily bullish with Lara’s count, it’s time to get bearish–just how things seem to work…
SPX CAPE is now around 30.
Its long tetm average is 17.
I am curious as to what kind of resrarch tells you fair price is 4K.
CAPE worked well until it didn’t.
Anyone home?
Wabbit what up?