
An upwards day was expected for the new trading week and price has behaved exactly as expected.
Summary: The larger trend is up. The next target is at 3,020.
The next short term target is at 2,920. This wave up may be a third wave, and it may continue to be strong. A very bullish signal today from On Balance Volume and a bullish signal from the AD line indicates another upwards day tomorrow and possibly for a few days.
Always practice good risk management. Always trade with stops and invest only 1-5% of equity on any one trade.
The biggest picture, Grand Super Cycle analysis, is here.
Last historic analysis with monthly charts is here. Video is here.
An alternate idea at the monthly chart level is given here at the end of this analysis.
An historic example of a cycle degree fifth wave is given at the end of the analysis here.
MAIN ELLIOTT WAVE COUNT
WEEKLY CHART
Click chart to enlarge.
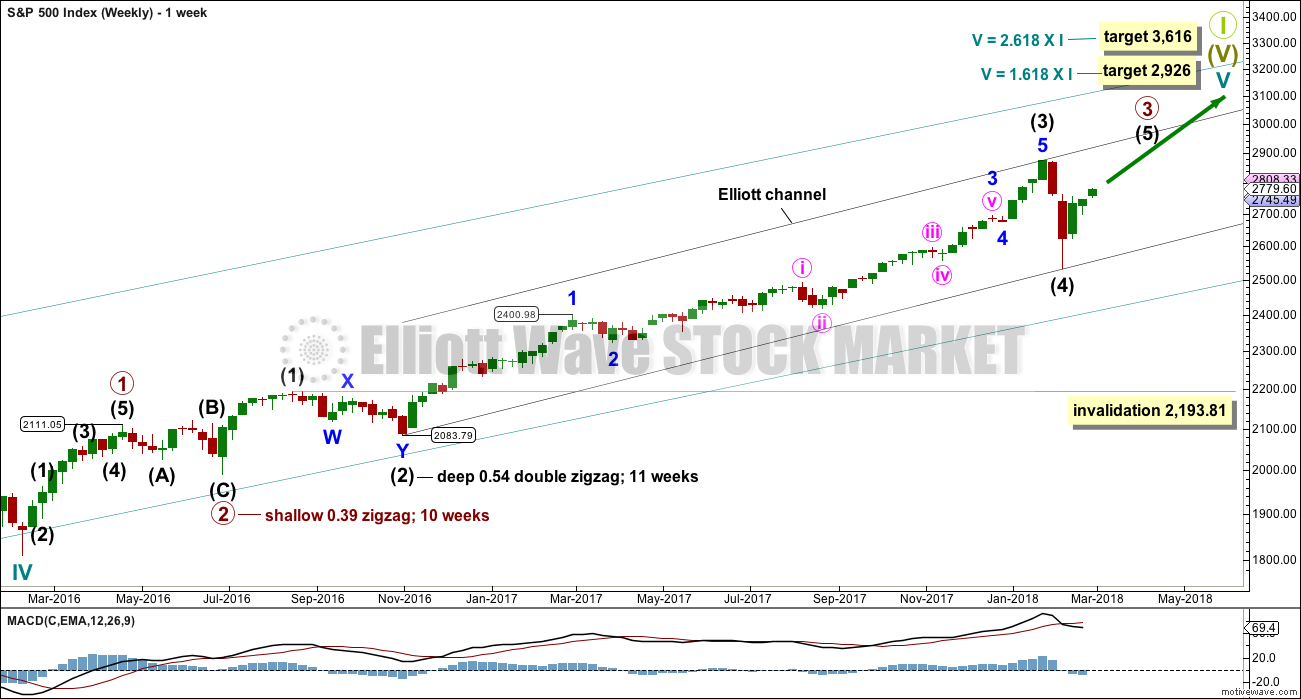
Cycle wave V must complete as a five structure, which should look clear at the weekly chart level. It may only be an impulse or ending diagonal. At this stage, it is clear it is an impulse.
Within cycle wave V, the third waves at all degrees may only subdivide as impulses.
Due to its size intermediate wave (4) looks proportional to intermediate wave (2), even though their durations so far are quite different.
Intermediate wave (4) has breached an Elliott channel drawn using Elliott’s first technique. The channel is redrawn using Elliott’s second technique. The upper edge may provide resistance for intermediate wave (5).
Intermediate wave (4) may not move into intermediate wave (1) price territory below 2,193.81.
DAILY CHART
Click chart to enlarge.
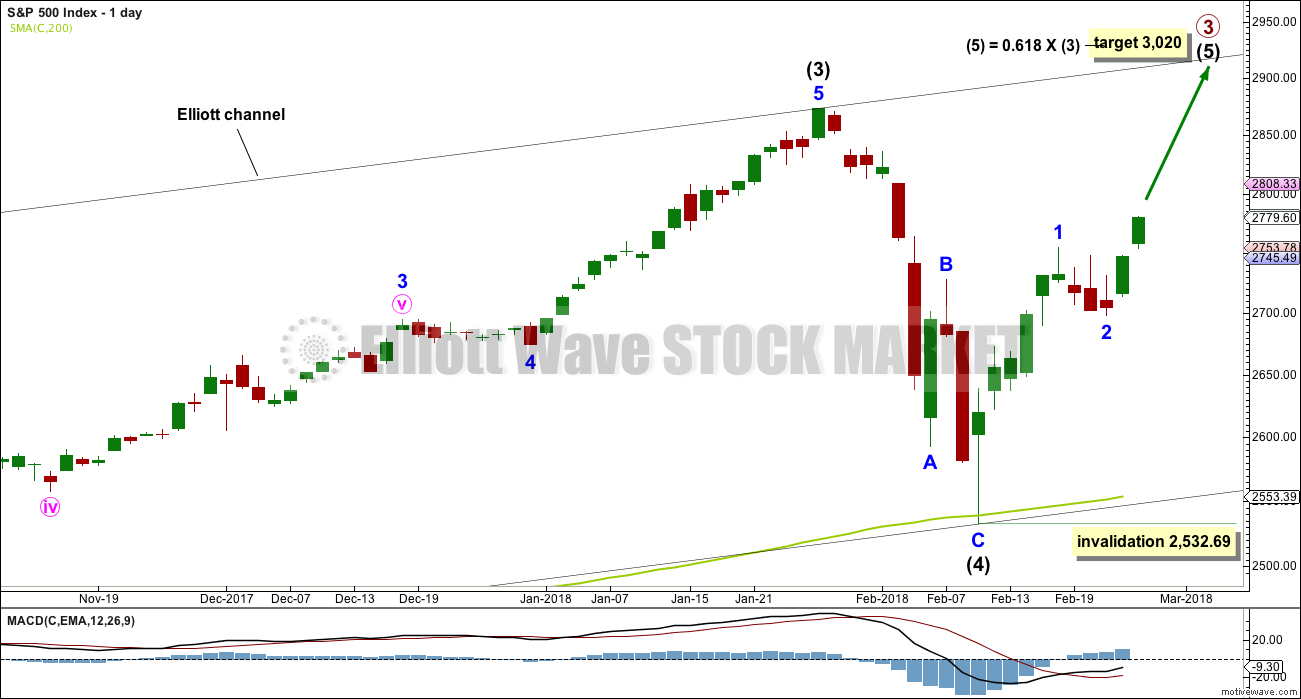
Despite the duration of intermediate wave (4) being much quicker than intermediate wave (2), the size is proportional. On weekly and monthly time frames intermediate wave (4) now has the right look.
Intermediate wave (5) may only subdivide as either an impulse (more likely) or an ending diagonal. An impulse will be assumed, and a diagonal will be charted if overlapping begins to indicate it.
The downwards wave labelled intermediate wave (4) may be seen as either a three wave zigzag, as labelled on this daily chart, or it may be seen as a five wave impulse. Both possibilities must be considered. The main hourly and alternate hourly charts consider it as a zigzag. The second alternate hourly chart considers it may have been a five.
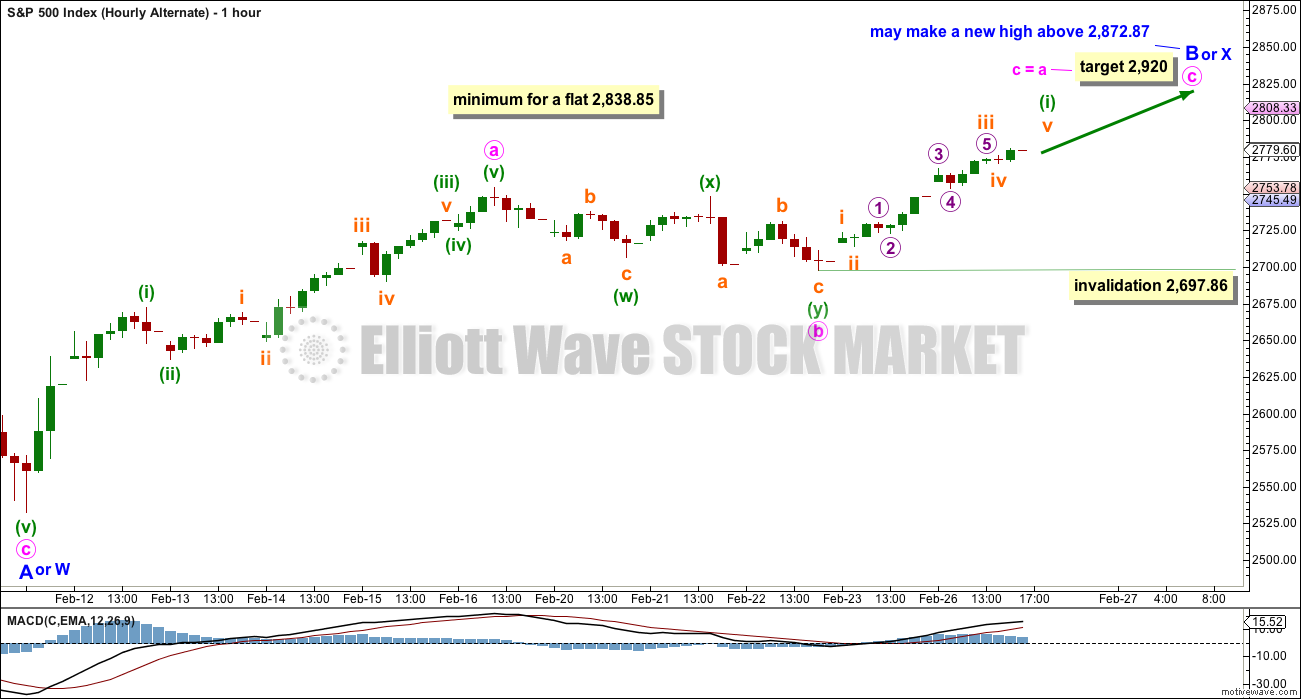
HOURLY CHART
Click chart to enlarge.
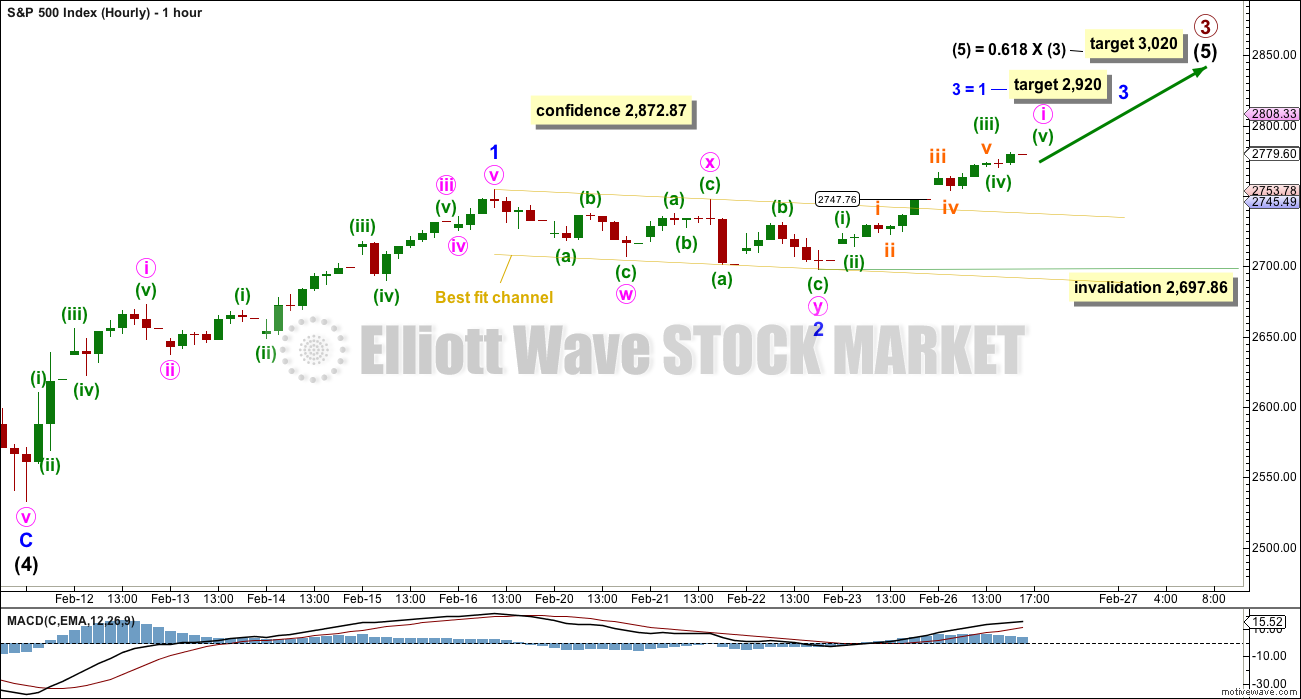
A new all time high would add confidence to this wave count (even though an alternate idea published would remain valid).
Minor wave 2 was a very shallow 0.26 correction of minor wave 1. Upwards movement for today’s session has support from volume, so this should be labeled as minor wave 3 and not a continuation of minor wave 2.
Because minor wave 2 was so shallow the target for minor wave 3 is to reach equality in length with minor wave 1. But if this target is wrong, then it may not be high enough. Along the way up, within minor wave 3, corrections should be brief and shallow.
Minute wave ii may most likely be brief and shallow. It may be over within a day, but it could be longer lasting and show up on the daily chart. Minute wave ii may not move beyond the start of minute wave i below 2,697.86.
ALTERNATE ELLIOTT WAVE COUNT
ALTERNATE DAILY CHART
Click chart to enlarge.
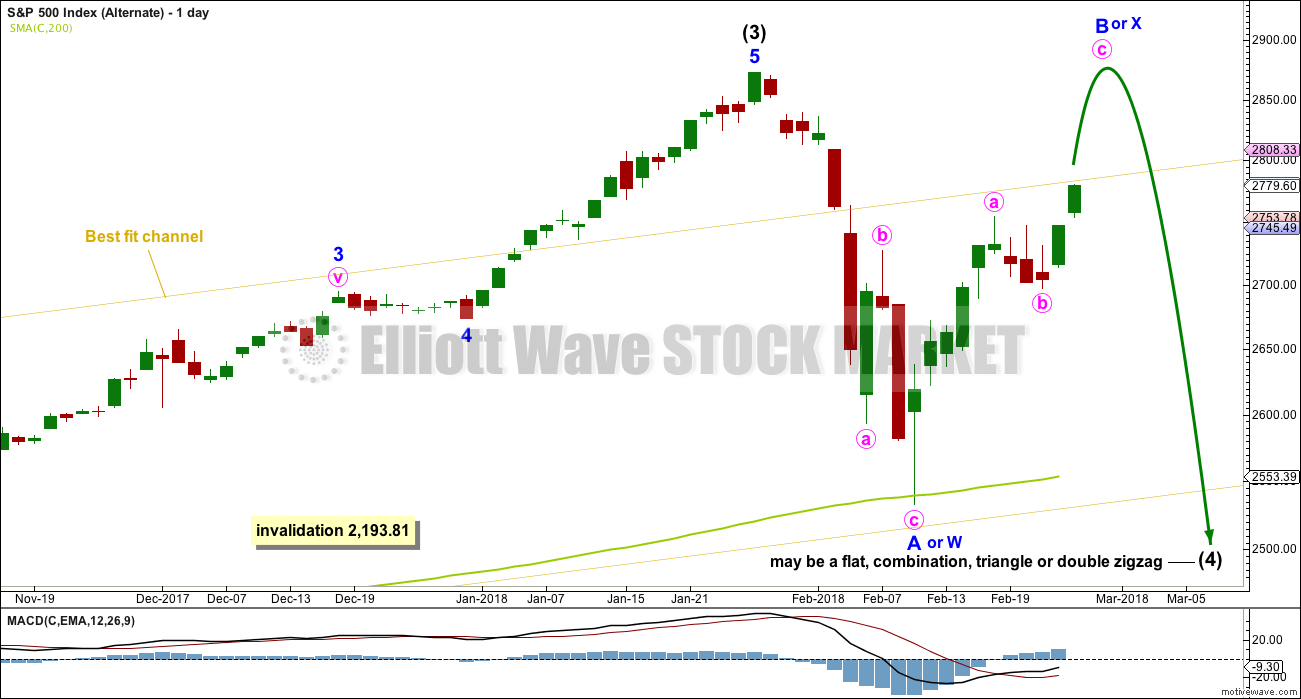
This wave count is identical to the main daily chart, with the exception of the degree of labelling within intermediate wave (4). If the degree is moved down one, then only minor wave A may be complete within a continuing correction for intermediate wave (4).
If it continues further, and if analysis of minor wave A as a zigzag is correct, then intermediate wave (4) may be a flat, combination, triangle or double zigzag. Of all of these possibilities a double zigzag is the least likely because that was the structure of intermediate wave (2). Intermediate wave (4) should be assumed to exhibit alternation until proven otherwise.
If upwards movement continues further, then the idea of a double zigzag may be discarded. Double zigzags normally have a strong slope against the prior trend, and to achieve a strong slope their X waves are usually shallow.
All of a flat, combination or triangle would have a very deep minor wave B. An expanded flat, running triangle or combination may have minor wave B or X make a new all time high. Unfortunately, for this reason there is no upper price point which differentiates this alternate idea from the main wave count.
Minor wave B or X should be expected to exhibit weakness. Light and declining volume and divergence with oscillators at its end are features of B waves, and also of X waves which are analogous.
Minor wave B or X may be any one of more than 23 possible corrective structures, but it would most likely be a zigzag. It looks like it may be subdividing as a zigzag at this stage.
This alternate wave count would expect a strong breach of the 200 day SMA, which would be unlikely. The first expectation should be for price to find strong support there.
ALTERNATE HOURLY CHART
Click chart to enlarge.
Upwards movement off the low may be an incomplete zigzag for minor wave B. Zigzags subdivide 5-3-5, exactly the same as the start of an impulse.
If intermediate wave (4) is a flat correction, then within it minor wave B must retrace a minimum 0.9 length of minor wave A.
If intermediate wave (4) is a triangle, there is no minimum requirement for minor wave B. It only needs to subdivide as a three wave structure.
If intermediate wave (4) is a combination, then the first structure may be a zigzag for minor wave W. Minor wave X may be any corrective structure and it may make a new high above the start of minor wave W. There is no minimum requirement for minor wave X of a combination, but it would very likely be fairly deep.
Minor wave B or X may be unfolding as a zigzag. So far, within minor wave B or X, minute wave a may be a complete five wave impulse. Minute wave b may now be complete as a double zigzag. Within minute wave c, no second wave correction may move beyond the start of its first wave below 2,697.86.
SECOND ALTERNATE HOURLY CHART
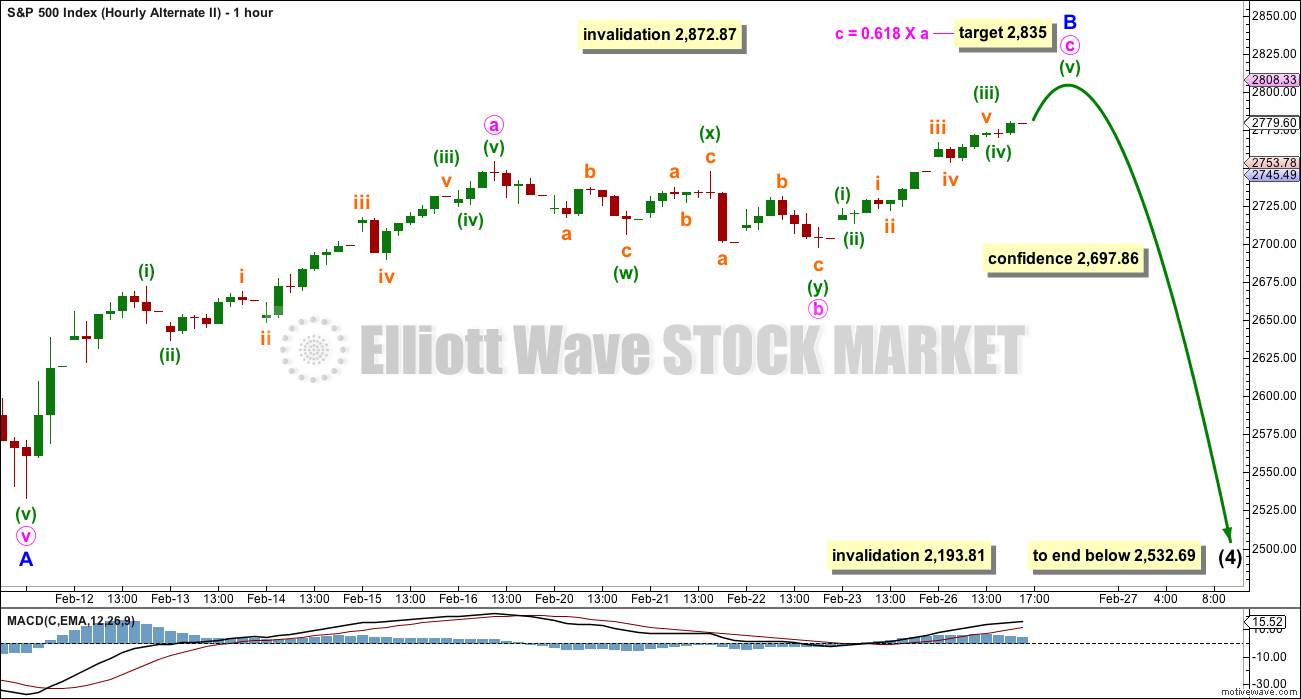
Click chart to enlarge.
It is also possible to see the last downwards wave as a five wave impulse. Intermediate wave (4) may be continuing lower as a single zigzag, subdividing 5-3-5.
Within a zigzag, minor wave B may not make a new high above the start of minor wave A at 2,872.87.
Minor wave B may be continuing higher. A new target is calculated for it to end.
A new low in the short term below 2,697.86 would now invalidate the first two hourly charts and provide confidence in this second alternate.
This second alternate wave count is judged to have the lowest probability.
TECHNICAL ANALYSIS
WEEKLY CHART
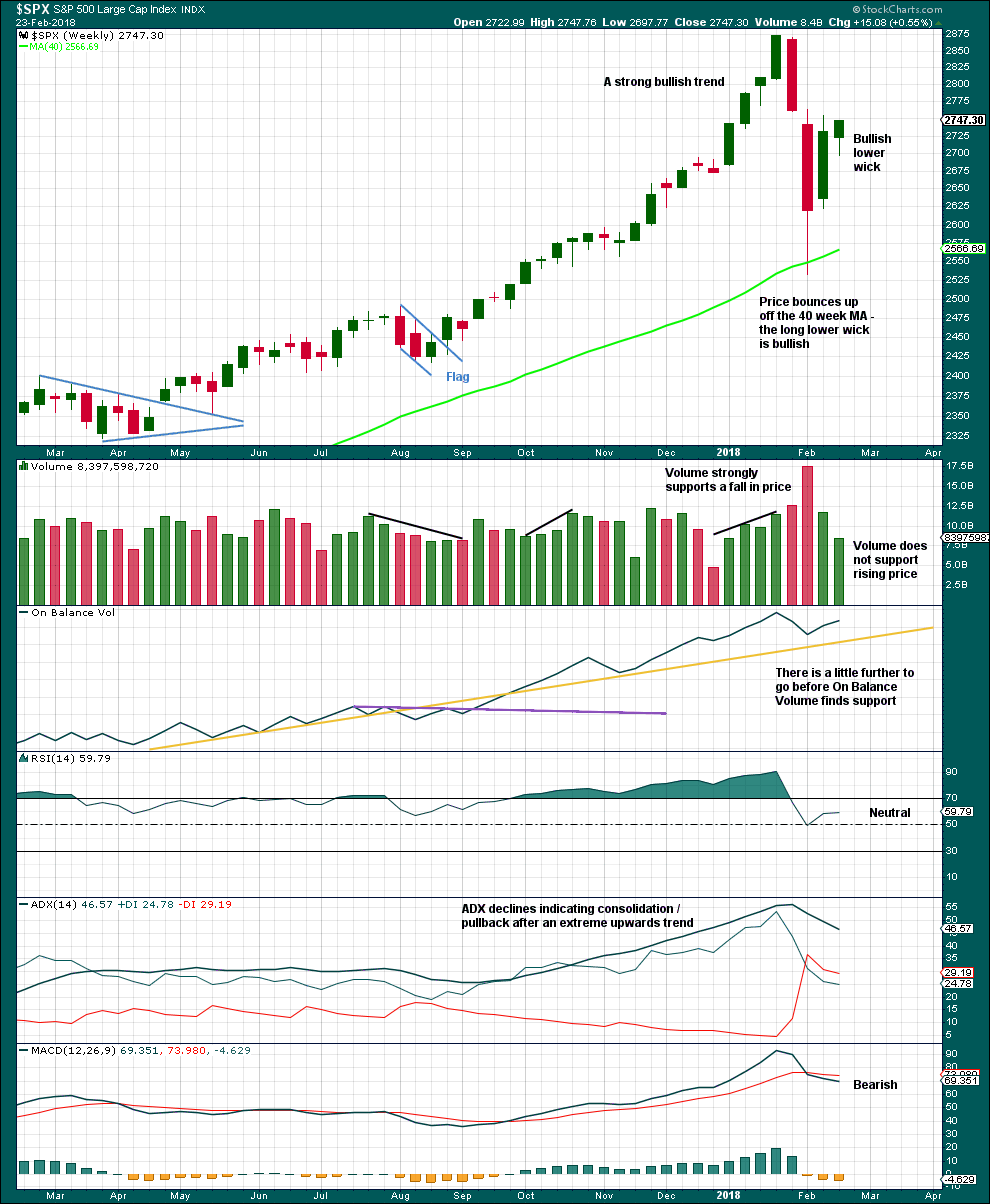
Click chart to enlarge. Chart courtesy of StockCharts.com.
Volume last week is much lower than the prior week, which is bearish.
The longer lower wick on the last weekly candlestick and the shaven head are bullish.
The pullback has brought ADX down from very extreme. A possible trend change to down is indicated, but as yet no new trend is indicated.
DAILY CHART
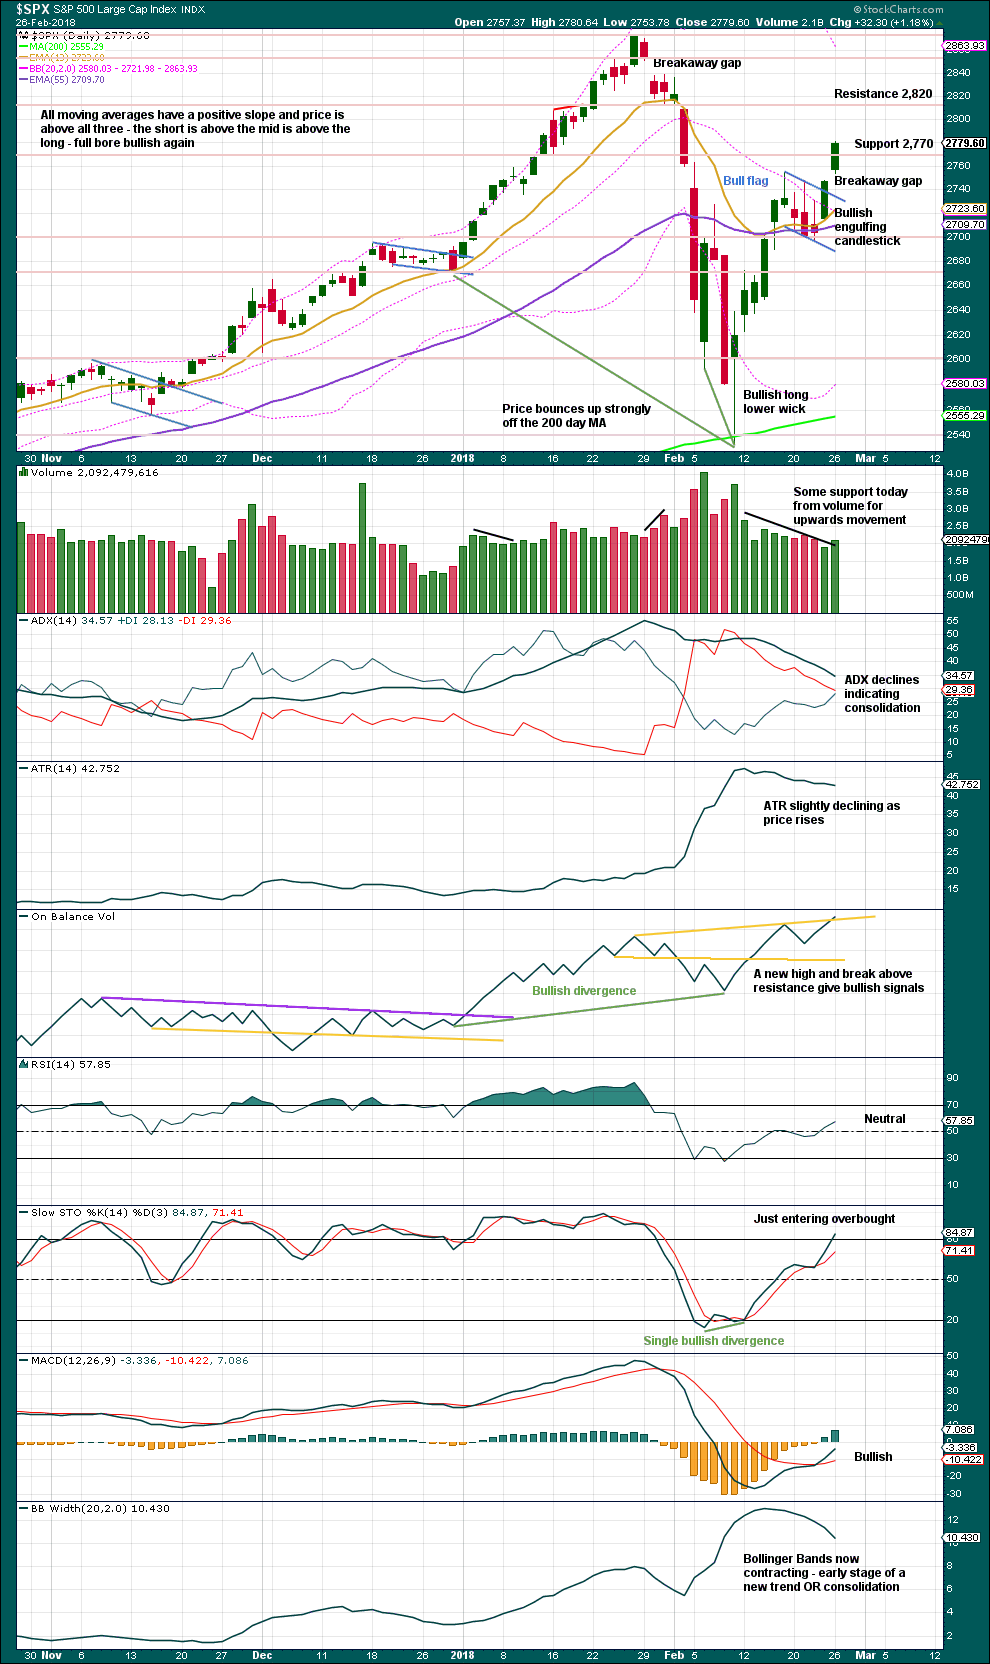
Click chart to enlarge. Chart courtesy of StockCharts.com.
Another upwards day should be expected tomorrow. Give the new On Balance Volume high weight, which is a very bullish signal.
VOLATILITY – INVERTED VIX CHART
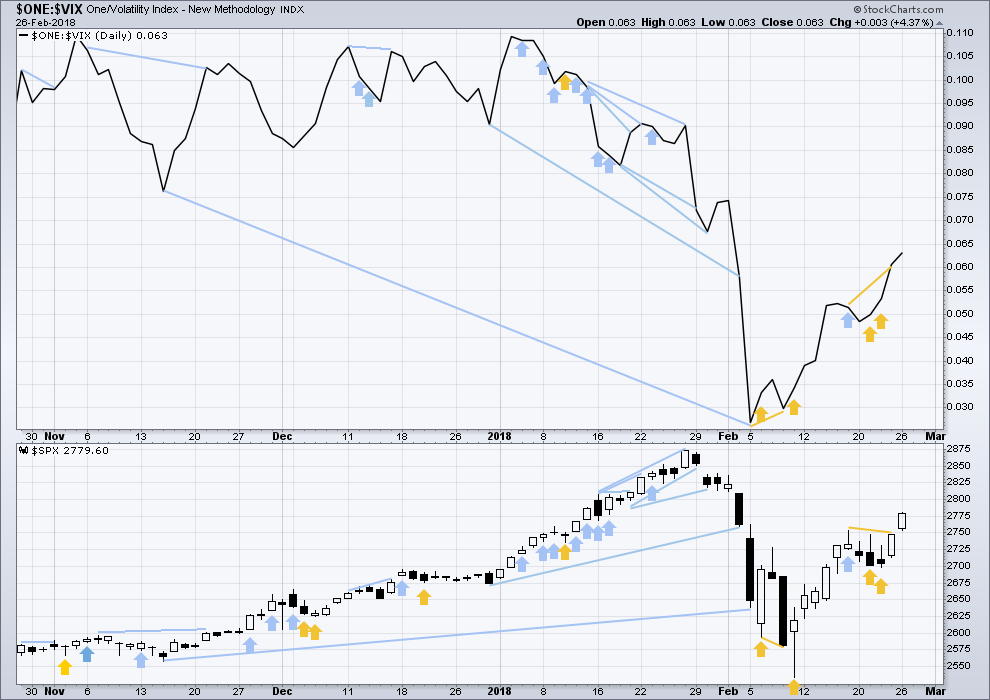
Click chart to enlarge. Chart courtesy of StockCharts.com.
So that colour blind members are included, bearish signals will be noted with blue and bullish signals with yellow.
Normally, volatility should decline as price moves higher and increase as price moves lower. This means that normally inverted VIX should move in the same direction as price.
The last bullish signal from inverted VIX has been followed by an upwards day. It may be resolved here, or it may need another upwards day to resolve it.
BREADTH – AD LINE
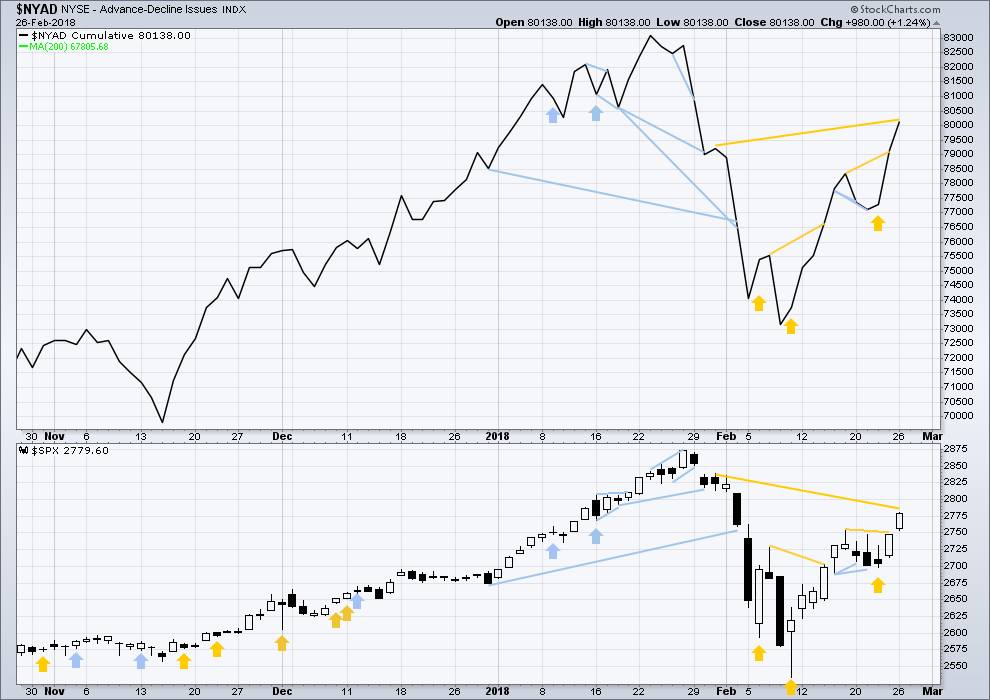
Click chart to enlarge. Chart courtesy of StockCharts.com.
There is normally 4-6 months divergence between price and market breadth prior to a full fledged bear market. This has been so for all major bear markets within the last 90 odd years. With no longer term divergence yet at this point, any decline in price should be expected to be a pullback within an ongoing bull market and not necessarily the start of a bear market.
All of small, mid and large caps last week moved upwards. The bounce has support from wide breadth.
Breadth should be read as a leading indicator.
The last bullish signal from the AD line has now been followed by an upwards day. It may be resolved here, or it may need another upwards day to resolve it.
The AD line today has made a new high above the prior small swing high of the 31st of January, but price has not yet made a corresponding high. This is a bullish signal.
DOW THEORY
All indices have made new all time highs as recently as five weeks ago, confirming the ongoing bull market.
The following lows need to be exceeded for Dow Theory to confirm the end of the bull market and a change to a bear market:
DJIA: 17,883.56.
DJT: 7,029.41.
S&P500: 2,083.79.
Nasdaq: 5,034.41.
Charts showing each prior major swing low used for Dow Theory are here.
Published @ 07:02 p.m. EST.
Hey Chris, looks like the whiners got what they wanted…not that it will ultimately change amything…I knew it! 🙂
https://www.zerohedge.com/news/2018-02-27/did-fed-save-wall-street-temporary-qe4
When that ceases to occur God help us!
All we know this might be the start of multi week correction already…tough part is we will only know that once we are below 2,700 and with so much noise around it gets harder. Do we know at what price did Buffet’s manager picked a few Apple as it did drop to $150. ..assuming $150, they are already sitting on 20% profit…
For you fans of volatility, some changes are in the works. Looks to me like they know something! 🙂
http://www.proshares.com/news/proshare_capital_management_llc_plans_to_reduce_target_exposure_on_two_etfs.html
Vern, I signed back in to post this for you and I see you already posted on this.
Amid AUM Exodus, ProShares Slashes VIX ETF Leverage
https://www.zerohedge.com/news/2018-02-27/amid-aum-exodus-proshares-slashes-vix-etf-leverage
hahahaha, lol!!!!
Funny ain’t it?
Thanks Joe…
Okay so that was an ugly close for the bulls. With the gap now being a pattern gap rather than a breakaway I admit the picture turns a little more bearish. Still having trouble seeing how the 1 year + outlook could be bearish in the face of extremely bullish technicals and fundamentals, but we’ll see. On balance volume making a new high yesterday in the absence of price making a new high demonstrates the big pockets are still buying at this stage. Buffet just picked up more AAPL (a stock which made a new high today and is a major leading indicator for this bull market). Not sure what to think but I’ve beens topped out of my short term longs. Still liking Lara’s main count. The next fibonnaci level for me is 2730-2740, which also happens to be the 50-day, so if we spend much time below there tomorrow I will have to exit more of my longs.
I’ll label yesterdays opening gap as a continuation gap now.
If the first gap was the breakaway gap (and not a pattern gap as I first labelled it) then yesterdays gap is about halfway through the last wave up.
Which is now closed.
The market makers are very adept at misleading the unwary.
Taking triples on short trades today and holding long side of bear call credit spreads in case we get a nasty reversal overnight. Have a great evening everyone! 🙂
They are relentless, and the jig will be up soon for everyone
I don’t really understand what “the jig” is here. We are 200+ points off the lows, so seems to me the only ones being fooled by the market makers are the bears.
No offense Bo, but classifying people as bulls or bears is just as silly and misguided as classifying and dividing people based on political ideology. Further, as a professional, who has HFT, Market Making, Stat Arb, AI and Momentum strategies through managing our hedge funds, and have had the luxury of experiencing pit trading at Morgan Stanley right out of college in 2006, I believe I am fully dialed into the pulse of market structure and market participants. Therefore, “the jig” I’m referring to is the use Control P money passed through from the FED to banks with large market making desks to hold the indexes up. The sell-off today was a flawless example of that; kissing the algos as they drove the market lower, in a very managed decline fashion. Further, “the jig” is also self-evident in the position of commercial short index futures at record numbers short beginning in July 2016. Here, the jig is inducing the market makers to cover said shorts with control p funds to help the market gap up at open and to offset overnight declines. There are even specific times in overnight action; 12am, 3:30am, and 8am where much of this action/volume takes place. If you have a sophisticated system, highlight just the overnight futures action from July 2016 to present on the SPX. Also, I do happen to have multiple masters, series, CMT, etc and love my role and try to be humble and learn to improve everyday. As evidence by the short interest, there are NO BEARS left. I’m happen to share my YTD PA account PNL if you so desire, and maybe you’ve noticed Verne and I posting near constant doubles and triples.
Okay, well thank you for elaborating, I meant no offense, Chris. I don’t have a problem with anything you said here, but I do have a problem with some of the permanently bearish attitudes displayed here that can mislead naive traders. Making doubles and triples off managed declines in an uptrend is entirely different than saying “we are imminently about to enter a bear market and will eventually bottom below the 2009 lows.” I don’t mean to pick on anyone here, but Verne has been repeating “permabear” outlooks since I joined this forum in May 2017, and from the looks of past posts, it goes back much further than that. Clearly he has not been trading long term bearishly though–Verne posts many interesting day trades that have been successful and captured some of the dips in this bull market. That is a testament to his day trading skill though and has nothing to do with perceiving month-to-month trends. The market has shot up over 20%, from 2330 to 2870, in that timeframe.
I also have a problem with conspiracy theorist attitudes expressed towards bankers and market makers. In a massive market with many competing players, I don’t even see how a deliberate conspiracy is possible. They may all be acting in a similar fashion which contributes to emergent properties that force the market up, but this is very different than saying “the banksters are intentionally screwing up the markets.” I realize the Fed has been printing money non-stop since 2008, but frankly it seems like the people who think the “jig” is up now are the same people who said QE1 wouldn’t work, or that QE2 wouldn’t work, or that QE3 wouldn’t work, that any interest rate increases would tank the market in 2015, and that the balance sheet reduction would tank the market in September 2017. People have been saying “the jig is up” since 2000. Robert Prechter, perhaps the greatest disciple of Elliot Waves, has been structurally bearish since 1987 and especially post-2000. I see no evidence why current market forces are imminently about to break and send us hurtling below SPX 666. If you have evidence for why this is about to occur now, and why, I would be very interested to see it. Could you show it to me?
Thanks Bo, and I’ll defend VERNE here for a minute. It is impossible to have a fundamental or historical valuation basis that is not presently super bearish on a macro level, and has been since the FeD really began manipulating everything when trader Simon Peters joined in 2015. Make no mistake, the business cycle and human psychological cycles are real and ultimately will over power central planners. You can call it conspiracy but choosing to ignore fact is naive and unscientific. I have loads of evidence that the largest de-leveraging in man kinds history will occur at some point in the intermediate term, and thus the largest bear market. All you have to do is look at the bond market which is too large for the central banks to manipulate. That being said, that does not mean I or VERNE trade only from a bearish perspective. If you’d like more objective evidence I am happy to share but please ask Lara for my contact. Moreover, you really shouldn’t over think it, it’s just time……
Thanks for the information. I am interested to hear more about the following:
“I have loads of evidence that the largest de-leveraging in man kinds history will occur at some point in the intermediate term, and thus the largest bear market. All you have to do is look at the bond market which is too large for the central banks to manipulate… If you’d like more objective evidence I am happy to share but please ask Lara for my contact. ”
My email is “bolives1969@gmail.com”. Feel free to send a message my way with any additional evidence, resources, etc. you have.
all right, Gartman’s long again, doubling down on short positions. Also, VIX rallying off of the 50 day
Hi Chris. For reasons that you can well imagine, I am not saying too much, just watching the charts…! 🙂
Yikes, Gartman long? Never a good sign… Going to be watching the Monday gap and and VIX finish here. If the gap is closed and VIX finishes at a high I could see significantly more downside here. Otherwise this just looks like a 2.
Hourly chart updated:
I’ve checked the subdivisions of minuette (c) on the one minute chart. Although it’s a bit problematic, it fits as a complete impulse. It won’t fit as a diagonal.
Within the impulse there is a disproportionate second and fourth wave at micro degree. On a very low time frame I’ll accept that.
But what that means is… I could be wrong here. Minute ii may certainly continue lower.
It could also continue lower as a double zigzag.
However, the pattern lately has been for corrections to be brief and shallow, so let us err on the side of expecting that pattern to likely continue.
Hi Lara
After this hits your target of 2920 – 3020 for the 3 with the circle around it and the (5) below that.
Do you expect a multi week correction after that?
Do you expect a multi week correction after the Blue 3? or after the Circle 3.
Thank You
Minor 2 was over in just three days, so I wouldn’t expect minor 4 to be multi week. Only a few days.
Primary 2 lasted 10 weeks, so primary 4 could be as long lasting. Or it could be quicker but travel a great distance in terms of price, like intermediate (4) did. Either / or would still give the count the right look at weekly and monthly time frames.
Good to have Lara here early–dedication!
Thanks for the update.
Battle around 50 day being revisited. A bounce off it would be healthy and bullish. If it proves to be resistance that could be a problem for the bulls….
Is this 2 finishing, or A finishing?
Did you mean “B”?
So far it looks to me like the 2 finishing. Perfect A-B-C correction finishing in my range. We’ll see.
I’m still learning, is it Verne’s job to mess with us?
ROTFLing here!!!!
Yep! You are most perceptive, sir!!!
I looked at Lara’s analysis and assumed you might have been referring to the alternate. Obviously you were talking about an “A” of a minor two correction.
I believe it is
Just FYI, Verne is a permabear but seems to often be on both sides for swings and day trades. He often opts to follow the bearish alternates here rather than Lara’s currently bullish main count. Not to be critical–just pointing out so you don’t get confused. The alternates could very well be correct but as of this moment, Lara’s main count is calling this move minute 2 of a minor 3, i.e. lots more upside here, and soon. On the other hand, if the alternate is correct and this is minor B of an intermediate 4 kicking off, then we’re headed below 2530 and a potential bear market. In Lara’s opinion, classical technicals support the main count, but you never know.
Well, to be fair, I’m really trying very hard to not have a personal opinion. I’m trying to weigh up the evidence in the technicals and go with the balance of probability.
The problem of course with that is I can go with a balance of probability and expect a higher probability outcome, but that does not mean I can’t be wrong. Low probability outcomes do occasionally occur. And when they do occur, they’re never what was expected as most likely.
Bo you are on fire today keep those calls coming!!
The short answer is “that can’t be known in advance”. There is a “more” and “less” likely answer, but even that is dependent on which EW model you view as “most likely”. Yes the 2 may be over here…or not. It filled yesterday’s gap and turned; indicates “yes”. It didn’t turn on a fibonacci retrace price level; indicates “maybe not”. As to whether it is a complete 2 or just the A of an ABC down, unknowable at this point in time. In my opinion anyway. As for Verne messing with us, well, keeping us on our toes is something he does, yeah. Always good to think about the bear scenario!
UPDATE: well, I guess that price action pretty much answers those questions!!! Fortunately I loaded up on some upro just minutes before…
What Kevin said.
Exactly so.
*Updated edit:
except for the last part. I wouldn’t be so sure there….
You are right of course, that price spike doesn’t answer the questions, but adds some significant weight to one answer. I’ve bet on it anyway…let ‘er rip!!
I know this isn’t the place for this but just in case…my ThinkorSwim platform SPX chart is showing different values today than my interactivebrokers charts, due to an adjustment it seems to be making for dividends. (Definitely such adjustment is “off” on my IB charts). I’ve found and set the global chart setting in ToS to “none” for dividend adjustment…and the chart display is still wrong. Not sure why or what to try next. Any suggestions welcome. Argggh.
Ameritrade corrected their improper SPX reporting values suddenly in the course of that big upspike in SPX price. Started off by 12 points…ended up correct. Tracking correctly now. Wacko.
As expected, the action so far looks like a 5-up. That means I’ll be looking for a 3-down to the 2750-2760 range for a single day (or even intraday) correction. Then minute 3 should kick off to end the week with a bang! Classical technicals look incredibly bullish going forward. Definitely think we’ll test the gap but leave it unclosed.
That would work for me. I’d like to get back into an hourly timeframe long on SPX at a bit lower levels, and use that same to add to my daily and weekly timeframe longs.
looks likes its happening for ya
Hi Bo
It looked like your call worked out.
It hit that range.
What are you expecting the upside target to be?
Thanks
🙂