
Upwards movement was expected for Friday due to bullish signals from the AD line and VIX. A strong upwards day fits the expectation nicely.
Summary: The larger trend is up. The next target is at 3,020.
The next short term target is at 2,920. Expect upwards movement next week.
Always practice good risk management. Always trade with stops and invest only 1-5% of equity on any one trade.
The biggest picture, Grand Super Cycle analysis, is here.
Last historic analysis with monthly charts is here. Video is here.
An alternate idea at the monthly chart level is given here at the end of this analysis.
An historic example of a cycle degree fifth wave is given at the end of the analysis here.
MAIN ELLIOTT WAVE COUNT
WEEKLY CHART
Click chart to enlarge.
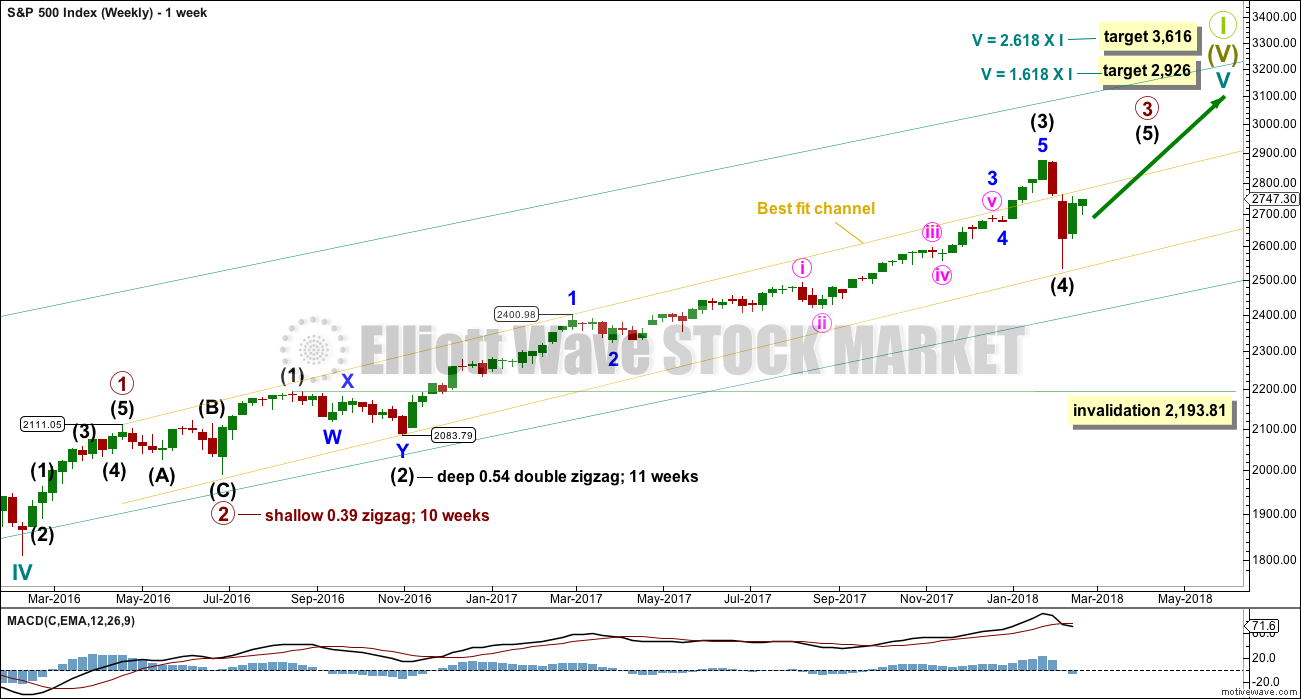
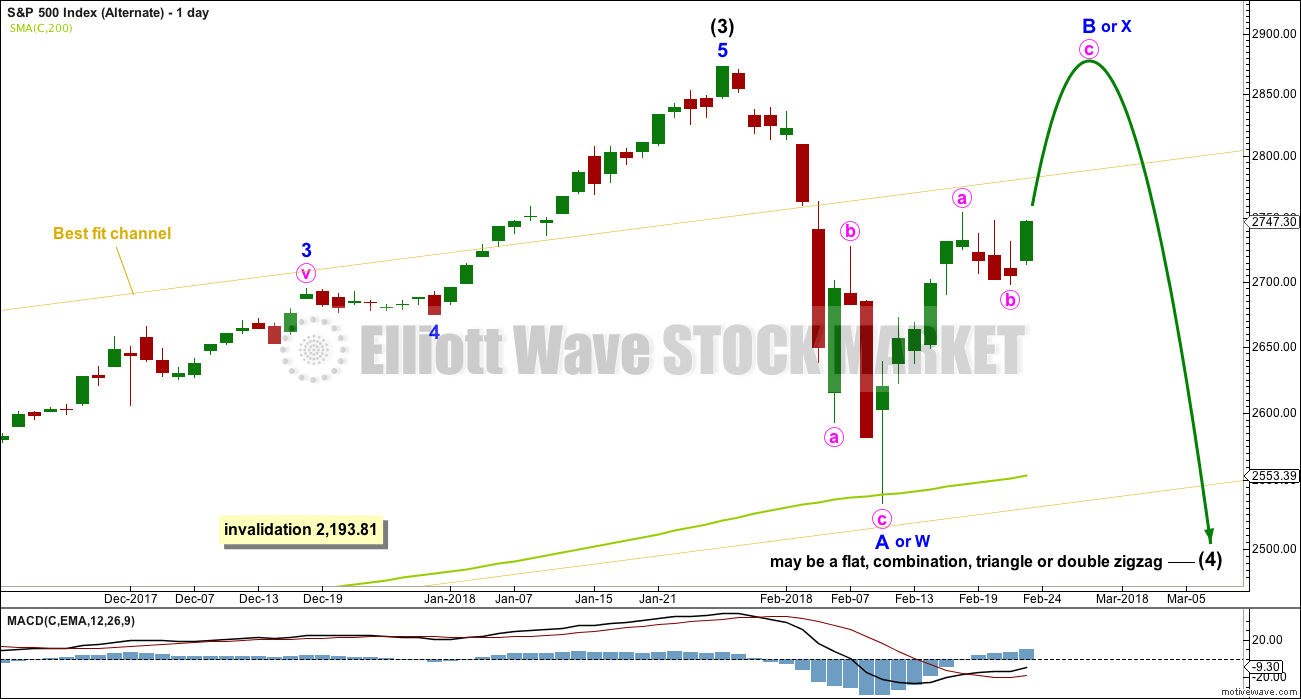
Cycle wave V must complete as a five structure, which should look clear at the weekly chart level. It may only be an impulse or ending diagonal. At this stage, it is clear it is an impulse.
Within cycle wave V, the third waves at all degrees may only subdivide as impulses.
Due to its size intermediate wave (4) looks proportional to intermediate wave (2), even though their durations so far are quite different.
Intermediate wave (4) has breached the Elliott channel drawn using Elliott’s first technique. The channel may be redrawn when it is confirmed as complete using Elliott’s second technique. A best fit channel is used while it may still be incomplete to show where it may find support. Price points are given for this channel, so that members may replicate it on a semi-log scale.
Intermediate wave (4) may not move into intermediate wave (1) price territory below 2,193.81.
DAILY CHART
Click chart to enlarge.
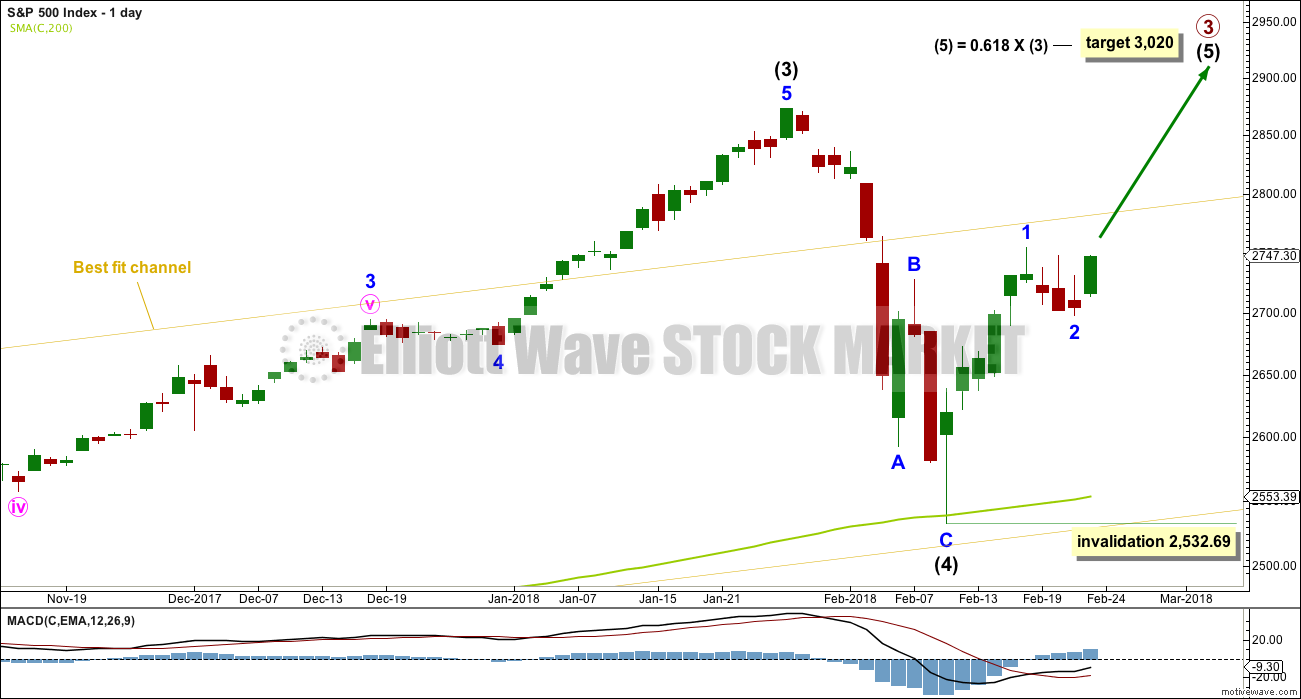
Despite the duration of intermediate wave (4) being much quicker than intermediate wave (2), the size is proportional. On weekly and monthly time frames intermediate wave (4) now has the right look.
Intermediate wave (5) may only subdivide as either an impulse (more likely) or an ending diagonal. An impulse will be assumed, and a diagonal will be charted if overlapping begins to indicate it.
The downwards wave labelled intermediate wave (4) may be seen as either a three wave zigzag, as labelled on this daily chart, or it may be seen as a five wave impulse. Both possibilities must be considered. The main hourly and alternate hourly charts consider it as a zigzag. The second alternate hourly chart considers it may have been a five.
HOURLY CHART
Click chart to enlarge.
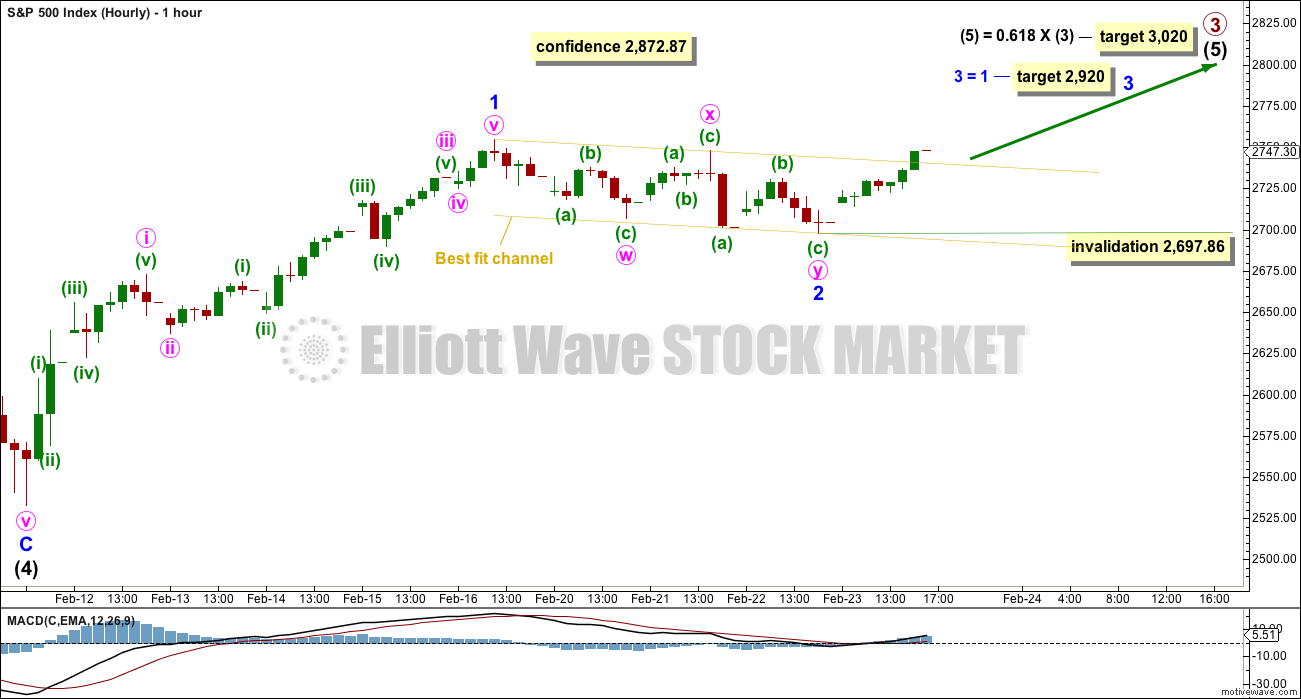
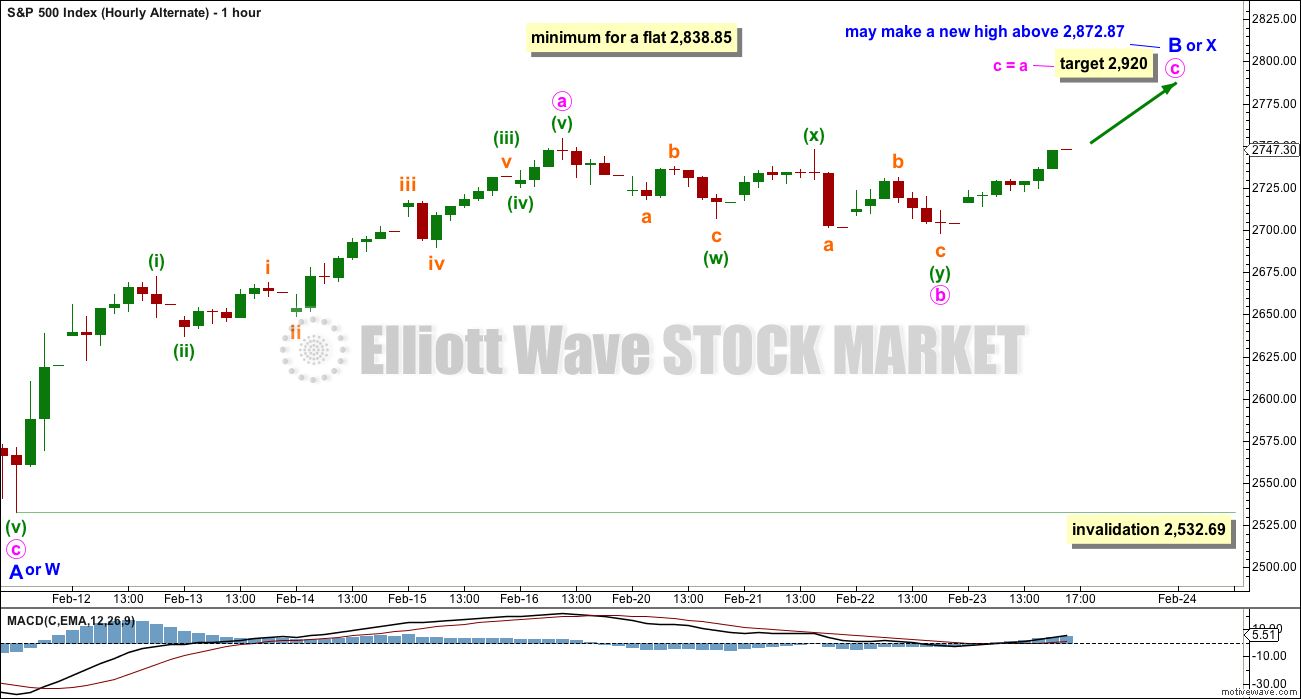
A new all time high would add confidence to this wave count (even though an alternate idea published would remain valid).
It is possible that minor wave 2 may be a relatively brief and shallow correction. This has been a feature of this bull market up until the arrival of intermediate wave (4). It may again be a feature of this market during intermediate wave (5).
Minor wave 2 now subdivides very well as a double zigzag, which may be complete at today’s low. This fits neatly into a small channel.
Price may be breaking above the upper edge of the best fit channel. If a full hourly candlestick can close above and stay above (not touching the channel), then increased confidence may be had that minor wave 2 should be over. At that stage, minor wave 3 upwards should be assumed to be underway. Minor wave 3 would reach equality in length with minor wave 1 at 2,920. This is a reasonable short term target. The last hourly candlestick for Friday does appear to be reasonably strong.
Within minor wave 3, no second wave correction may move beyond the start of its first wave below 2,697.86.
HOURLY CHART II
Click chart to enlarge.
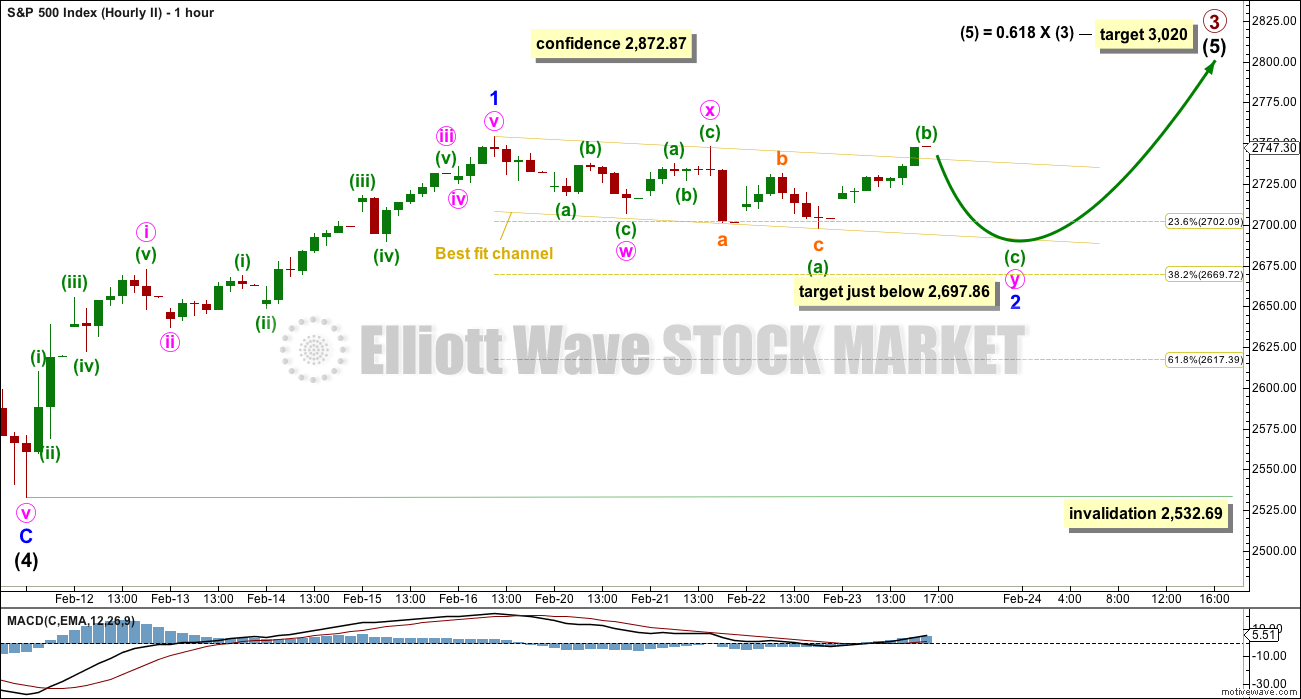
This hourly chart does not have support this week from classic technical analysis. It is provided only to be used if the first hourly chart is invalidated, which at this stage looks extremely unlikely.
It is possible that minor wave 2 may not be over and may continue further sideways and a little lower as a double combination.
The first structure in the double is a zigzag labelled minute wave w. The double is joined by a three in the opposite direction, a zigzag labelled minute wave x. The second structure in the double may be a regular flat correction labelled minute wave y.
Within minute wave y, the last wave of minuette wave (c) downwards would be very likely to end only a very small amount below the end of minuette wave (a) at 2,697.86 to avoid a truncation.
ALTERNATE ELLIOTT WAVE COUNT
ALTERNATE DAILY CHART
Click chart to enlarge.
This wave count is identical to the main daily chart, with the exception of the degree of labelling within intermediate wave (4). If the degree is moved down one, then only minor wave A may be complete within a continuing correction for intermediate wave (4).
If it continues further, and if analysis of minor wave A as a zigzag is correct, then intermediate wave (4) may be a flat, combination, triangle or double zigzag. Of all of these possibilities a double zigzag is the least likely because that was the structure of intermediate wave (2). Intermediate wave (4) should be assumed to exhibit alternation until proven otherwise.
If upwards movement continues further, then the idea of a double zigzag may be discarded. Double zigzags normally have a strong slope against the prior trend, and to achieve a strong slope their X waves are usually shallow.
All of a flat, combination or triangle would have a very deep minor wave B. An expanded flat, running triangle or combination may have minor wave B or X make a new all time high. Unfortunately, for this reason there is no upper price point which differentiates this alternate idea from the main wave count.
Minor wave B or X should be expected to exhibit weakness. Light and declining volume and divergence with oscillators at its end are features of B waves, and also of X waves which are analogous.
Minor wave B or X may be any one of more than 23 possible corrective structures, but it would most likely be a zigzag. It looks like it may be subdividing as a zigzag at this stage.
This alternate wave count would expect a strong breach of the 200 day SMA, which would be unlikely. The first expectation should be for price to find strong support there.
ALTERNATE HOURLY CHART
Click chart to enlarge.
Upwards movement off the low may be an incomplete zigzag for minor wave B. Zigzags subdivide 5-3-5, exactly the same as the start of an impulse.
If intermediate wave (4) is a flat correction, then within it minor wave B must retrace a minimum 0.9 length of minor wave A.
If intermediate wave (4) is a triangle, there is no minimum requirement for minor wave B. It only needs to subdivide as a three wave structure.
If intermediate wave (4) is a combination, then the first structure may be a zigzag for minor wave W. Minor wave X may be any corrective structure and it may make a new high above the start of minor wave W. There is no minimum requirement for minor wave X of a combination, but it would very likely be fairly deep.
Minor wave B or X may be unfolding as a zigzag. So far, within minor wave B or X, minute wave a may be a complete five wave impulse. Minute wave b may now be complete as a double zigzag. If it continues any lower, then minute wave b may not move beyond the start of minute wave a below 2,532.69.
SECOND ALTERNATE HOURLY CHART
Click chart to enlarge.
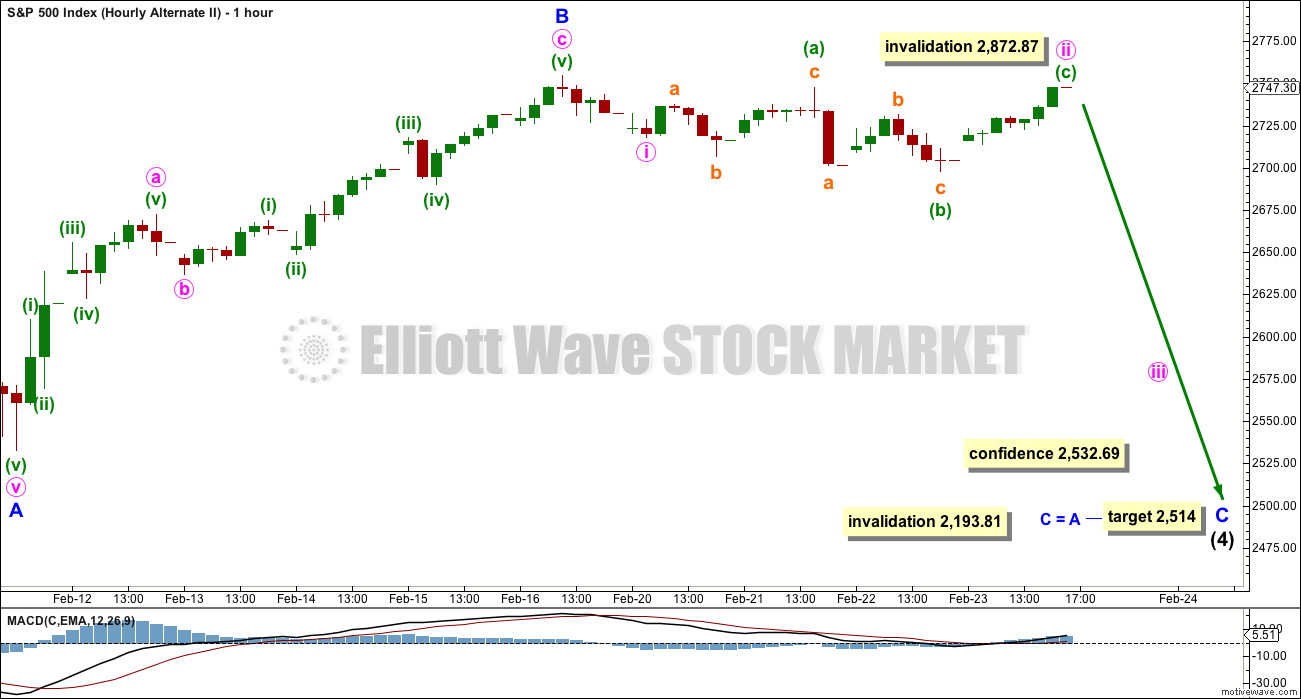
It is also possible to see the last downwards wave as a five wave impulse. Intermediate wave (4) may be continuing lower as a single zigzag, subdividing 5-3-5.
Within a zigzag, minor wave B may not make a new high above the start of minor wave A at 2,872.87.
Minor wave B may be now complete ending close to the 0.618 Fibonacci ratio of minor wave A.
Minor wave C may now be underway. However, this wave count would expect a strong breach of the 200 day SMA, which looks unlikely. The first expectation should be for price to find strong support there.
This wave count illustrates risk now to any long positions. While the main wave count is preferred and it expects a third wave up, this alternate must be accepted as possible. It expects a third wave down.
Minute wave ii may be complete as an expanded flat correction.
A new high above 2,754.42 early next week would see this alternate wave count changed to consider minor wave B continuing higher.
TECHNICAL ANALYSIS
WEEKLY CHART
Click chart to enlarge. Chart courtesy of StockCharts.com.
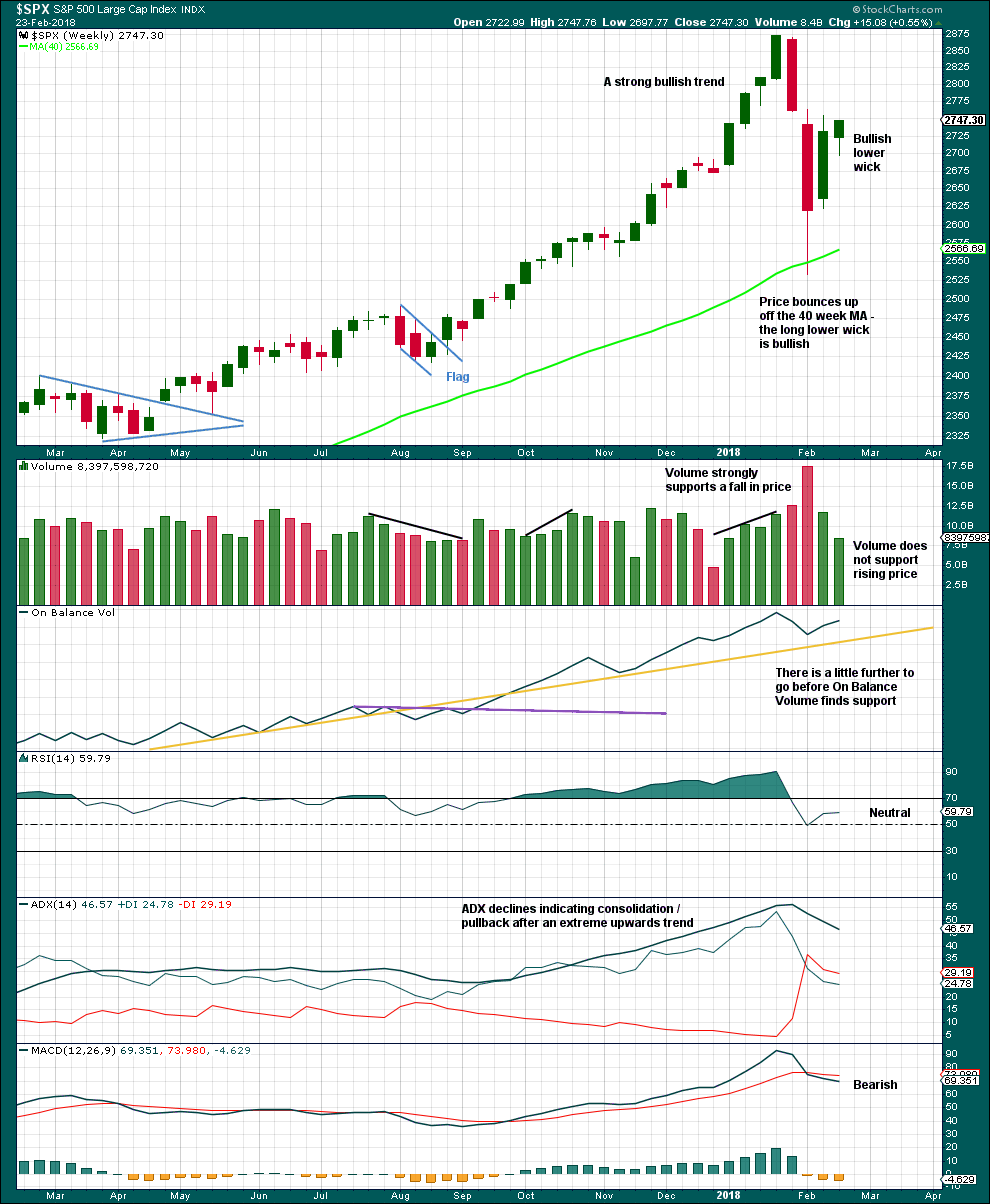
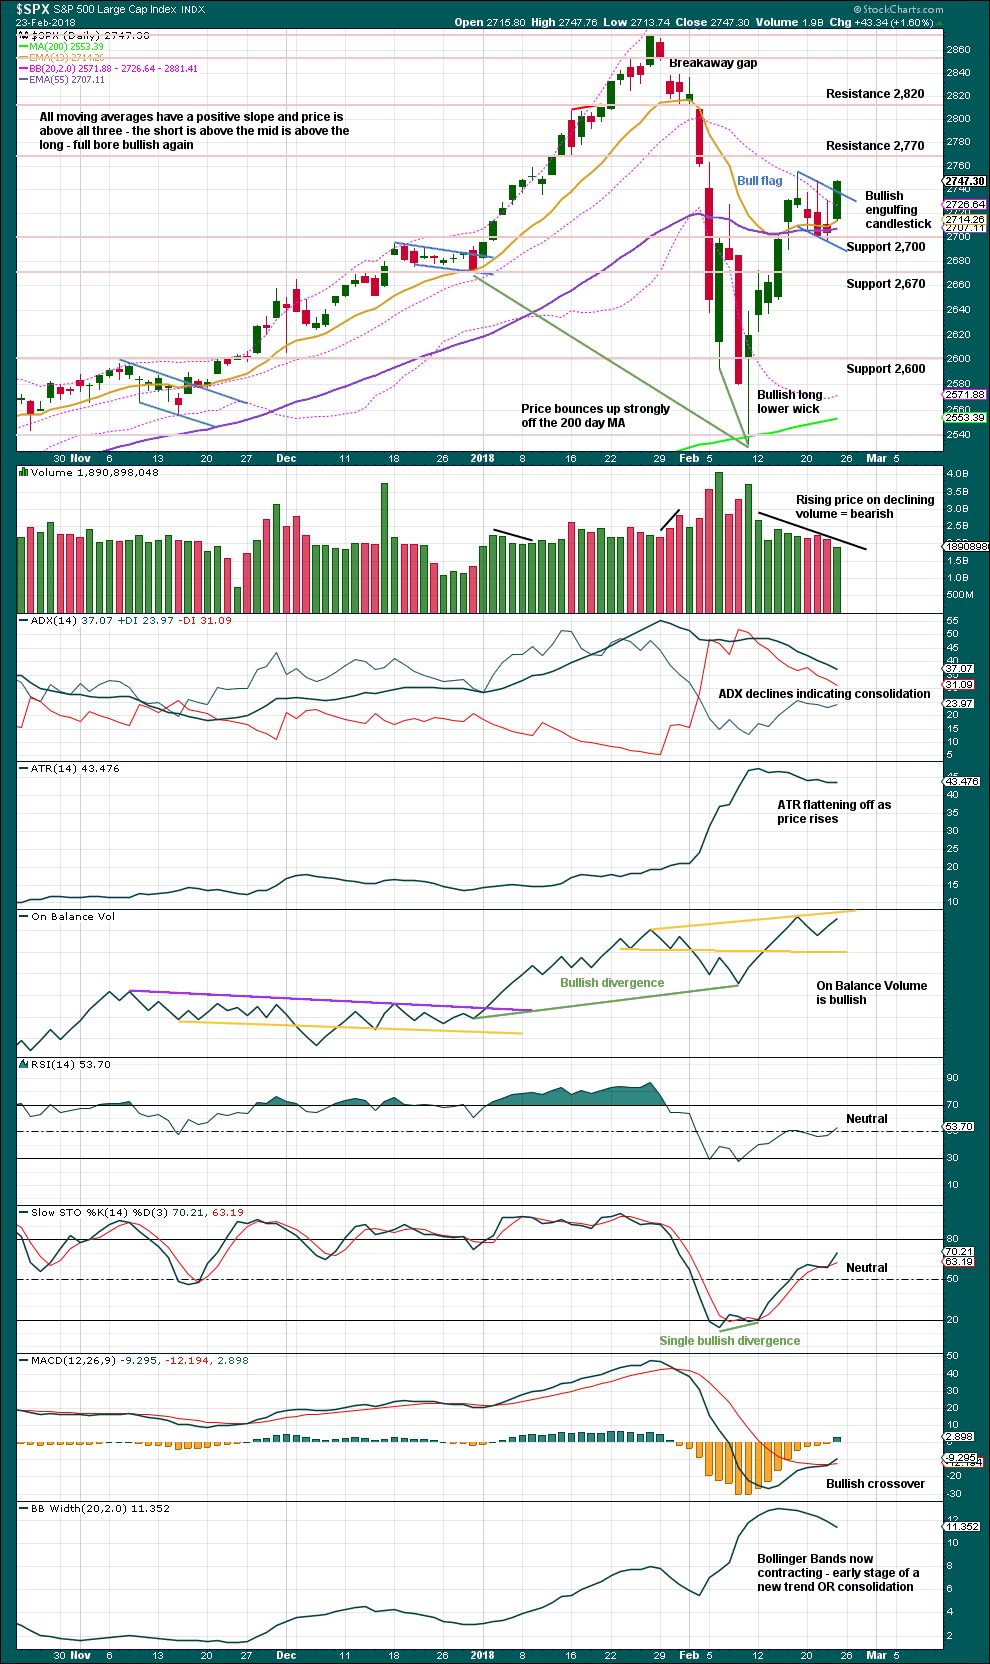
Volume this week is much lower than the last week, which is bearish.
The longer lower wick on this weekly candlestick and the shaven head are bullish.
The pullback has brought ADX down from very extreme. A possible trend change to down is indicated, but as yet no new trend is indicated.
DAILY CHART
Click chart to enlarge. Chart courtesy of StockCharts.com.
Friday’s candlestick fully engulfs the prior candlesticks of the 16th and 20th of February.
Normally, the lack of support from volume would be a concern but this has been a feature of this market at all time frames now for some years. Price has been rising on declining and light volume and may continue to do so to end the bull run.
A target using the measured rule and the bull flag is about 2,960. Flag patterns are one of the most reliable continuation patterns. This offers reasonable support to the main Elliott wave count, although the breakout on Friday does not have support from volume.
VOLATILITY – INVERTED VIX CHART
Click chart to enlarge. Chart courtesy of StockCharts.com.
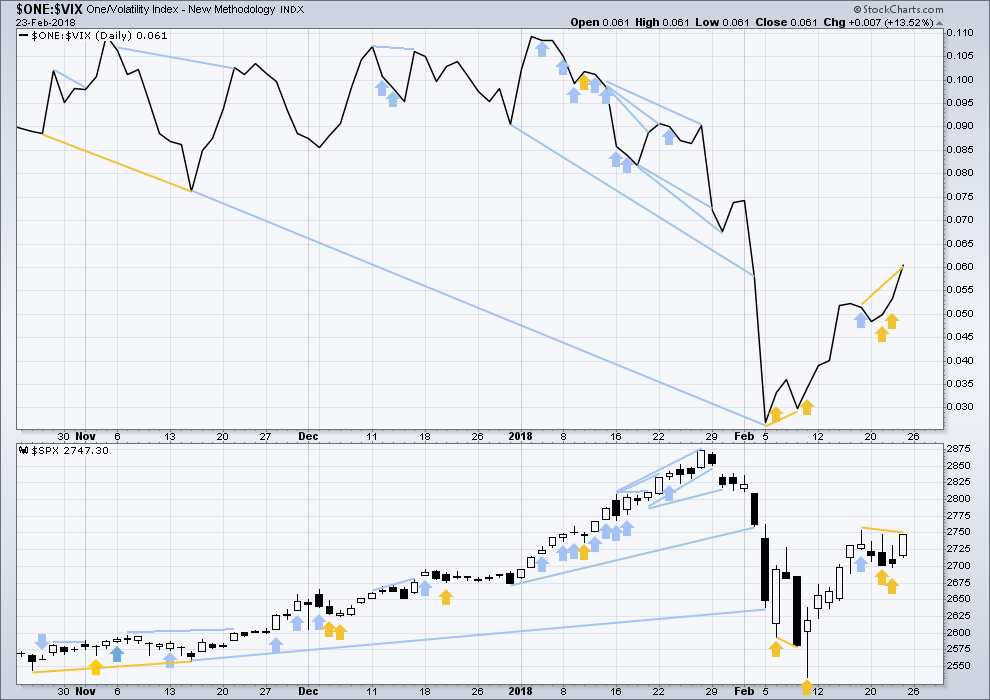
So that colour blind members are included, bearish signals will be noted with blue and bullish signals with yellow.
Normally, volatility should decline as price moves higher and increase as price moves lower. This means that normally inverted VIX should move in the same direction as price.
Inverted VIX has made a new swing high above the prior high of the 16th of February, but price has not yet done so. Inverted VIX will be read as a leading indicator. This is interpreted as bullish. This supports the main Elliott wave count.
BREADTH – AD LINE
Click chart to enlarge. Chart courtesy of StockCharts.com.
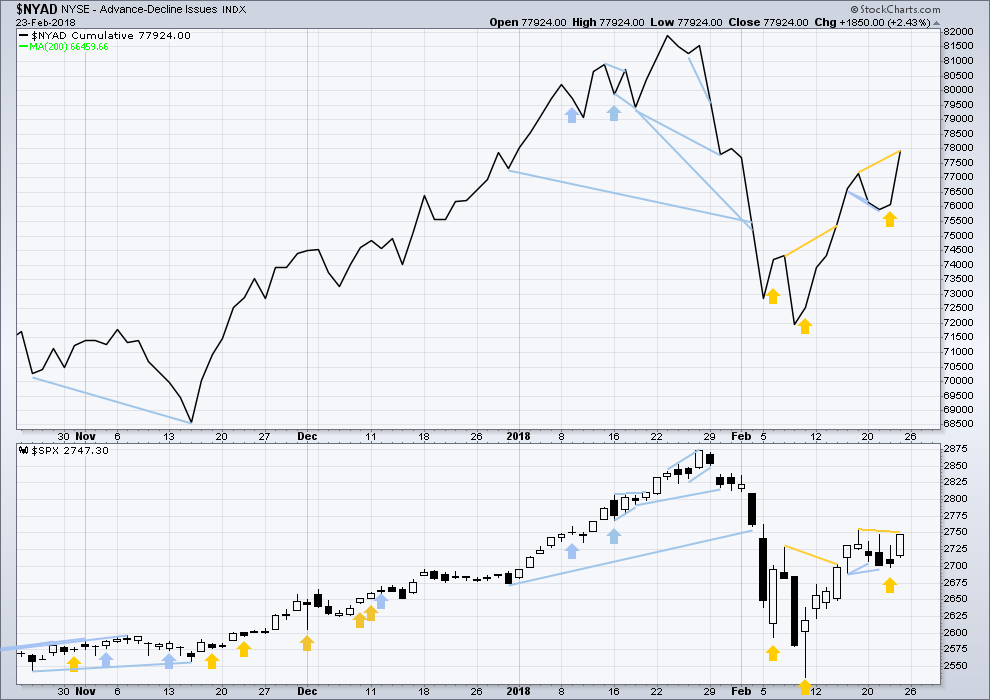
There is normally 4-6 months divergence between price and market breadth prior to a full fledged bear market. This has been so for all major bear markets within the last 90 odd years. With no longer term divergence yet at this point, any decline in price should be expected to be a pullback within an ongoing bull market and not necessarily the start of a bear market.
All of small, mid and large caps this week moved upwards. The bounce has support from wide breadth.
Breadth should be read as a leading indicator.
The AD line has made a new high above the prior high of the 16th of February, but price has not yet made a corresponding new high. This divergence is bullish and supports the main Elliott wave count.
DOW THEORY
All indices have made new all time highs as recently as five weeks ago, confirming the ongoing bull market.
The following lows need to be exceeded for Dow Theory to confirm the end of the bull market and a change to a bear market:
DJIA: 17,883.56.
DJT: 7,029.41.
S&P500: 2,083.79.
Nasdaq: 5,034.41.
Charts showing each prior major swing low used for Dow Theory are here.
Published @ 04:14 p.m. EST on 24th February, 2018.
Cashed in some short call spreads on SPX at the close today. Still holding some waiting for Powell’s testimony tomorrow. Summary will be released before the open. May or may not see a big move based on that.
Anyone got any short term targets? I see a possibly complete five wave up, which is why I cashed in some at the close. I think we could definitely keep grinding higher but if we go back to retest the gap I don’t want to be caught by surprise!
Gaps can be used in trading. This breakaway gap this morning may now provide support. Breakaway gaps shouldn’t be closed. If the gap is closed then it’s not a breakaway gap. Using that logic stops can be set just below the lower edge of the gap which is identified on the hourly chart this morning.
I hope everyone had a great weekend! I surfed for nearly 4 hours yesterday because birthday. Stoked 🙂
Yowza! What a rocket run. Cashing in some SPY 275 calls but holding bull put spreads. My eyes are firmly on upside targets. Been leaving way too much moolah on the table…yes siree! 🙂
breakaway gap Friday, continuation gap today…
I’d label Fridays gap a pattern gap because it was still within the consolidation, below resistance.
Todays gap jumps up from above resistance, so I’d label that a breakaway gap.
My opinion of course. I could be wrong… may go and read the textbooks again on gaps.
I have to say, the more I study the dollar chart and compare it with what Gold is doing, the more bearish I get on Gold and bullish on the dollar…I could be missing something…! 🙂
Agree on the Dollar being poised to rally, and rally hard. Gold looks messy….but could catch a fear bid if there ever is one
Snap Verne.
I really need to updated my USD analysis.
I can see a huge wave complete up from the low in March 2008, and it fits and looks like a three.
If that’s correct, then USD should be on its way down, hard.
Not immediately though, it could have a good bounce. My comment on USD is referring to the very large picture on the monthly chart.
I agree a BIG move is coming…. 🙂
I’m going to re-name this market, Rising Wedges.com. I’ve been trading since I was 14 and professional since 22 (now 36), and I’ve never seen so mainly on the daily charts. Selling March 13/11 bull put spread on UVXY. Getting bored….
Did you mean “Rising Wedgie.Com”? 😀
I just love impulse moves!!!! Weeeeeeee!!!! Of course, “this too shall pass”, but after a week of that big 2 sludge, this is a very welcome change!
uup and gld continue in hourly squeezes, and both are now show uptrends at the hourly level. I’m long both (though small positions), with tight stops. The big SPX hourly squeeze resolved itself awesomely to the long side Friday/today. Let’s see if gld and/or uup can replicate that performance!
I am still looking for a good entry on Gold. I would like to see a really impulsive move off a bottom. Not really liking the meandering we are seeing. It could be retesting a downtrend line so we should know soon…
Ringing the register on GE bear call spread and waiting for the next bounce.
Will roll spread to April and use same 14/15 credit spread. They are toast!
Yeah, I would gather it might be time to go the other way on that one….worth more dead than alive by my math
A second day of bonds correcting upward. Had to stop out of TMV; discretion and all that. Will take TMV again when it sets up at the hourly level. Might be a few days. My mechanical SPX system has me in fully at the daily timeframe, but not quite yet at the weekly; I have a stop buy a bit above market in UPRO for that. Hourly I should be all in but I took profit early Friday and I’M NOT DOING THAT ANYMORE (time to hunker down and trade the written plan as written). I’m waiting for a fresh set up at the 5 minute level now. My plan calls for shorting…but only at the hourly timeframe, as an “insurance policy” to mitigate losses happening at the daily/weekly level. No where close to that of course at the moment. I’m intending that a much more mechanical and multi-timeframe approach will help me layer in/out and most importantly, STAY IN when my money should be in and working. Take that fear/greed stuff out of the equation as much as possible. We’ll see!!!
Kevin, I think your call of a big 2 wave is setting up here. I show a 5 up complete or close and now at least a little quantifiable reversal. Also, small caps down on the day.
Thanks for the heads up! Let’s see how deep it goes.
Good reminder to me as well to update my UPRO stops! With 3 different timeframe systems now running (and a 4th hopefully added soon), it’s a frequent process. I entered at the 5 minute level on this turn up as well…
Either a very shallow 2 or still in the 1 I guess. My weekly system has triggered me long at the weekly level too now.
Could be a C wave; they are famous for manic, non-stop ramps! 🙂
30 Year Treasury Yield approached 3.21% and turned lower again (Major Resistance just under 3.26%). That is several times to date. If yield continues lower that means UST Yield curve will continue to Flatten as all those short Treasuries (Big Amount) will have to cover.
3.26%+ & acceleration higher from there is the key signal. I am tired of saying it but that will prove out.
Watching it closely. Will be entering TMV again when the hourly chart triggers a fresh buy.
Not at all surprising. The short trade on the 30 year is now remarkably crowded.
Important 2755 level has been taken out. Let’s see if the bulls can push this up all day.
It is starting to look like a C wave to moi! 🙂
VIX printing green today, a possible cautionary note?
I will be adding to the long side of my straddle at the open and closing short side of bear call spread. Will be holding short straddle as downside hedge…
Futures in sideways consolidation and giving the full speed ahead…”All Aboard..!”
Even if a B wave a nice move up ahead it would appear….
The dollar index is in one of the tightest coils I have seen in quite some time. A huge move is coming, and while I think I know which direction, one can never be absolutely certain. I am going to trade the move with a straddle on the Euro instead, which should see a similar move.
Scottrade moving to TD Ameritrade this weekend so
lots of housekeeping to do….again!! Just did that with OptionsXpress and Schwab!!! Why do my brokers keep getting swallowed??!! 🙂
I have UUP on the hourly in a squeeze for many hours now, with the trend indicator showing neutral. All the EMA’s (8, 21, 34) are pretty bunched up. With a little bit of up movement, trend will go green, MACD will do a bullish reversal, 8 ema will move above others. I’ll be a buyer.
I’m big fan of Interactive Brokers. IMHO, they are the most superior platform for active traders. I get way better futures, and options execution there, then anywhere else.
I second that recommendation.
The will also deliver FX trades in desired currency, as well as trading global markets. Most professional traders have an least one account with those guys! Thomas Peterffy is a great businessman! 🙂
he’s the greatest option trader of all time in mine and my partners opinions
Selling the EURUSD?
Interesting futures price action. A quite rare gap open.
Then, an even rarer subsequent gap fill.
It will be a most interesting week it seems….
Exhaustion gap? These days not necessarily…!
My goodness, so much goodness to digest in Lara’s Weekly! Awesome and thank you.
It appears the bull might roar for a bit here. My different timeframe systems are all kicking over to “be long” (weekly likely to fire on Monday). The low volume last week is concerning, but consider that 4 of 5 days last week were down/sideways days. So perhaps there’s a bit less significance to that low volume than meets the eye. Getting in relatively early in the potential launch of a new 5 up is a nice thing to achieve.
Hi Miss Lara , I know you probably meant “Minor wave three would equal minor wave one…”
Bugs
Thanks Bugs, that’s what I did mean to say. Fixed now.
I agree the classic TA is strongly bullish on the daily level. At the weekly level we are definitely seeing the beginnings of weekly divergence, but it will take much longer to see how that plays out. Friday’s relentless grind higher definitely looks like the beginning of a 3, but we’ll have to wait and see what this week brings.