
Downwards movement was expected for Thursday’s session, which is what has happened.
Summary: The larger trend is up. The next target is at 3,020.
Bullish signals today from the AD line and inverted VIX indicate the pullback is likely over.
Always practice good risk management. Always trade with stops and invest only 1-5% of equity on any one trade.
The biggest picture, Grand Super Cycle analysis, is here.
Last historic analysis with monthly charts is here. Video is here.
An alternate idea at the monthly chart level is given here at the end of this analysis.
An historic example of a cycle degree fifth wave is given at the end of the analysis here.
MAIN ELLIOTT WAVE COUNT
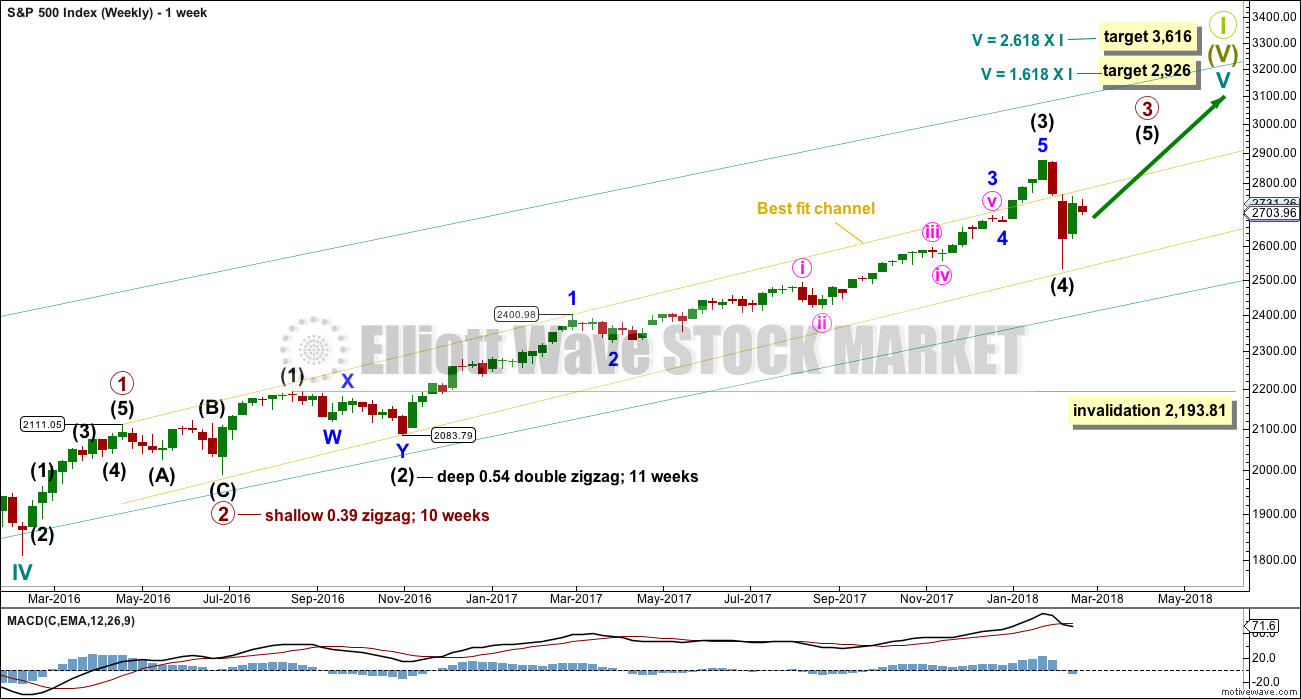
WEEKLY CHART
Click chart to enlarge.
Cycle wave V must complete as a five structure, which should look clear at the weekly chart level. It may only be an impulse or ending diagonal. At this stage, it is clear it is an impulse.
Within cycle wave V, the third waves at all degrees may only subdivide as impulses.
Due to its size intermediate wave (4) looks proportional to intermediate wave (2), even though their durations so far are quite different.
Intermediate wave (4) has breached the Elliott channel drawn using Elliott’s first technique. The channel may be redrawn when it is confirmed as complete using Elliott’s second technique. A best fit channel is used while it may still be incomplete to show where it may find support. Price points are given for this channel, so that members may replicate it on a semi-log scale.
Intermediate wave (4) may not move into intermediate wave (1) price territory below 2,193.81.
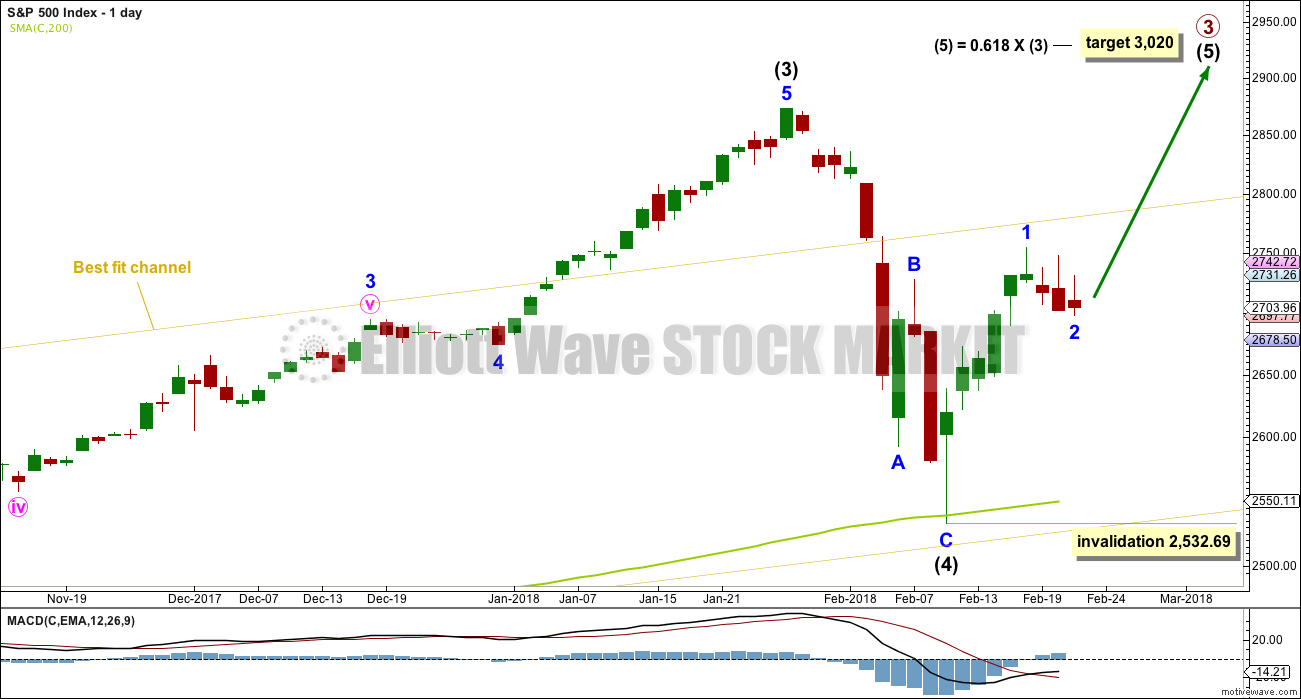
DAILY CHART
Click chart to enlarge.
The S&P has behaved like a commodity to end intermediate wave (3): a relatively strong fifth wave with a steep slope. The high looks a little like a blow off top. This is followed by a sharp decline, which is typical behaviour for a commodity and not common for the S&P.
The very long lower wick on the candlestick at the end of intermediate wave (4) is strongly bullish. It looks like intermediate wave (4) may have ended there.
Despite the duration of intermediate wave (4) being much quicker than intermediate wave (2), the size is proportional. On weekly and monthly time frames intermediate wave (4) now has the right look.
Intermediate wave (5) may only subdivide as either an impulse (more likely) or an ending diagonal. An impulse will be assumed, and a diagonal will be charted if overlapping begins to indicate it.
The downwards wave labelled intermediate wave (4) may be seen as either a three wave zigzag, as labelled on this daily chart, or it may be seen as a five wave impulse. Both possibilities must be considered. The main hourly and alternate hourly charts consider it as a zigzag. The second alternate hourly chart considers it may have been a five.
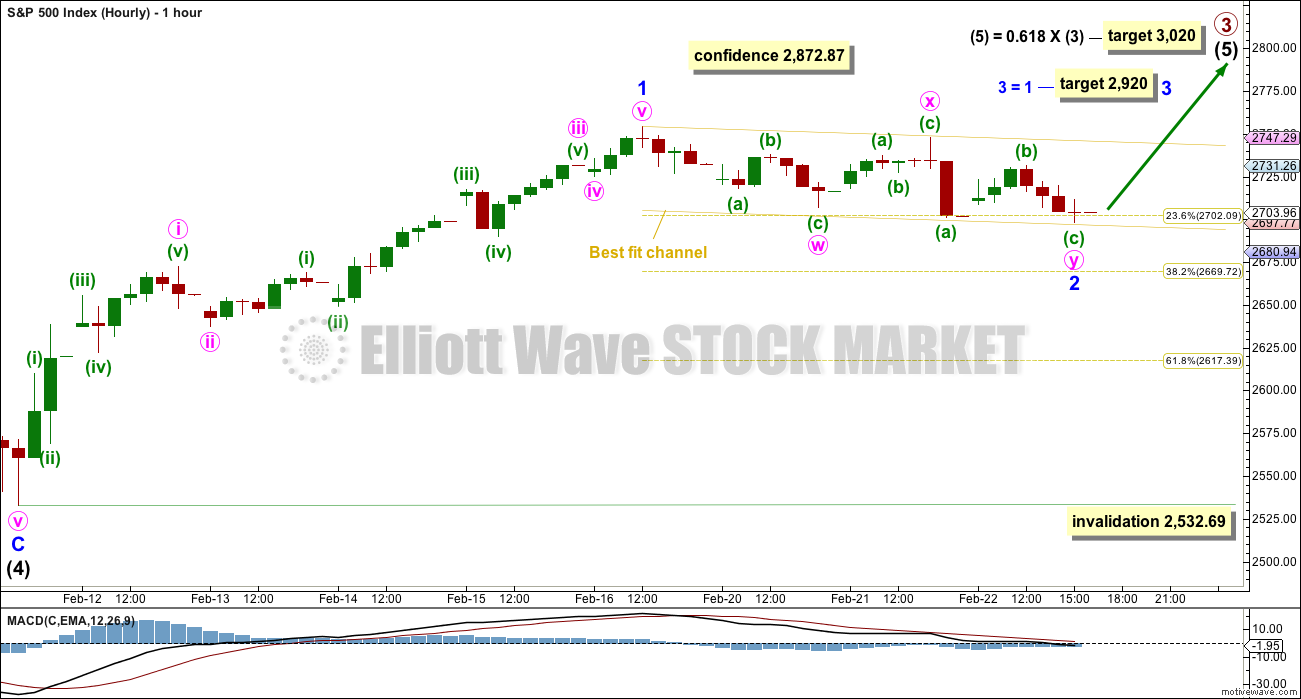
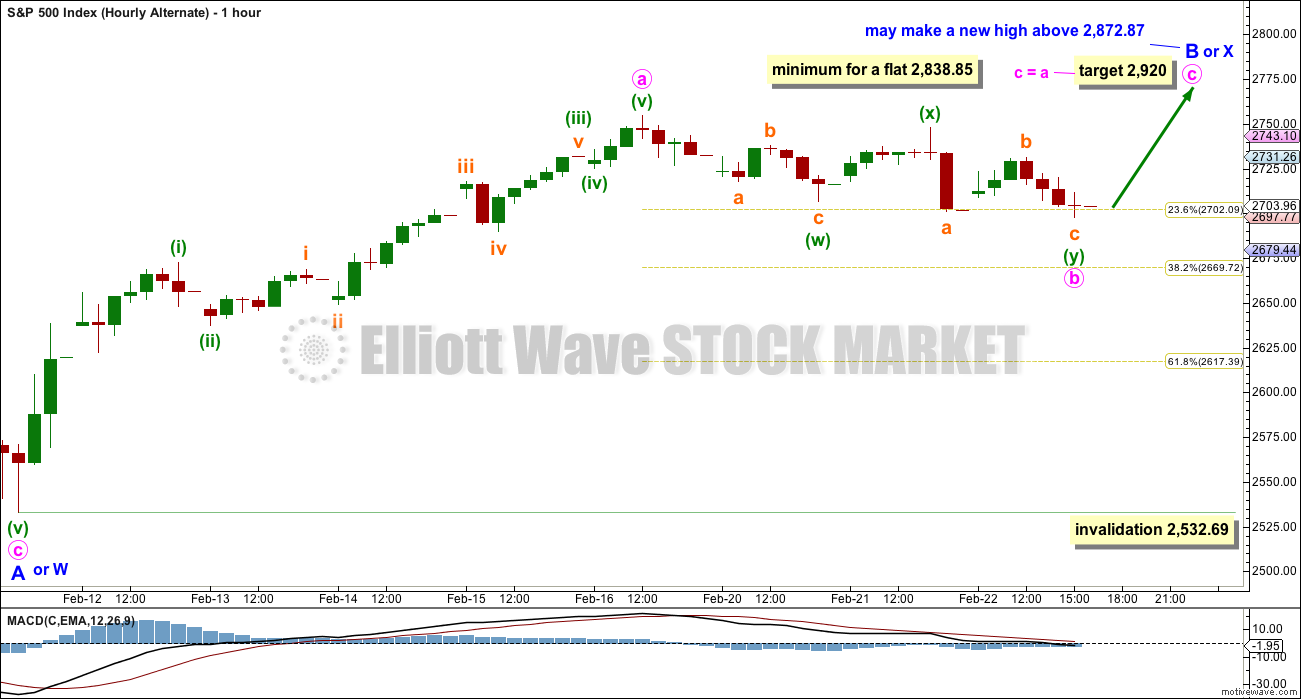
HOURLY CHART
Click chart to enlarge.
A new all time high would add confidence to this wave count (even though an alternate idea published would remain valid).
It is possible that minor wave 2 may be a relatively brief and shallow correction. This has been a feature of this bull market up until the arrival of intermediate wave (4). It may again be a feature of this market during intermediate wave (5).
Minor wave 2 now subdivides very well as a double zigzag, which may be complete at today’s low. This fits neatly into a small channel.
If price breaks above the upper edge of the channel, then some confidence may be had that minor wave 2 should be over. At that stage, minor wave 3 upwards should be assumed to be underway. Minor wave 3 would reach equality in length with minor wave 2 at 2,920. This is a reasonable short term target.
It must be accepted that minor wave 2 may not be over while price remains within the channel; risk to long positions will remain. If minor wave 2 does continue lower tomorrow, then the 0.382 and 0.618 Fibonacci ratios will be targets, favouring the 0.382 Fibonacci ratio.
Minor wave 2 may not move beyond the start of minor wave 1 below 2,532.69.
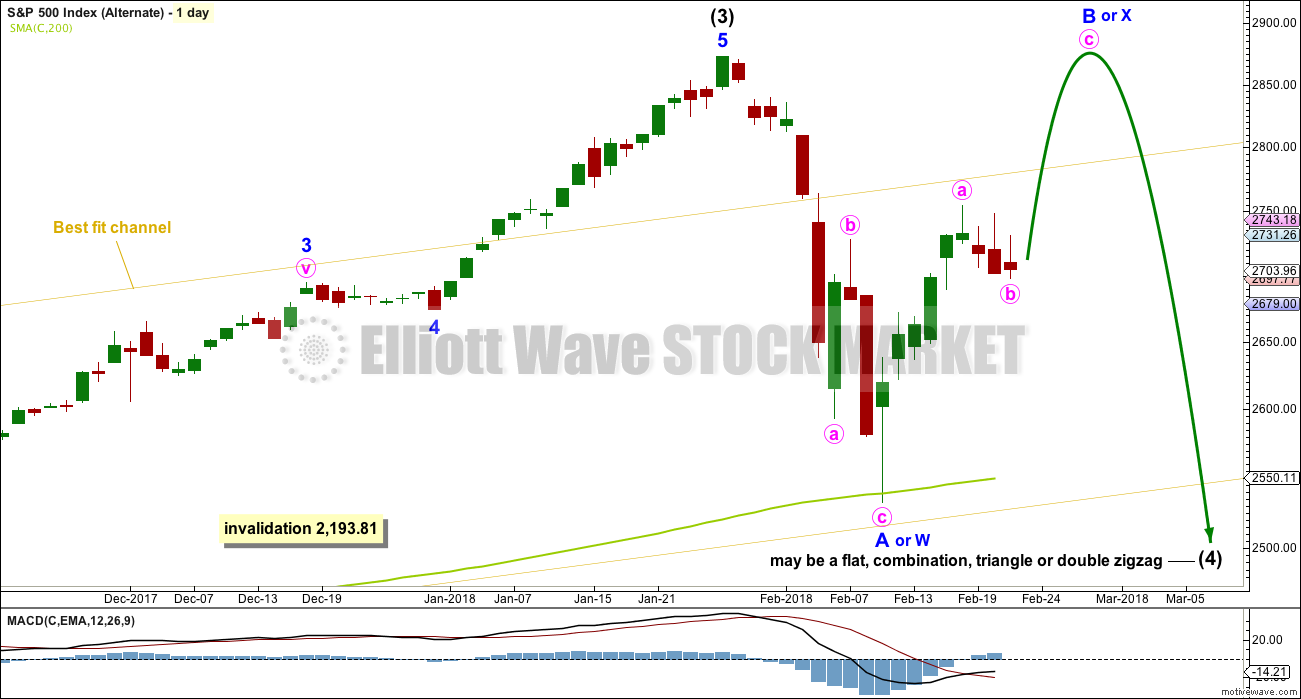
ALTERNATE DAILY CHART
Click chart to enlarge.
This wave count is identical to the main daily chart, with the exception of the degree of labelling within intermediate wave (4). If the degree is moved down one, then only minor wave A may be complete within a continuing correction for intermediate wave (4).
If it continues further, and if analysis of minor wave A as a zigzag is correct, then intermediate wave (4) may be a flat, combination, triangle or double zigzag. Of all of these possibilities a double zigzag is the least likely because that was the structure of intermediate wave (2). Intermediate wave (4) should be assumed to exhibit alternation until proven otherwise.
If upwards movement continues further, then the idea of a double zigzag may be discarded. Double zigzags normally have a strong slope against the prior trend, and to achieve a strong slope their X waves are usually shallow.
All of a flat, combination or triangle would have a very deep minor wave B. An expanded flat, running triangle or combination may have minor wave B or X make a new all time high. Unfortunately, for this reason there is no upper price point which differentiates this alternate idea from the main wave count.
Minor wave B or X should be expected to exhibit weakness. Light and declining volume and divergence with oscillators at its end are features of B waves, and also of X waves which are analogous.
Minor wave B or X may be any one of more than 23 possible corrective structures, but it would most likely be a zigzag. It looks like it may be subdividing as a zigzag at this stage.
This alternate wave count would expect a strong breach of the 200 day SMA, which would be unlikely. The first expectation should be for price to find strong support there.
ALTERNATE HOURLY CHART
Click chart to enlarge.
Upwards movement off the low may be an incomplete zigzag for minor wave B. Zigzags subdivide 5-3-5, exactly the same as the start of an impulse.
If intermediate wave (4) is a flat correction, then within it minor wave B must retrace a minimum 0.9 length of minor wave A.
If intermediate wave (4) is a triangle, there is no minimum requirement for minor wave B. It only needs to subdivide as a three wave structure.
If intermediate wave (4) is a combination, then the first structure may be a zigzag for minor wave W. Minor wave X may be any corrective structure and it may make a new high above the start of minor wave W. There is no minimum requirement for minor wave X of a combination, but it would very likely be fairly deep.
Minor wave B or X may be unfolding as a zigzag. So far, within minor wave B or X, minute wave a may be a complete five wave impulse. Minute wave b may now be complete at today’s low as a double zigzag. If it continues any lower, then it may reach down to either the 0.618 or 0.382 Fibonacci ratios. Minute wave b may not move beyond the start of minute wave a below 2,532.69.
SECOND ALTERNATE HOURLY CHART
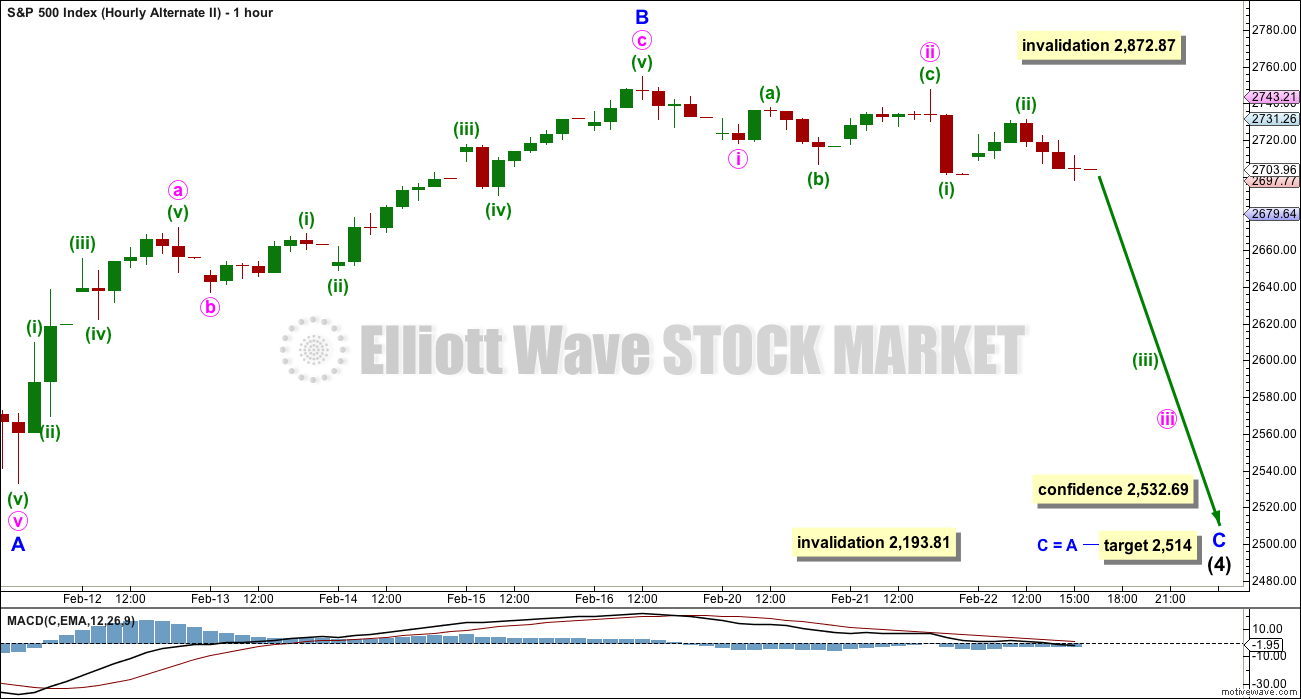
Click chart to enlarge.
It is also possible to see the last downwards wave as a five wave impulse. Intermediate wave (4) may be continuing lower as a single zigzag, subdividing 5-3-5.
Within a zigzag, minor wave B may not make a new high above the start of minor wave A at 2,872.87.
Minor wave B may be now complete ending close to the 0.618 Fibonacci ratio of minor wave A.
Minor wave C may now be underway. However, this wave count would expect a strong breach of the 200 day SMA, which looks unlikely. The first expectation should be for price to find strong support there.
This wave count illustrates risk now to any long positions. While the main wave count is preferred and it expects a third wave up, this alternate must be accepted as possible. It expects a third wave down.
Downwards movement for this session lacks strength at this stage. This does not look like a third wave down. However, this could certainly change when markets open tomorrow. If downwards movement begins to show reasonable strength at the hourly chart level, then this wave count would increase in probability.
TECHNICAL ANALYSIS
WEEKLY CHART
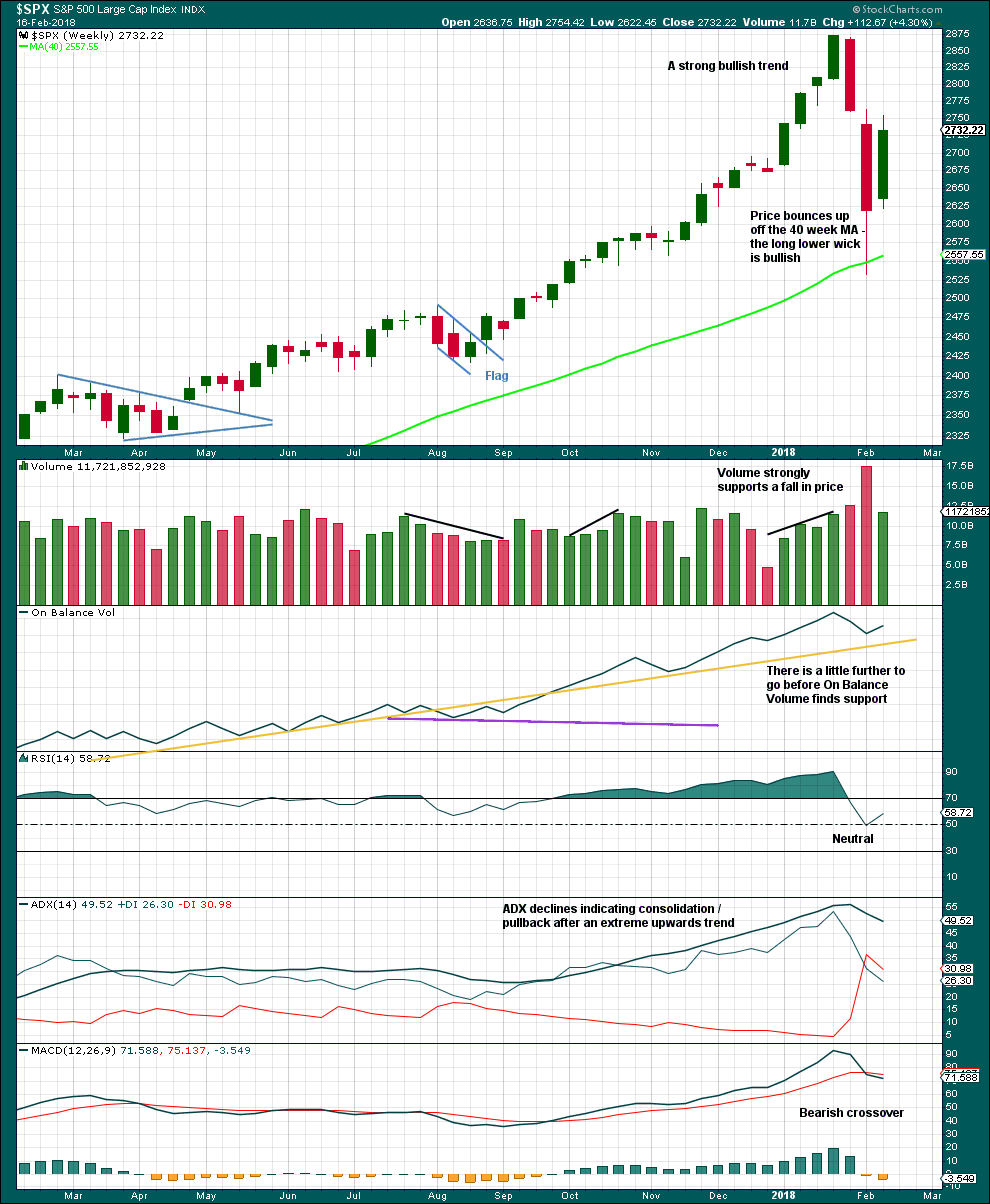
Click chart to enlarge. Chart courtesy of StockCharts.com.
Volume this week is much lower than the last downwards week, which is bearish, but it is stronger than the previous four upwards weeks, which is bullish.
There is nothing bearish about this weekly candlestick.
The pullback has brought ADX down from very extreme. A possible trend change to down is indicated, but as yet no new trend is indicated.
DAILY CHART
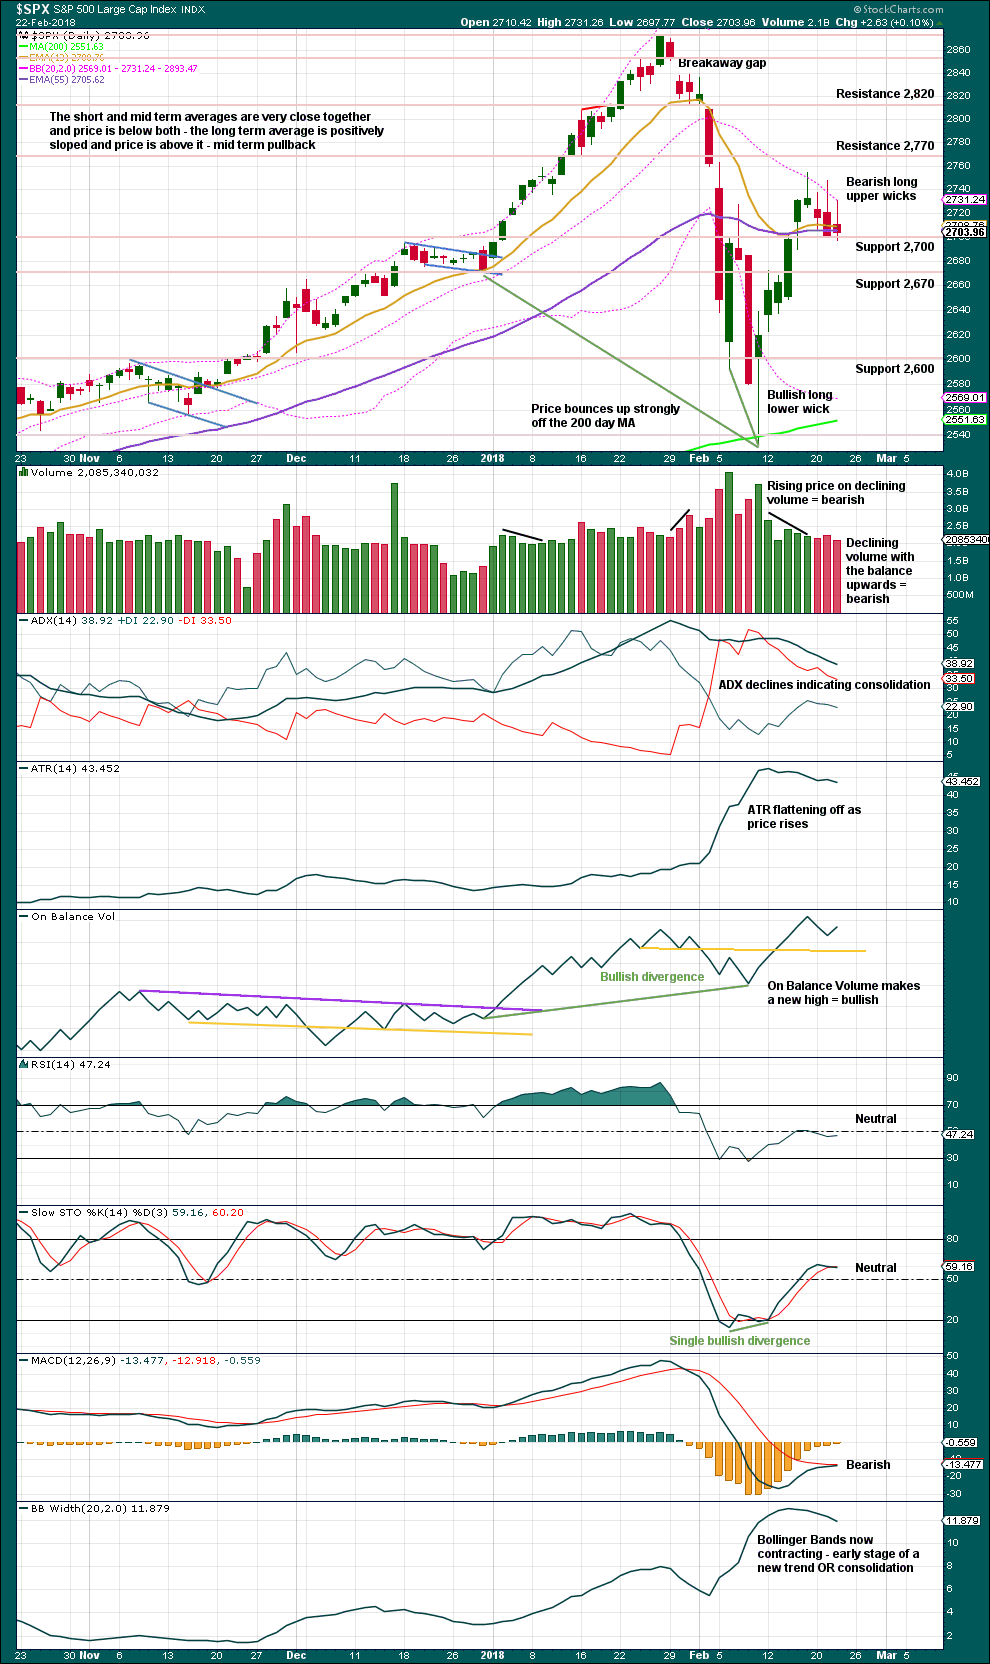
Click chart to enlarge. Chart courtesy of StockCharts.com.
Another long upper wick is bearish, but the small real body completes another spinning top that puts the trend more into neutral. This is not as bearish as yesterday’s candlestick.
Today saw downwards movement, a lower low and a lower high, but the balance of volume was upwards. The rise in price during this session did not have support from volume, with volume lighter, so this is interpreted as bearish.
VOLATILITY – INVERTED VIX CHART
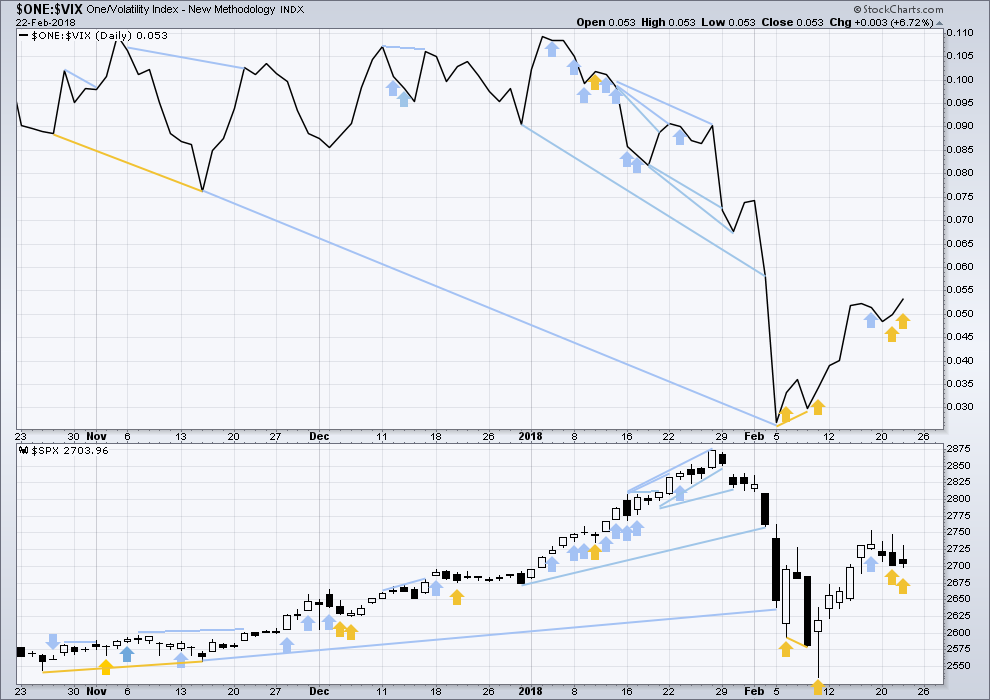
Click chart to enlarge. Chart courtesy of StockCharts.com.
So that colour blind members are included, bearish signals will be noted with blue and bullish signals with yellow.
Normally, volatility should decline as price moves higher and increase as price moves lower. This means that normally inverted VIX should move in the same direction as price.
Price today moved lower, but inverted VIX increased. The downwards movement in price has not come with a normal corresponding increase in market volatility as volatility today declined. This divergence is interpreted as bullish. This is given weight now that there are two days in a row of bullish divergence.
BREADTH – AD LINE
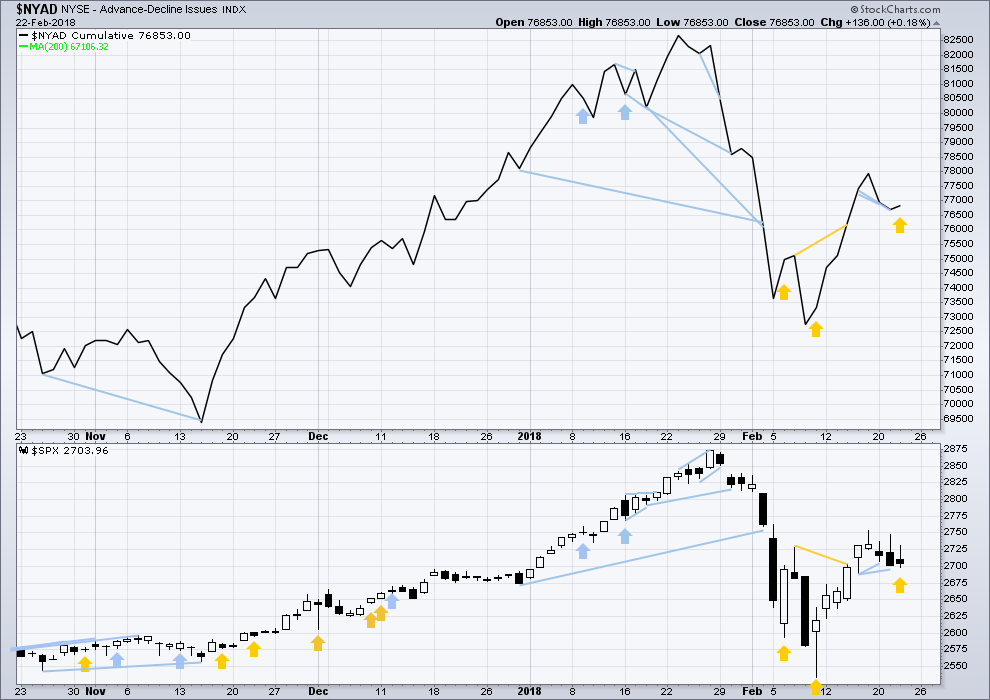
Click chart to enlarge. Chart courtesy of StockCharts.com.
There is normally 4-6 months divergence between price and market breadth prior to a full fledged bear market. This has been so for all major bear markets within the last 90 odd years. With no longer term divergence yet at this point, any decline in price should be expected to be a pullback within an ongoing bull market and not necessarily the start of a bear market.
All of small, mid and large caps last week moved higher. The bounce has support from wide breadth. They all also have long upper wicks on their daily candlesticks for Friday.
Breadth should be read as a leading indicator.
Price today moved lower, but the AD line has moved higher. The fall in price does not have support from declining market breadth; the increase in breadth today is bullish.
DOW THEORY
All indices have made new all time highs as recently as four weeks ago, confirming the ongoing bull market.
The following lows need to be exceeded for Dow Theory to confirm the end of the bull market and a change to a bear market:
DJIA: 17,883.56.
DJT: 7,029.41.
S&P500: 2,083.79.
Nasdaq: 5,034.41.
Charts showing each prior major swing low used for Dow Theory are here.
Published @ 05:24 p.m. EST.
Thank you Lara, you were spot on.
Very happy subscriber.
NQ.
That’s fantastic. It makes my day when I know you’re happy with your membership here.
Look out, resistance ahead! At the upper edge of the yellow best fit channel.
Todays movement is a bit sluggish for a third wave, possibly. That could change after resistance is overcome, energy may then be released.
My first idea for the short term:
If minor 2 is incomplete then it may be continuing sideways as a double combination. That would actually make sense. Labelling it as a complete double zigzag does have the problem that it mostly moved sideways, where double zigzags should have a stronger slope.
For the second structure to be a flat the minimum must be met. That may see price find resistance at the upper trend line and react down from there.
Or the flat could be labelled like this:
It makes a difference to the minimum requirement.
The basic idea remains the same though.
Yep. Right at the top of the recent trading range so what comes next should be very interesting!
What a ramp! Still holding my call spread. Opened a SPY 272 straddle at the close and will be massively adding to one leg or the other depending on what happens next week. A very wild day indeed.
Have a great week-end all!
Note that even with this wave count, I believe (?) this push up today is finishing a 5 wave structure. So next would be a 2 of the 3, which will appear initially as just “dropping back into this big range”. So I’m not expecting a quick up and out here, not at all. I may be surprised though. The bulls might be perking up again. My hourly chart is finally back to an uptrend signal; last time, that held for one single bar! We’ll see this time.
Some might say the yellow best fit channel makes a nice bull flag. How about you?
Yes, I was thinking that thought myself earlier today as a matter of fact. The measuring rule puts the high of the move out of that “flag” at…2920 or so.
My thoughts exactly too.
Ramp higher as expected. Unloading speculative SPY 273 calls for a quick double! 🙂
It looks like we will have an unfilled gap up today. If it does not get filled, I believe it is a break away gap. That is a good way to begin Minor 3 up.
2754 is the next big obstacle the bulls need to clear.
I am waiting for the bears to comment! 🙂
Knocking once again on the door of the 50 day MA. Will the bears let them in? 🙂
And through.
The SPX hourly squeeze is over. Nice upside break…
I have a key decision point at 2738.5. Multiple symmetric projections.
Volume suspicious….
What would be ideal is a sharp spike up from here to a new daily high that swiftly reverses…
You got wish #1….we’ll see about wish #2!!!
Just trying to think like a bankster! lol!
(actually that is how a possible ED would terminate)
I think this market is going to get sold hard into the close, or possibly next week. Price action is very weak in the complete absence of any selling pressure. The bears seem content for now to just defend then 50 day, and let price drift lower under its own weight. A lot of capital is flowing out of the market.
The aggressive shorting of vol is continuing. Very revealing candles on the five minute chart. At some point we are going to start seeing a series of fat, relentless green candles as they cannot artificially suppress volatility ad infinitum….
Today we finally have a MACD bullish cross over on the daily chart. This is a lagging indicator and serves to give confidence in (not confirm) Lara’s main counts. It is but one piece of evidence among many.
50 day a mere six points above. If the bulls are really in control they should be able to easily move that distance up by the close….
And it’s not just the 50 day. There’s other resistance there as well, a 62% fibo in particular at 2732.5. It’s a major resistance zone, and moving up through it would be huge for the bull case. I’m doubtful, today. But that said, things are grindingly trending in that direction. On the other hand, the daily sell off approacheth…
Still hovering around the 50. From my perspective, this looks a lot more like a consolidation than a dead cat bounce. We might still fade by the end of the day, but breadth is way up and volatility is way down right now. Perhaps most importantly, the 10-year is taking a step back.
Even if we are in a corrective wave and headed back down, wouldn’t we expect to see a new C wave up above 2754 before beginning the 3 down? I suppose there’s always the possibility of a complete 180 reversal, but with the way VIX and the AD line are acting, it’s not exactly imminent.
If you are correct, price will move and STAY above the 50 day. Simple no? 🙂
The meandering will once again continue until about an hour before the session ends, when the fade will begin in earnest. Unless of course we see an early Friday exit.
Vol shorts remaining busy….
Key levels for possible turns back down include 2726 (symmetric projection), 2732 (50 daily SMA), 2738 (symmetric projection), and 2742.50 or so (downtrend line). Not to mention price is now at 50% retrace of the overall 2 top to bottom so far (2725.7). The 62% is about 2732.4, and the 76% at 2740.7. Lots of possible turn points in this muck.
That all said, is price in a 3 up now today? Maybe.
I’m long, with a fairly tight stop…
Dang! Stopped out with a tiny gain, while visiting in-laws here in sunny Arizona, just before the big afternoon breakout.
Looks to me like a rising wedge…once again!
If correct, this morning’s gap will be violently filled…either today or with a gap down Monday….
Possible ED???!!!
yup, as soon as it was green today they monkey hammered it…..I can’t believe they’re doing it again….And FED Rosengren said they forecast the US will “require” QE again in the future?!? I pray the global public wakes up to the theft the central banks are guilty of.
I hope they try it… I dare em!!! 🙂
(as if they ever truly stopped…hyuk!)
What is happening with volatility is indeed quite peculiar. Fascinating that these cretins think that simply attempting to manipulate a risk measurement instrument actually implies any effect whatsoever on actual risk. But then of course, that is the objective is it not….keeping up appearances?
50 day continues to prove formidable resistance for SPX and DJI. Either they will join NDX above it or the latter will fall below its own MA. There have now been six rejected attempts to reclaim the 50 by these two indices and each failure increases the odds of a steep fall away from it, with a re-test of 200 day more likely prior to resumption of the up-trend.
SPX has been almost continuously in an hourly squeeze since mid-Wednesday morning. Eventually, price is going to choose a direction and move, and that squeeze is going to go away. Almost 3 hits of this 23.6% fibo just below in the last day, and a gap up morning off of it. However, my weekly is still neutral, daily trend is down, hourly trend is still down. Gap fill next? Or finally some buying?? We’ll see.
Today’s action looks like a possible bull flag / pennant on the 5 minute chart.
Well, that idea did not pan out.
“Sell the rips” is the order of the day. That strategy has returned some serious coin the last three sessions…. 🙂
It is true that for over a week, if you shorted every 8/34 ema cross to the downside on the 5 minute chart, you’d have been hard pressed to not make profits. We’ve had 5. It’s a mucky 2 with no clear indication yet it’s over. If it eventually starts pushing up and out, and the rip sellers don’t get quick action to the downside, we could see a pretty massive short squeeze drive this market up hard. On the other hand, if the recent lows get violated (call it 2700), then watch out below. Precipice, either way.
Watching the AD line and $NYMO (McClellan Oscillator of advancing-declining issues) is giving some clues I think. The breakout will come to the upside.
This is in line with Lara’s main count both daily and hourly.
Thanks for the info! And I note the VIX daily bar is red (which it should be with a green daily bar so far). However, I do have several symmetric projections just a bit higher, move lengths that have turned back down several times over the last week. And that dreaded 50 day SMA is just above too. It ain’t over til it’s over!
I think the bulls are in trouble. A green VIX means they are toast…filled on bear call spread…
Selling to open March 16 DIA 254/255 bear call spread at the market. Short call will ne exited on any CLOSE above 50 day. Long and strong volatility…
Futures not giving away much lately. Two days ago an awful lot of capital was expended buying them deep out of the red, and despite the intra- day ramp on miniscule volume, markets closed essentially flat. Higher futures overnight are not necessarily indicative of where price will end up tpday. It looks to me like the bears are holding onto their ammo for now. Some kind of larger triangle seems to be unfolding and based on recent price action, I suspect we are going to see another sharp move up out of it that is quickly reversed. Time to be disciplined, patient, and wait for Mr. Market to show his hand.
If you are nimble and adventurous, credit spreads and straddles are a fun way to mine the whipsaws! I remain biased bearish under the 50 day. Have a great trading day. 🙂
The current moves in the market is a perfect situation for executing straddles. You can be literally ringing the register daily and not care what Mr. Market does! Just so long as he does something… 😉
Agreed that this doesn’t look like a 3 down. Inverted VIX and the AD line are showing positive divergence rather than negative. That’s quite the opposite of what we saw when this downwards movement began. All those long upper wicks look bearish, but there’s no volume or conviction to any of these moves we’ve seen.
I’m pretty much at a loss for what’s going on. Like I said last night, we’re expecting either a 3 up or a 3 down here, and yet we get sideways movement. That doesn’t jive well for a third wave at all.
No need to be confused. The counts Lara has provided are all valid and one of them will be shortly proven correct by subsequent market movement. Some of the most explosive moves you will see can and do come after what appears to be a period of indecision. I suspect the current coiling action is storing energy for just such a move.
Hi!
Damm one speedy rabbit!