
Yesterday’s Elliott wave analysis expected price to continue to move lower and reach the first target, which is what has happened.
Summary: The larger trend is up. The next target is at 3,020.
Downwards movement should continue again tomorrow. A new target is at 2,671 – 2,670. If price keeps falling through this target, then the next target is at 2,617. This view has support from today’s candlestick, volume, and bearishness in the AD line.
Thereafter, the upwards trend should resume.
Always practice good risk management. Always trade with stops and invest only 1-5% of equity on any one trade.
The biggest picture, Grand Super Cycle analysis, is here.
Last historic analysis with monthly charts is here. Video is here.
An alternate idea at the monthly chart level is given here at the end of this analysis.
An historic example of a cycle degree fifth wave is given at the end of the analysis here.
MAIN ELLIOTT WAVE COUNT
WEEKLY CHART
Click chart to enlarge.
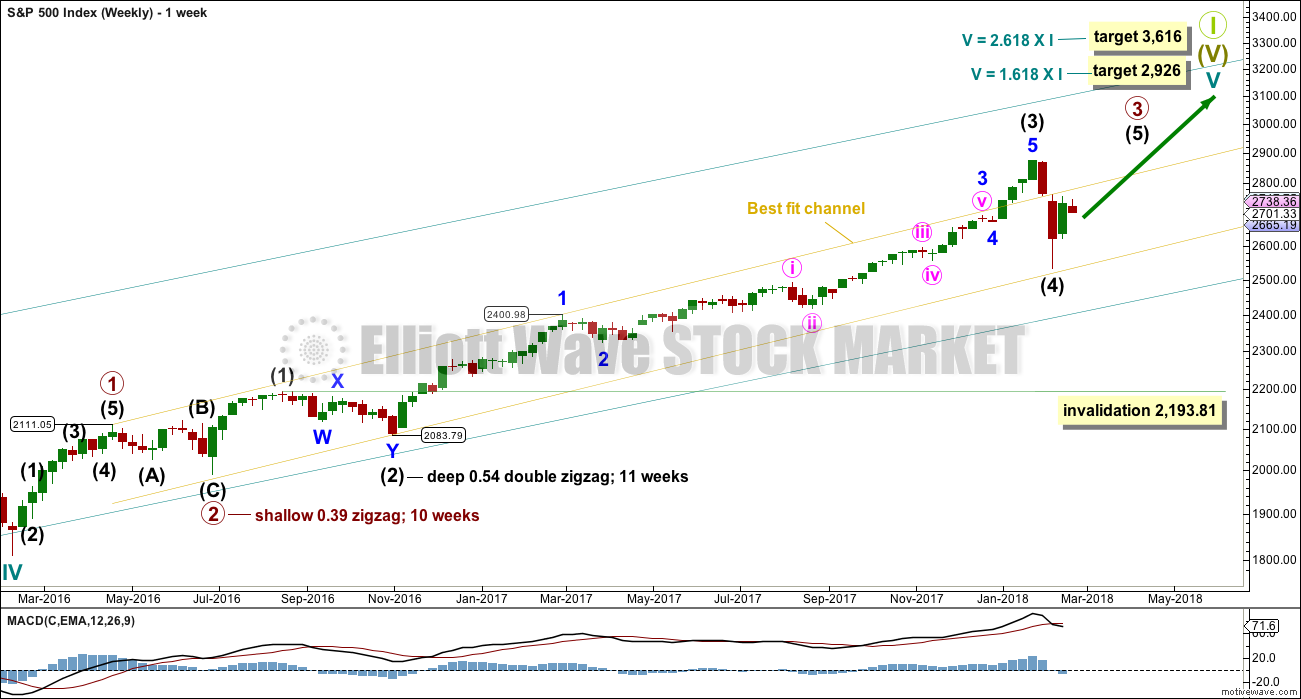
Cycle wave V must complete as a five structure, which should look clear at the weekly chart level. It may only be an impulse or ending diagonal. At this stage, it is clear it is an impulse.
Within cycle wave V, the third waves at all degrees may only subdivide as impulses.
Due to its size intermediate wave (4) looks proportional to intermediate wave (2), even though their durations so far are quite different.
Intermediate wave (4) has breached the Elliott channel drawn using Elliott’s first technique. The channel may be redrawn when it is confirmed as complete using Elliott’s second technique. A best fit channel is used while it may still be incomplete to show where it may find support. Price points are given for this channel, so that members may replicate it on a semi-log scale.
Intermediate wave (4) may not move into intermediate wave (1) price territory below 2,193.81.
DAILY CHART
Click chart to enlarge.
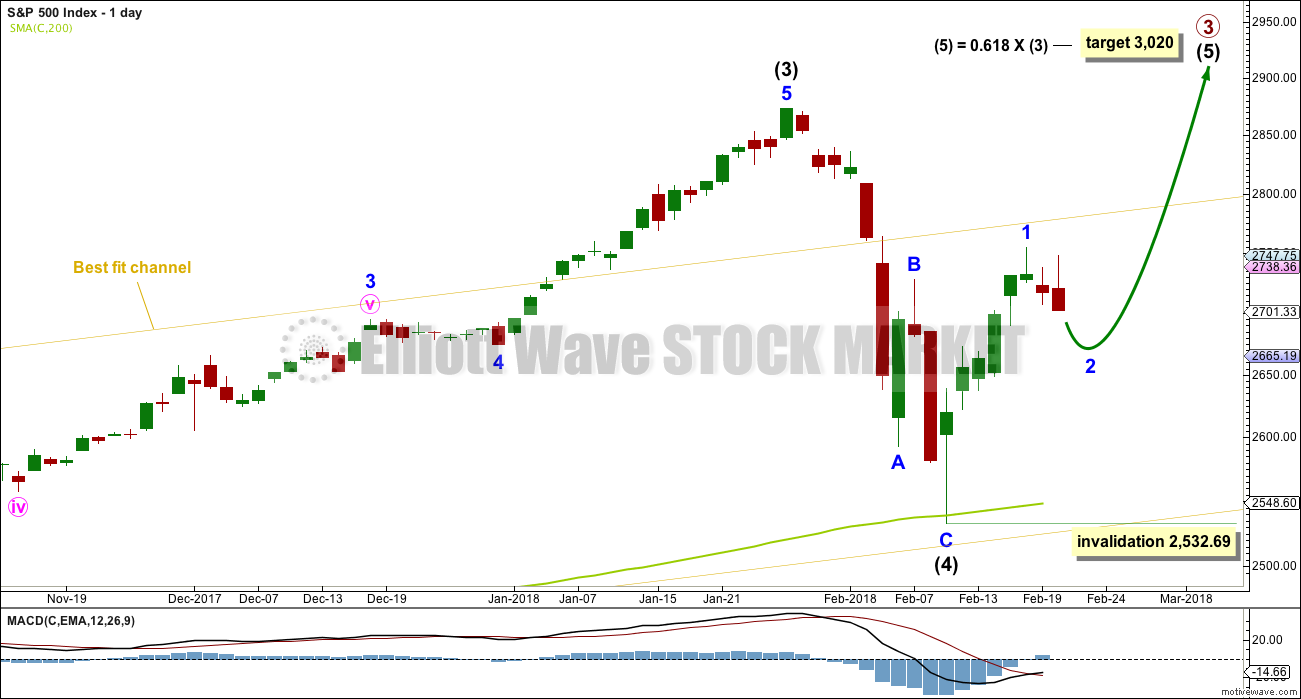
The S&P has behaved like a commodity to end intermediate wave (3): a relatively strong fifth wave with a steep slope. The high looks a little like a blow off top. This is followed by a sharp decline, which is typical behaviour for a commodity and not common for the S&P.
The very long lower wick on the candlestick at the end of intermediate wave (4) is strongly bullish. It looks like intermediate wave (4) may have ended there.
Despite the duration of intermediate wave (4) being much quicker than intermediate wave (2), the size is proportional. On weekly and monthly time frames intermediate wave (4) now has the right look.
The downwards wave labelled intermediate wave (4) may be seen as either a three wave zigzag, as labelled on this daily chart, or it may be seen as a five wave impulse. Both possibilities must be considered. The main hourly and alternate hourly charts consider it as a zigzag. The second alternate hourly chart considers it may have been a five.
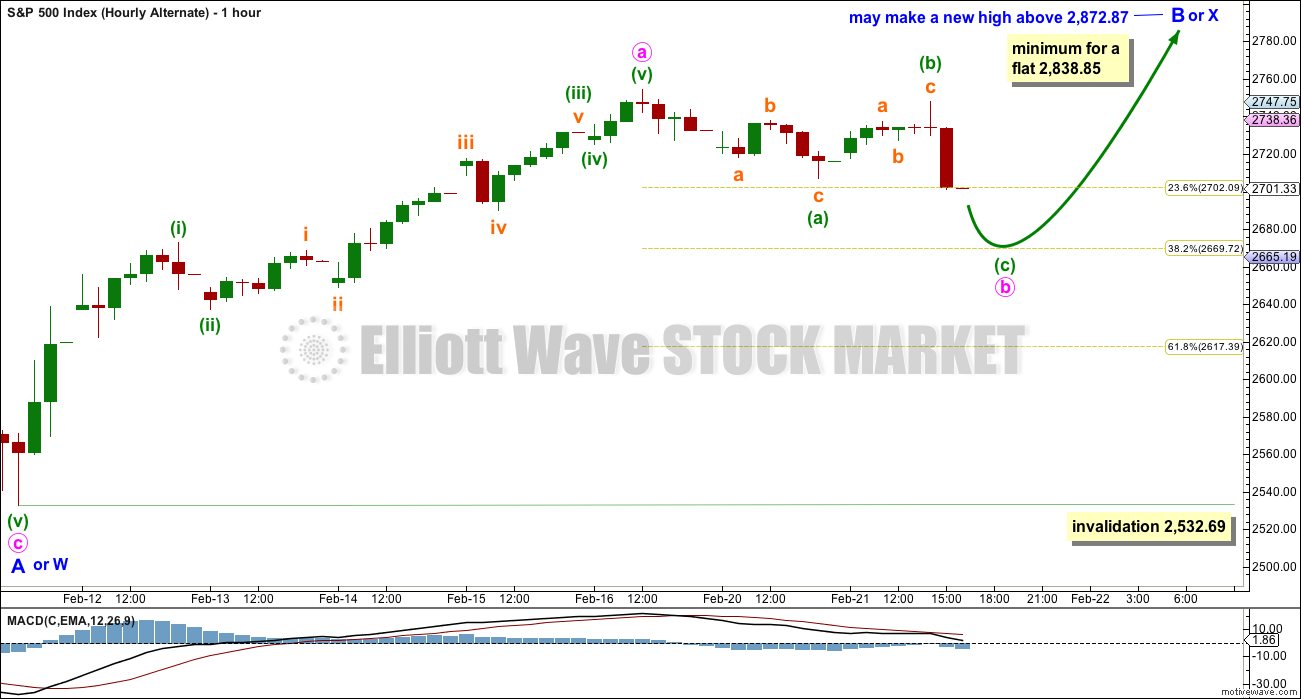
HOURLY CHART
Click chart to enlarge.
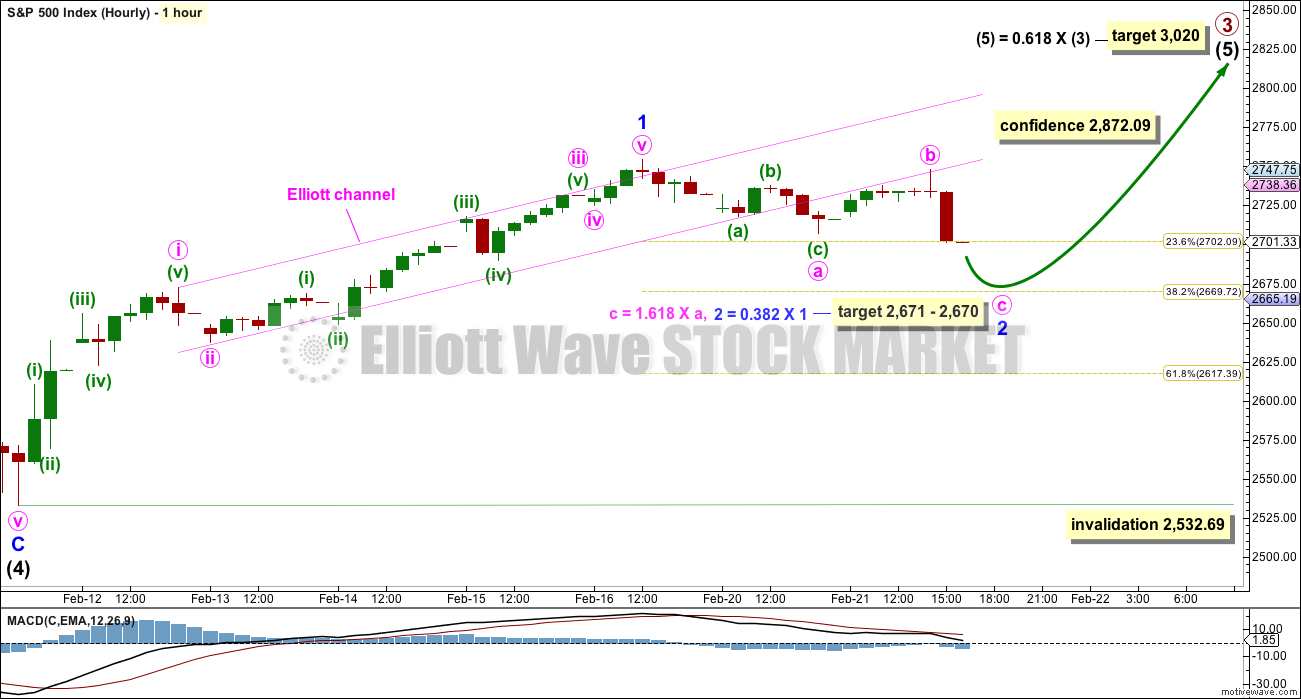
A new all time high would add confidence to this wave count (even though an alternate idea published would remain valid).
It is possible that minor wave 2 may be a relatively brief and shallow correction. This has been a feature of this bull market up until the arrival of intermediate wave (4). It may again be a feature of this market during intermediate wave (5). If it reaches the new target, then it would still be relatively shallow.
If price keeps falling through the new target, then the 0.618 Fibonacci ratio would be the next target for minor wave 2 to end.
Minor wave 2 may not move beyond the start of minor wave 1 below 2,532.69.
ALTERNATE DAILY CHART
Click chart to enlarge.
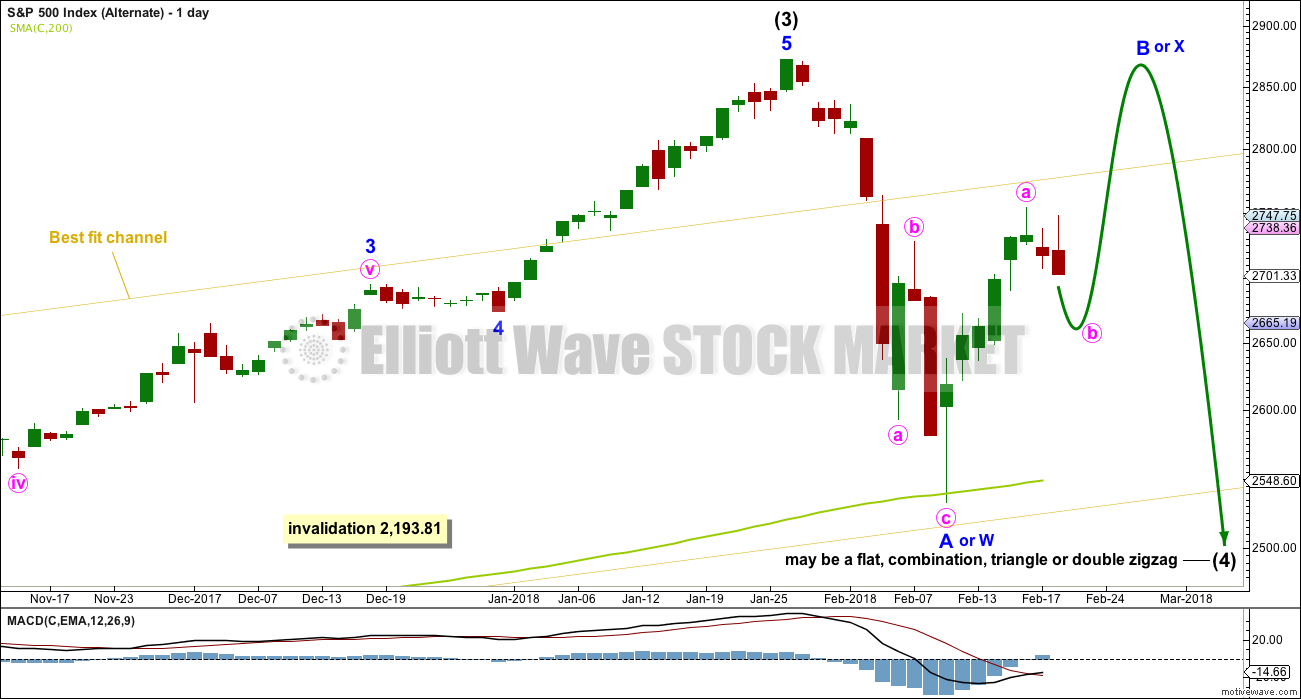
This wave count is identical to the main daily chart, with the exception of the degree of labelling within intermediate wave (4). If the degree is moved down one, then only minor wave A may be complete within a continuing correction for intermediate wave (4).
If it continues further, and if analysis of minor wave A as a zigzag is correct, then intermediate wave (4) may be a flat, combination, triangle or double zigzag. Of all of these possibilities a double zigzag is the least likely because that was the structure of intermediate wave (2). Intermediate wave (4) should be assumed to exhibit alternation until proven otherwise.
If upwards movement continues further, then the idea of a double zigzag may be discarded. Double zigzags normally have a strong slope against the prior trend, and to achieve a strong slope their X waves are usually shallow.
All of a flat, combination or triangle would have a very deep minor wave B. An expanded flat, running triangle or combination may have minor wave B or X make a new all time high. Unfortunately, for this reason there is no upper price point which differentiates this alternate idea from the main wave count.
Minor wave B or X should be expected to exhibit weakness. Light and declining volume and divergence with oscillators at its end are features of B waves, and also of X waves which are analogous.
Minor wave B or X may be any one of more than 23 possible corrective structures, but it would most likely be a zigzag. It looks like it may be subdividing as a zigzag at this stage.
This alternate wave count would expect a strong breach of the 200 day SMA, which would be unlikely. The first expectation should be for price to find strong support there.
ALTERNATE HOURLY CHART
Click chart to enlarge.
Upwards movement off the low may be an incomplete zigzag for minor wave B. Zigzags subdivide 5-3-5, exactly the same as the start of an impulse.
If intermediate wave (4) is a flat correction, then within it minor wave B must retrace a minimum 0.9 length of minor wave A.
If intermediate wave (4) is a triangle, there is no minimum requirement for minor wave B. It only needs to subdivide as a three wave structure.
If intermediate wave (4) is a combination, then the first structure may be a zigzag for minor wave W. Minor wave X may be any corrective structure and it may make a new high above the start of minor wave W. There is no minimum requirement for minor wave X of a combination, but it would very likely be fairly deep.
Minor wave B or X may be unfolding as a zigzag. So far, within minor wave B or X, minute wave a may be a complete five wave impulse. Minute wave b may correct to either the 0.618 or 0.382 Fibonacci ratios. Minute wave b may not move beyond the start of minute wave a below 2,532.69.
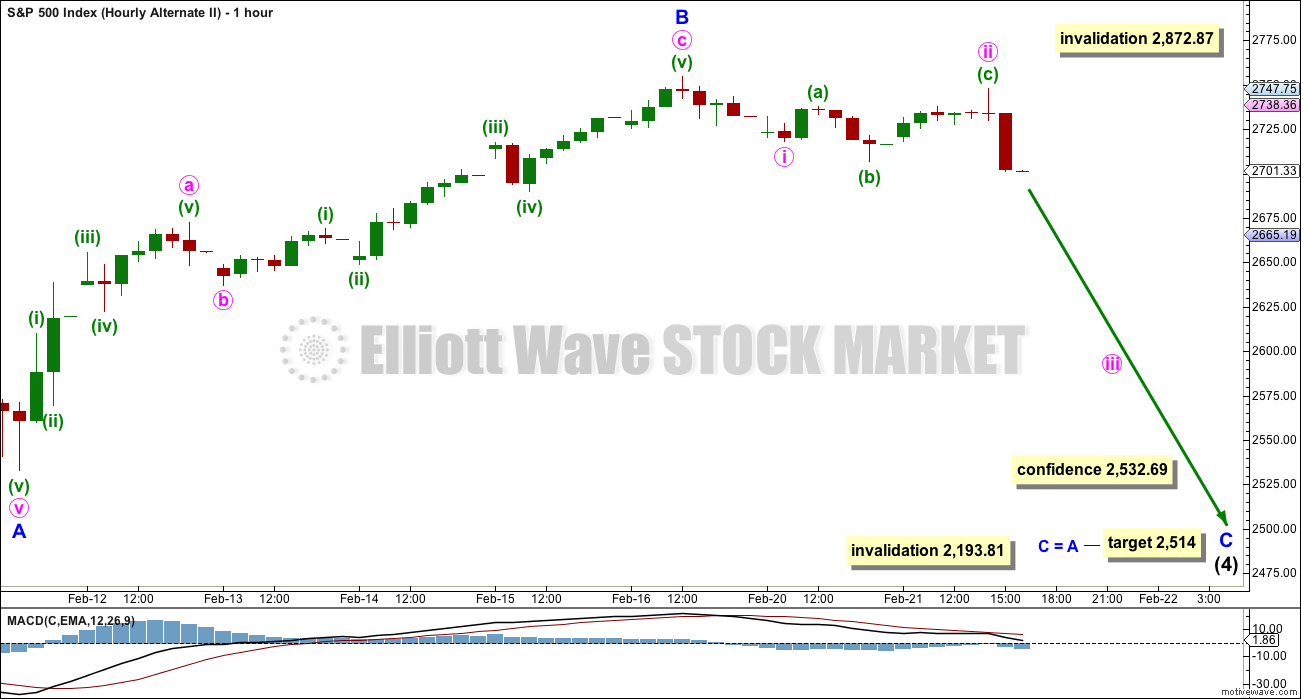
SECOND ALTERNATE HOURLY CHART
Click chart to enlarge.
It is also possible to see the last downwards wave as a five wave impulse. Intermediate wave (4) may be continuing lower as a single zigzag, subdividing 5-3-5.
Within a zigzag, minor wave B may not make a new high above the start of minor wave A at 2,872.87.
Minor wave B may be now complete ending close to the 0.618 Fibonacci ratio of minor wave A.
Minor wave C may now be underway. However, this wave count would expect a strong breach of the 200 day SMA, which looks unlikely. The first expectation should be for price to find strong support there.
This wave count illustrates risk now to any long positions. While the main wave count is preferred and it expects a third wave up, this alternate must be accepted as possible. It expects a third wave down.
TECHNICAL ANALYSIS
WEEKLY CHART
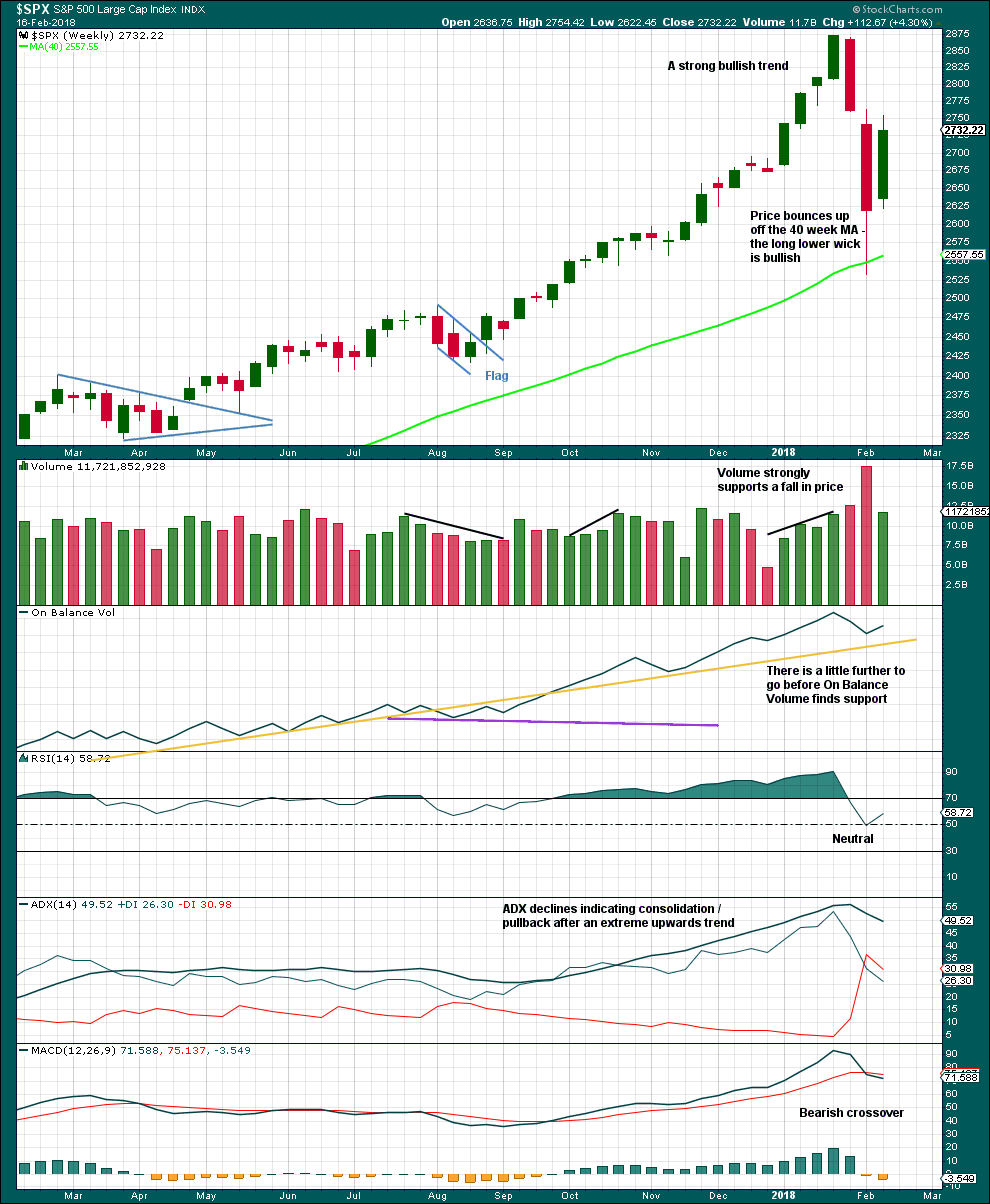
Click chart to enlarge. Chart courtesy of StockCharts.com.
Volume this week is much lower than the last downwards week, which is bearish, but it is stronger than the previous four upwards weeks, which is bullish.
There is nothing bearish about this weekly candlestick.
The pullback has brought ADX down from very extreme. A possible trend change to down is indicated, but as yet no new trend is indicated.
DAILY CHART
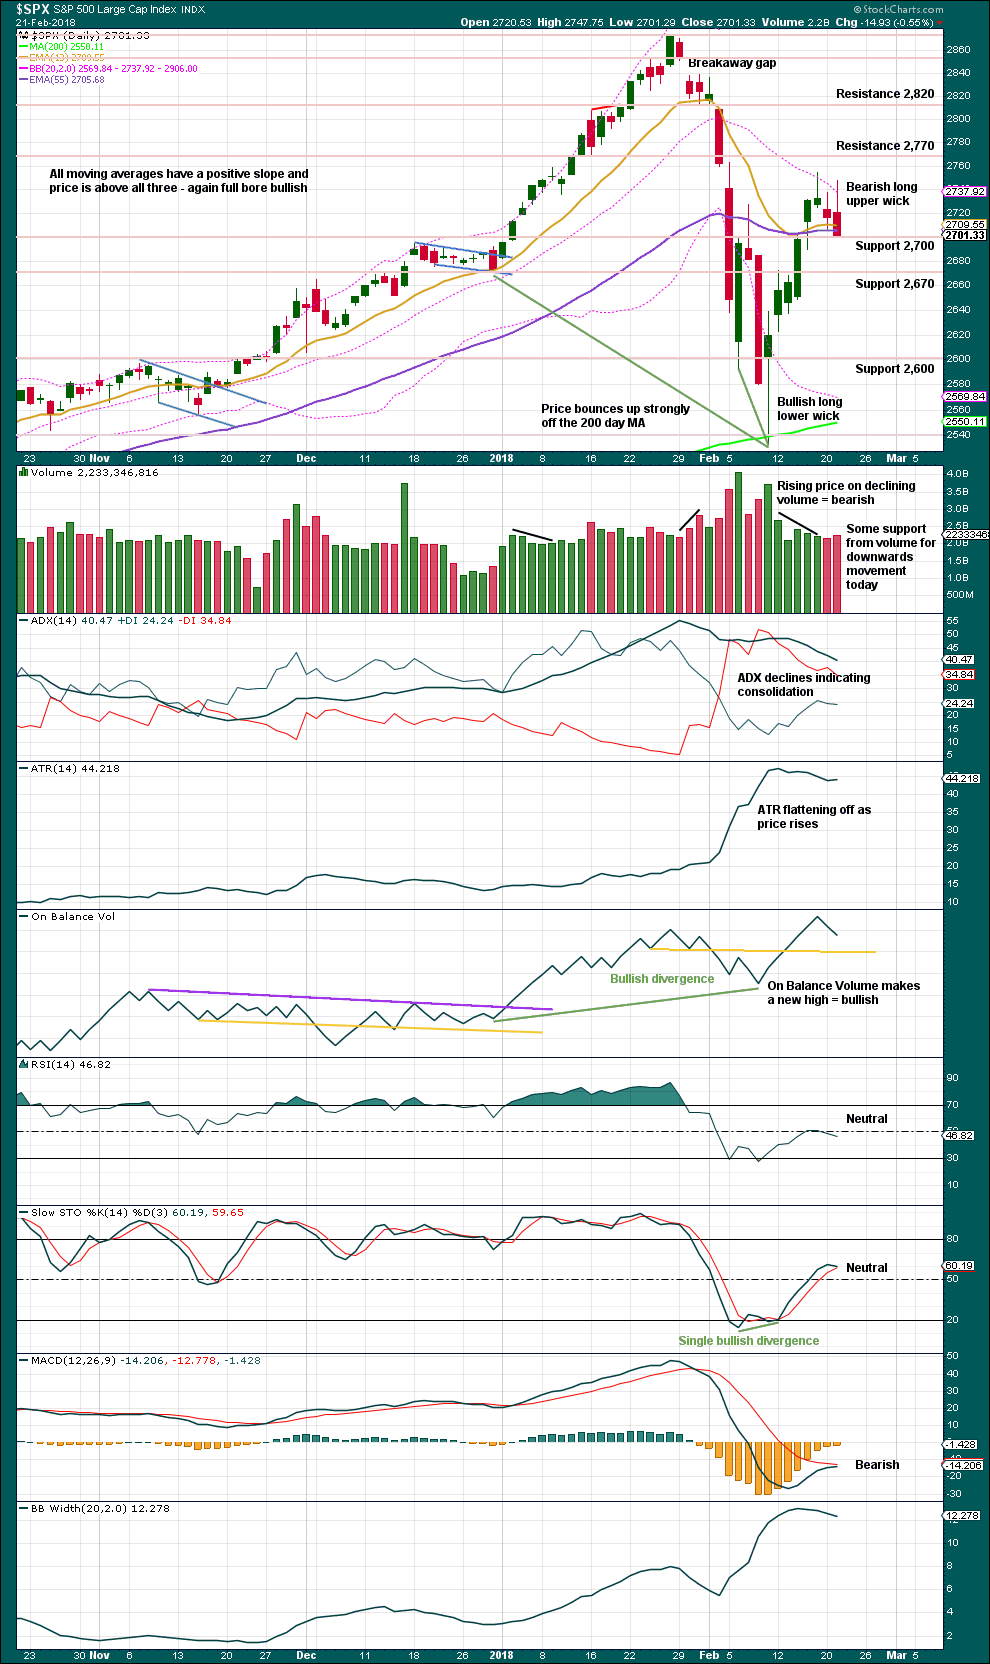
Click chart to enlarge. Chart courtesy of StockCharts.com.
Price is now at support. Next support is about 2,670, which coincides nicely with the Elliott wave target.
The long upper wick and support today from volume together strongly suggest another downwards day tomorrow.
VOLATILITY – INVERTED VIX CHART
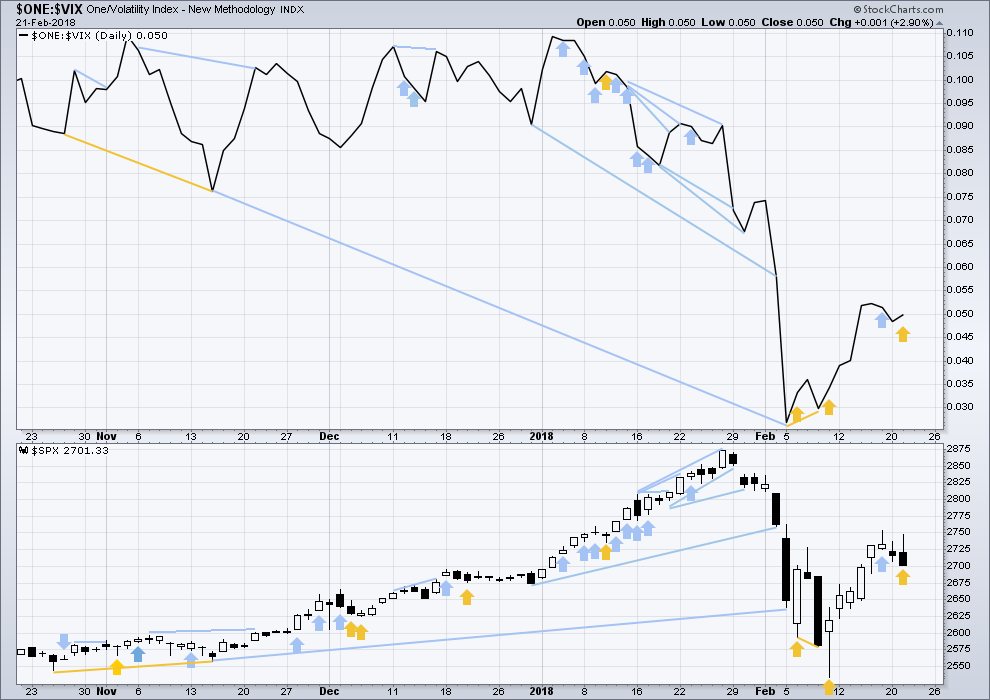
Click chart to enlarge. Chart courtesy of StockCharts.com.
So that colour blind members are included, bearish signals will be noted with blue and bullish signals with yellow.
Normally, volatility should decline as price moves higher and increase as price moves lower. This means that normally inverted VIX should move in the same direction as price.
Price today moved lower, but inverted VIX increased. The downwards movement in price has not come with a normal corresponding increase in market volatility as volatility today declined. This divergence is interpreted as bullish.
BREADTH – AD LINE
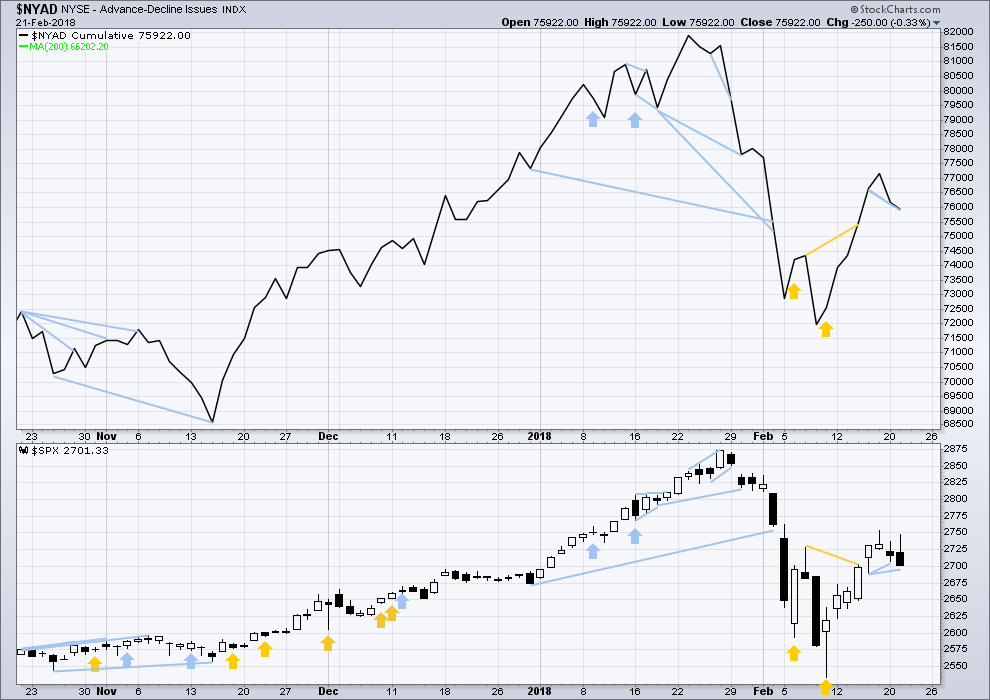
Click chart to enlarge. Chart courtesy of StockCharts.com.
There is normally 4-6 months divergence between price and market breadth prior to a full fledged bear market. This has been so for all major bear markets within the last 90 odd years. With no longer term divergence yet at this point, any decline in price should be expected to be a pullback within an ongoing bull market and not necessarily the start of a bear market.
All of small, mid and large caps last week moved higher. The bounce has support from wide breadth. They all also have long upper wicks on their daily candlesticks for Friday.
Breadth should be read as a leading indicator.
Bearish divergence noted yesterday has been followed by downwards movement. The new low today for price has still not made a new low below the session four days ago, so there is still bearish divergence. This supports the main Elliott wave count and the expectation of another downwards day tomorrow.
DOW THEORY
All indices have made new all time highs as recently as four weeks ago, confirming the ongoing bull market.
The following lows need to be exceeded for Dow Theory to confirm the end of the bull market and a change to a bear market:
DJIA: 17,883.56.
DJT: 7,029.41.
S&P500: 2,083.79.
Nasdaq: 5,034.41.
Charts showing each prior major swing low used for Dow Theory are here.
Published @ 11:22 p.m. EST.
Wow! Another day of incredible whipsaw. Had meetings all day and it is SO difficult to NOT look at one’s mobile device! 🙂
Still looks to me like as long as remain below the 50 day we will have to re-test this month’s lows. A time for patience methinks. Have a great evening all!
I’m lost again. More likely we are in minor 3 vs minute B?
Not if price drops below yesterday’s low. If that happens, 2 isn’t over by definition. It’s very close now, and I suspect it’s moving lower, frankly. This is hour 4 of down momentum today.
Kevin
If this closes red today that will be 2 days in a row where the market had a strong rally then to have given it all back.
Better yet it barely closes green.
To be honest i really don’t know which scenario is worst.
When i look at the Monthly chart i really can’t find a previous pattern to work off of.
One Scenario I see is that this monthly bar may go lower.
Or this can be the final Chop before we move higher.
I see a range for the rest of the year from 2370 – 3050.
If it wasn’t for the tax reform the market would move at least 10 – 20% lower from my low target of 2370.
All comments welcome
I share the challenge. I look at the NDX though, and I see a heck of a large head and shoulder’s pattern. If that neck line goes, price will drop 1.75% to get to the “measured move” which I put around 6627. I’m using that neckline as a trigger signal, along with a break below yesterday’s low in SPX. And such a break will confirm an 8/34 ema crossover on the hourly chart, which usually means there’s a significant move getting launched. Not always. But it appears it’s a teetering market, and another small move down might just precipitate a massive continuation. I’d urge caution.
The monthly pattern of Aug 15 – Jan 16 is instructive, perhaps. Generally, indicates we can expect lots of volatility inside the shadow of this giant 4 down. And that a fresh break to new lows doesn’t necessarily mean the market is going to collapse, nor does a break to new highs means it’s not going right back down again to new lows! Check it out.
usually I love the noon update, got a little flustered, this has got to be an impulse down …
That labelling I have on the main hourly chart for minor 2 is invalid. Minute b is less than 0.9 of minute a, but minute a is a three, the rule for a flat is not met.
This is how it should be labelled if it is complete.
Updated first hourly chart:
The size of this upwards movement at first glance looks like a new wave, it looks like minor 2 may not move lower and may have been very shallow.
That certainly is possible.
What is also possible is that todays upwards movement is a second wave correction within an impulse lower.
The pullback, whether it is labelled minute ii (as per the main hourly chart) or minute b (as labelled on the alternate) may still be unfolding lower.
The 0.382 and then the 0.618 Fibonacci ratios would still be targets.
Actually, I like this labelling better. It fits the subdivisions on the five minute chart better.
A double zigzag continuing lower is possible.
If this is an ABC correction up, it’s hit the 62% and I’d think that’s the most likely turn spot, where the algo’s would kick in with some sell programs.
Yea, like that. And now a (temporary??) bounce off the 50% of the retrace of the up move. It’s just meant to be a largely sideways day I think. But you never know; it’s volatile!
Hi Kevin
Or this could be A-B-C
Correction Down?
The move up this morning doesn’t look impulsive; it looks like an ABC to me. Possibly a sequence of 1-2’s (second such 2 moving down now) but…???
My weekly trend indicator is neutral. My daily trend indicator is DOWN. My hourly is DOWN. My 5 minute is DOWN. Pretty strong hints overall. It is very choppy.
In the last 3-4 days I have about 9 crosses of the 8/34 emas on the 5 minute chart. That’s choppy!!!! No sustained moves (though the chop size is relatively large).
Also, FWIW, SPX is back to 2 hours worth of squeeze on the hourly chart (that’s where the bollinger bands move inside the keltner bands, and often indicates a volatility expansion forthcoming).
The 8/34 emas on the SPX hourly are STILL positive. But just barely, and any further move down here is going to cross them to the bear side. Last time they crossed negative was just before the 2-3 days of massive sell off. They may not cross here…
They’ve crossed. But will price undercut yesterday’s low? Or is the bottom in, and they recross immediately to bull side before the close? Gads I hate choppy markets.
or perhaps we are done and going up now
Waiting for strong buy triggers myself. The move down yesterday perfectly hit Lara’s initial target, which was also exactly at a 23.8% fibo. That said, it ain’t a bottom until we see some swing highs exceeded, etc. Nyet.
Extraordinary manipulation through the beginning of the session…..
Yup, momentum players (read retail) are buying like crazy…
If this is just a wave 2 up finishing (of wave C) then we have a lot further to fall.
does the 2 up on the C usually retrace 0.62 ?
I don’t think there is a “usual”. But 62% happens a lot.
Taking Lara’s projected 3,000 + target, I am wondering if the markets would need a bigger correction to build the energy (buying power) before ramping higher. If we turn around above 2635-2637, I suspect the bounce will not go far and might top quickly. Banksters certainly want to make large amounts of money and would likely prefer a deeper correction (maybe a touch below 200MA). Let’s see what today brings..
Very precarious time to go long or short. Algos having a field day with these intra-day swings.
Yep. Whip-saw days like these can definitely pick your pocket.
Foist.