Upwards movement has unfolded for Wednesday’s session as expected from yesterday’s Elliott wave count and technical analysis.
Summary: It still looks more likely that a low may be in place. The targets are either 2,909, 2,920 or 3,104.
However, risk still remains and the long upper wick on today’s candlestick is concerning for bulls. In the short term, a new low below 2,668.62 would indicate more downwards movement as more likely. The target would be at 2,555 or 2,533.
Always practice good risk management. Always trade with stops and invest only 1-5% of equity on any one trade.
The biggest picture, Grand Super Cycle analysis, is here.
Last historic analysis with monthly charts is here. Video is here.
An historic example of a cycle degree fifth wave is given at the end of the analysis here.
MAIN ELLIOTT WAVE COUNT
WEEKLY CHART
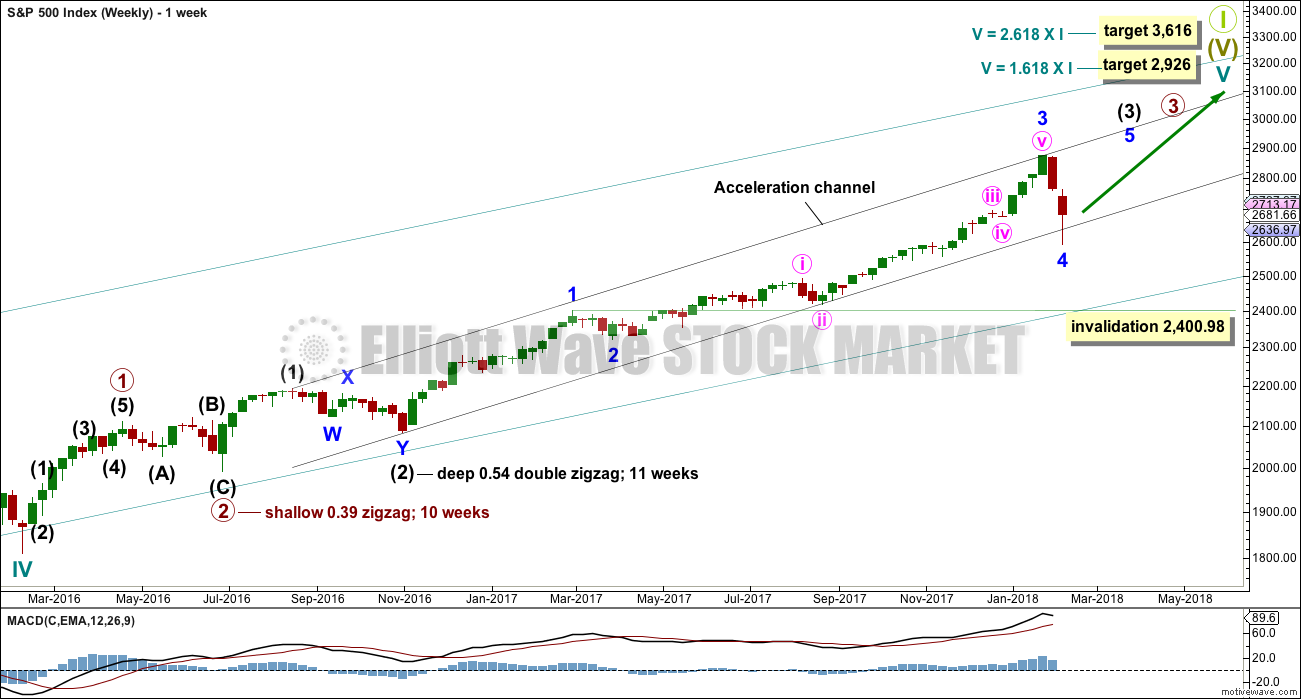
Cycle wave V must complete as a five structure, which should look clear at the weekly chart level. It may only be an impulse or ending diagonal. At this stage, it is clear it is an impulse.
Within cycle wave V, the third waves at all degrees may only subdivide as impulses.
Within cycle wave V, the corrections for primary wave 2 and intermediate wave (2) both show up clearly, both lasting several weeks. The respective corrections for intermediate wave (4) and primary wave 4 would most likely also last several weeks, so that they show up at weekly and monthly time frames. The right proportions between second and fourth wave corrections give a wave count the right look. This wave count expects to see two large multi week corrections coming up.
Cycle wave V has passed equality in length with cycle wave I, which would be the most common Fibonacci ratio for it to have exhibited. The next most common Fibonacci ratio would be 1.618 the length of cycle wave I. This target at 2,926 now looks too low. The next most common Fibonacci ratio would be 2.618 the length of cycle wave I at 3,616. This higher target is looking more likely at this stage.
Intermediate wave (3) has passed all of equality in length with intermediate wave (1), and 1.618 and 2.618 the length of intermediate wave (1). It is possible that intermediate wave (3) may not exhibit a Fibonacci ratio to intermediate wave (1). The target calculation for intermediate wave (3) to end may have to be done at minor degree; when minor waves 3 and 4 are complete, then a target may be calculated for intermediate wave (3) to end. That cannot be done yet.
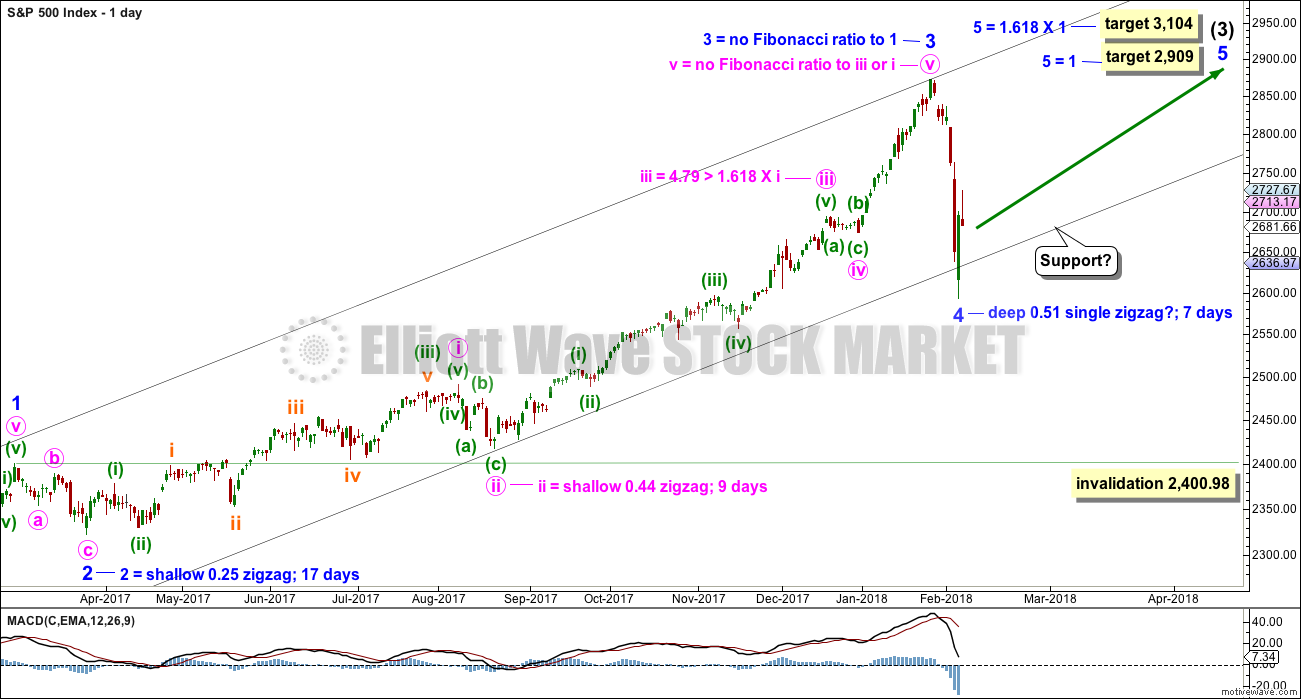
The many small subdivisions within minor wave 3 may be seen in several different ways. The pullback may be minor wave 4. Minor wave 2 was a shallow 0.25 double zigzag lasting 4 weeks. Minor wave 4 may be a single zigzag, or it may also be a sideways flat, combination or triangle which may last longer. So far minor wave 4 is 0.51 the depth of minor wave 3, and so now there is alternation in depth.
If minor wave 4 ends this week at support, then it would look reasonably in proportion to minor wave 2.
The black acceleration channel is drawn about intermediate waves. It shows where downwards movement may find support. If this support holds, then it is possible that minor wave 4 could be over.
The alternate hourly wave count below will consider the possibility that minor wave 4 may continue lower. Minor wave 4 may not move into minor wave 1 price territory below 2,400.98.
DAILY CHART
The black acceleration channel is copied over to this daily chart. Minor wave 4 has overshot the channel, but at the daily chart level the channel is not breached. As this downwards movement was swift and strong an overshoot is entirely acceptable.
Fibonacci ratios for this main wave count and for the alternate below are provided on both daily charts. There is not enough difference between the two wave counts in terms of Fibonacci ratios to indicate which may be more likely.
Two targets are provided for minor wave 5 to complete the impulse of intermediate wave (3).
HOURLY CHART
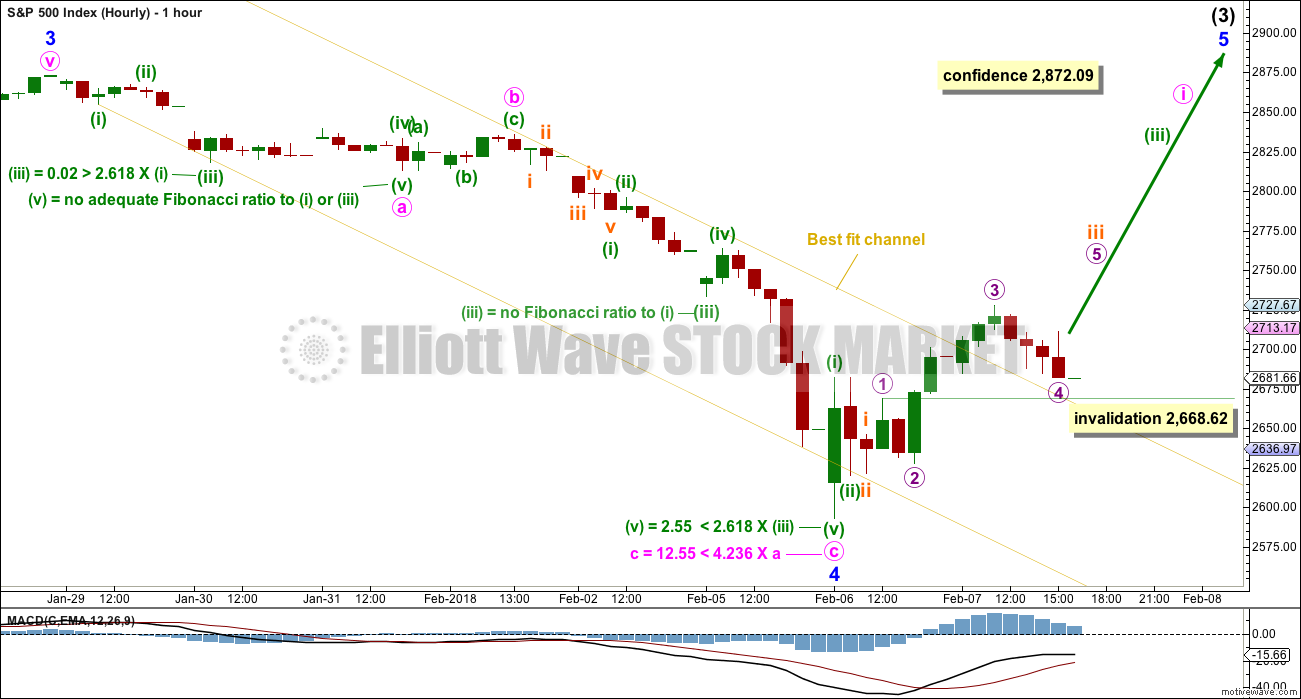
If a low is in place, then minor wave 4 may be a complete zigzag.
Some confidence in this wave count may be had now that the yellow channel is breached by upwards movement. Strong confidence may be had in this wave count with a new high by any amount at any time frame above 2,872.09.
If a new wave up is beginning, then it must begin with a five wave structure. So far that may be incomplete, and it is labelled minute wave i.
So far, within minute wave i, the middle of it may have passed today and is labelled micro wave 3. Micro wave 4 may not move into micro wave 1 price territory below 2,668.62.
A new low for the short term below 2,668.62 would invalidate this first hourly chart in favour of the alternate hourly chart below.
ALTERNATE HOURLY CHART
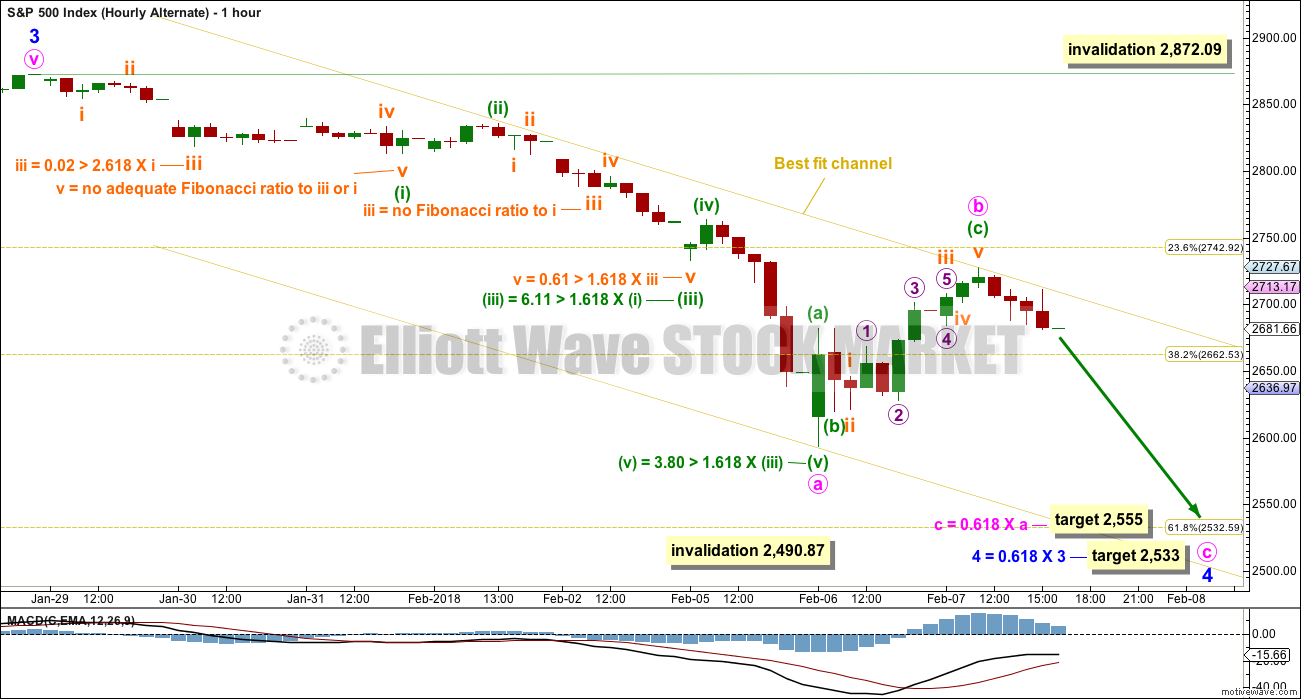
The best fit channel on this alternate hourly chart is drawn differently in order to contain all movement since the last all time high.
It remains possible that the pullback is not over and may continue lower as a zigzag.
The first target for downwards movement to end may be about 2,555 where minute wave c would reach 0.618 the length of minute wave a. If price keeps falling through this first target, then use the next target at 2,533 where minor wave 4 would correct to 0.618 the length of minor wave 3.
Minute wave b may not move beyond the start of minute wave a above 2,872.09.
ALTERNATE WAVE COUNT
WEEKLY CHART
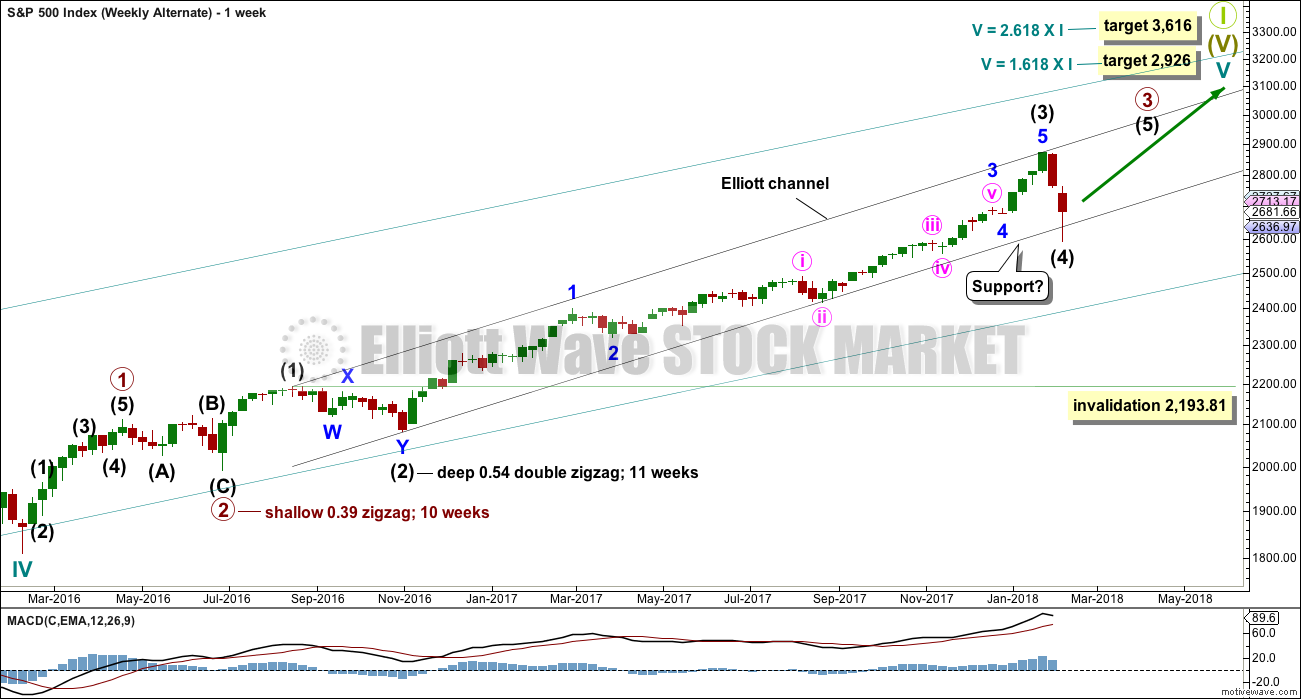
Despite the brevity of this downwards movement, the size of it means the possibility must be considered that intermediate wave (4) has arrived and may be over at yesterday’s low.
Even though intermediate wave (2) lasted 11 weeks, if intermediate wave (4) is over here within just two weeks, it would still have about the right look on the weekly and daily charts due to its size.
The black channel is drawn in exactly the same way on all charts today. Here it is correctly termed an Elliott channel about the impulse of primary wave 3. In the first instance, expect intermediate wave (4) may find support about the lower edge. This would see it over here or very soon indeed.
When the S&P has strong downwards movement to end corrective waves on the daily and weekly time frames, it often ends with an overshoot of a channel. The end of cycle wave IV on the bottom left of this chart is a good example: the S&P overshot the teal channel and it quickly turned up there. The overshoot of intermediate wave (4) looks similar.
Fourth waves are not always contained within a channel drawn using Elliott’s first technique. This is why Elliot developed a second technique to redraw the channel when the fourth wave breached it. If intermediate wave (4) does continue lower, then the channel may have to be redrawn.
Intermediate wave (4) may not move into intermediate wave (1) price territory below 2,193.81.
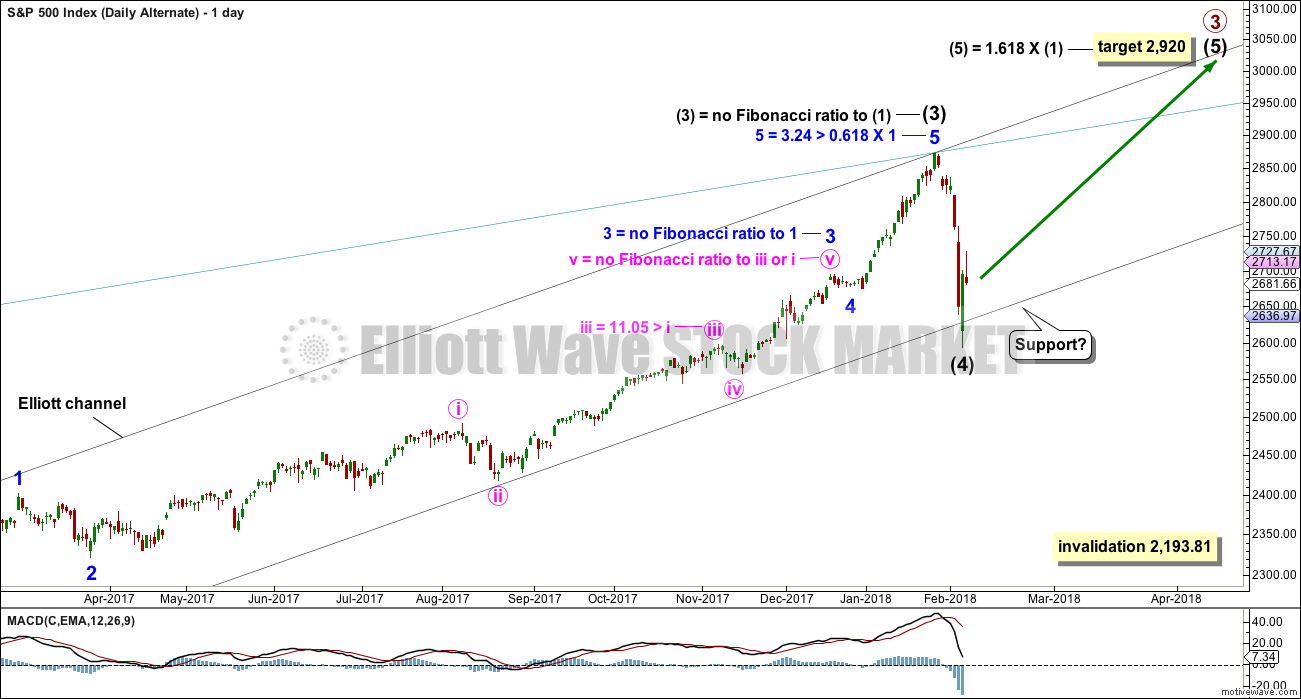
DAILY CHART
If intermediate wave (4) is over here, then a target for intermediate wave (5) may be calculated. Were intermediate wave (5) to only reach equality in length with intermediate wave (1) it would be truncated. The next Fibonacci ratio in the sequence is used to calculate a target. If intermediate wave (4) moves lower, then this target must also move correspondingly lower.
At the hourly chart level, this alternate idea works in exactly the same way as the main wave count. Both hourly charts work for this alternate, only the degree of labelling would be one degree higher.
TECHNICAL ANALYSIS
WEEKLY CHART
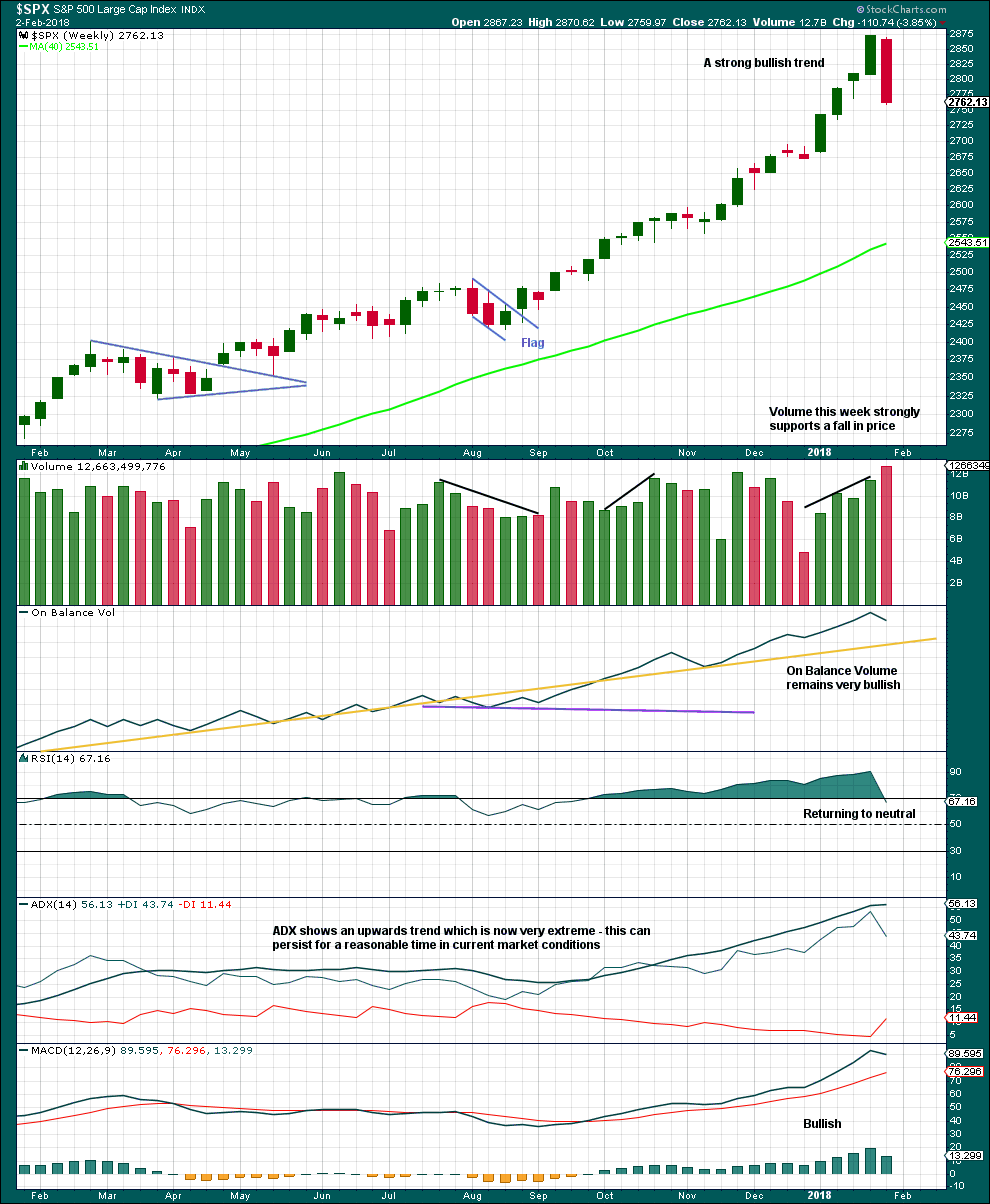
Click chart to enlarge. Chart courtesy of StockCharts.com.
This strong bearish weekly candlestick is not technically a bearish engulfing reversal pattern because the open this week gapped lower. However, the close this week well below last week’s open is very bearish. Support from volume is also very bearish.
DAILY CHART
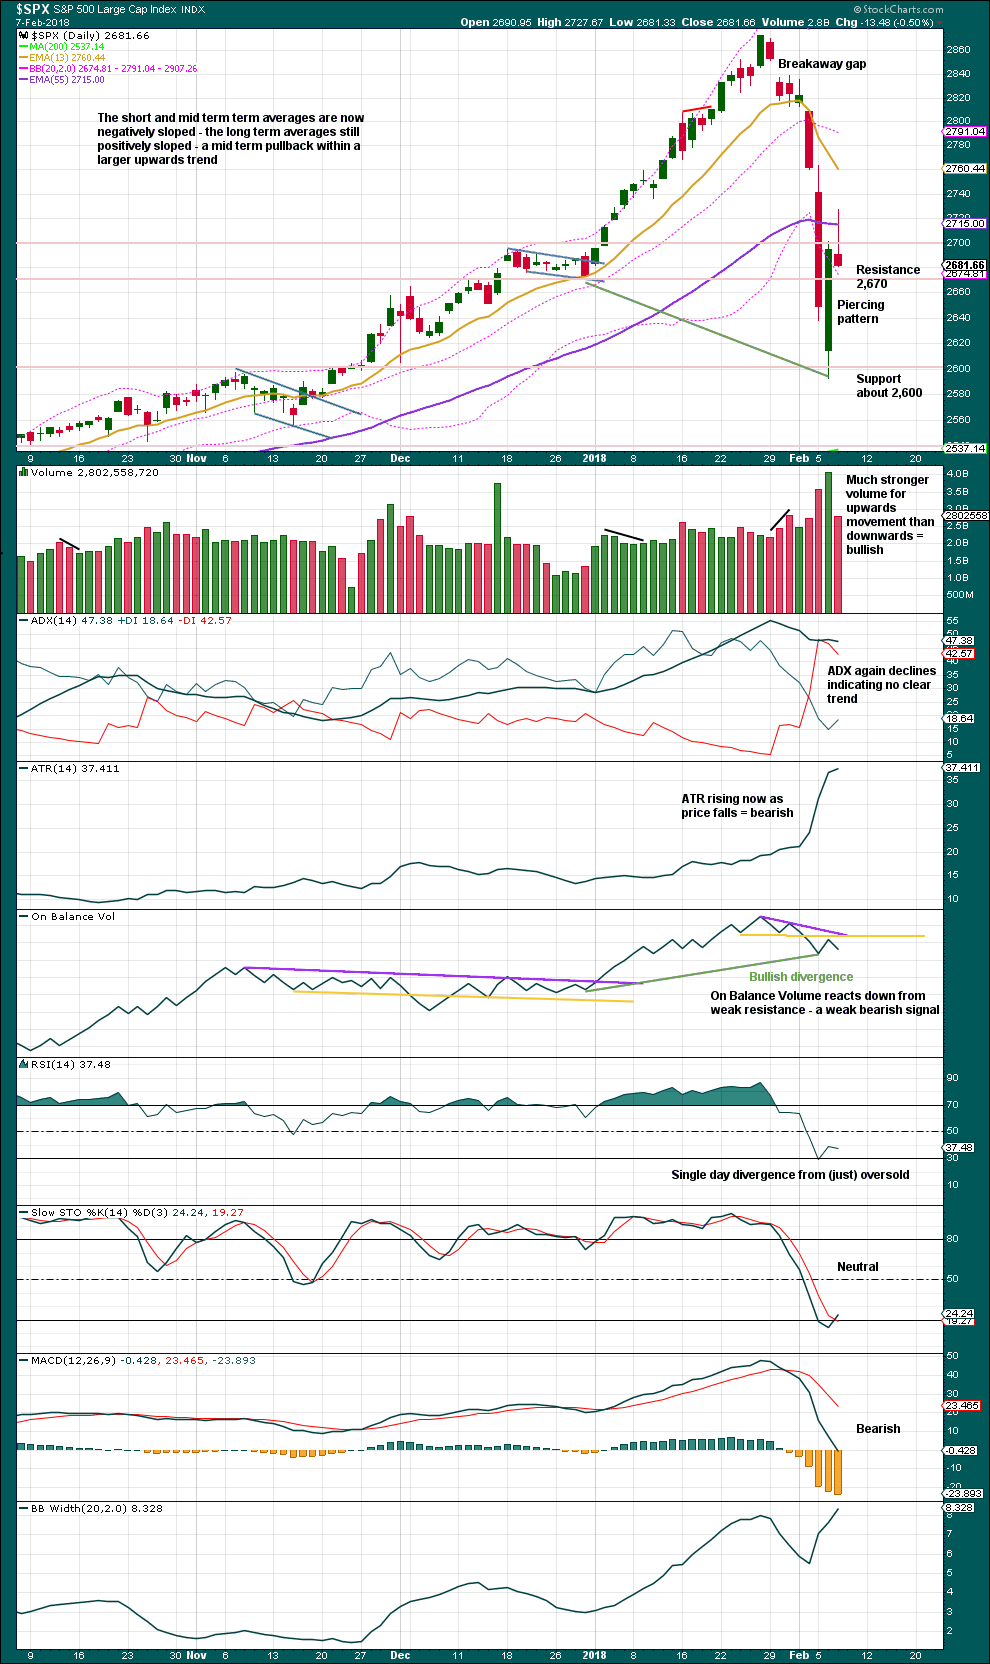
Click chart to enlarge. Chart courtesy of StockCharts.com.
Bullish: Price, short term volume, and RSI.
Bearish: Long upper wick on today’s candlestick, rising ATR, On Balance Volume (weak), and MACD.
Overall, it still looks like a low may be in place, but the long upper wick of today’s candlestick is concerning for that view.
VOLATILITY – INVERTED VIX CHART
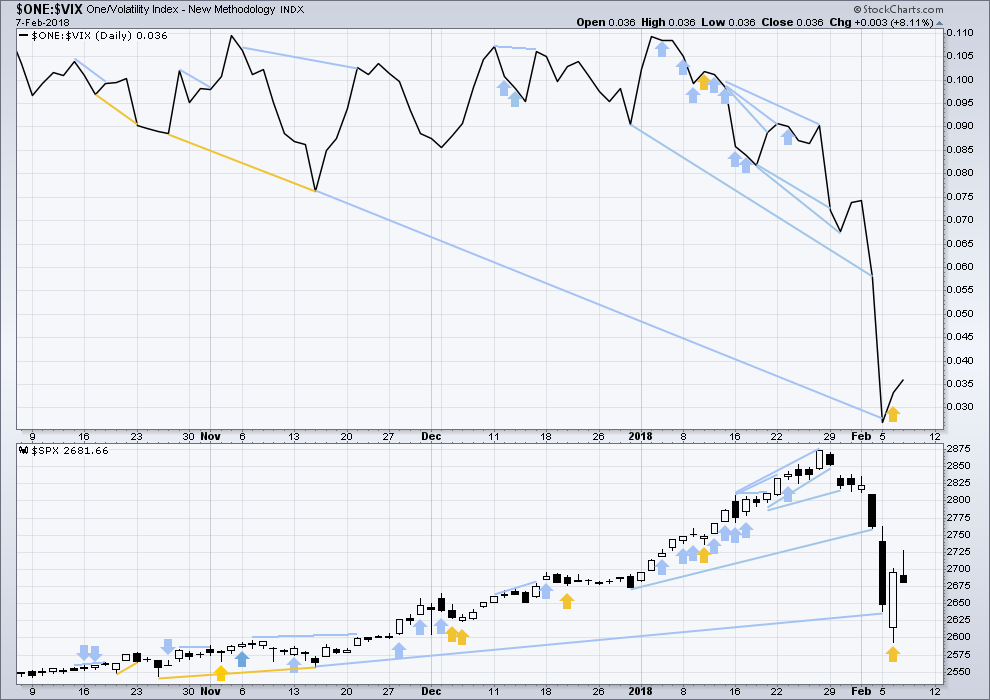
Click chart to enlarge. Chart courtesy of StockCharts.com.
So that colour blind members are included, bearish signals will be noted with blue and bullish signals with yellow.
Normally, volatility should decline as price moves higher and increase as price moves lower. This means that normally inverted VIX should move in the same direction as price.
Yesterday’s bullish divergence has now been followed by an upward day. It may be resolved here, or it may need another upwards day to resolve it. There is no new divergence today; the rise in price came with a normal corresponding decline in market volatility.
BREADTH – AD LINE
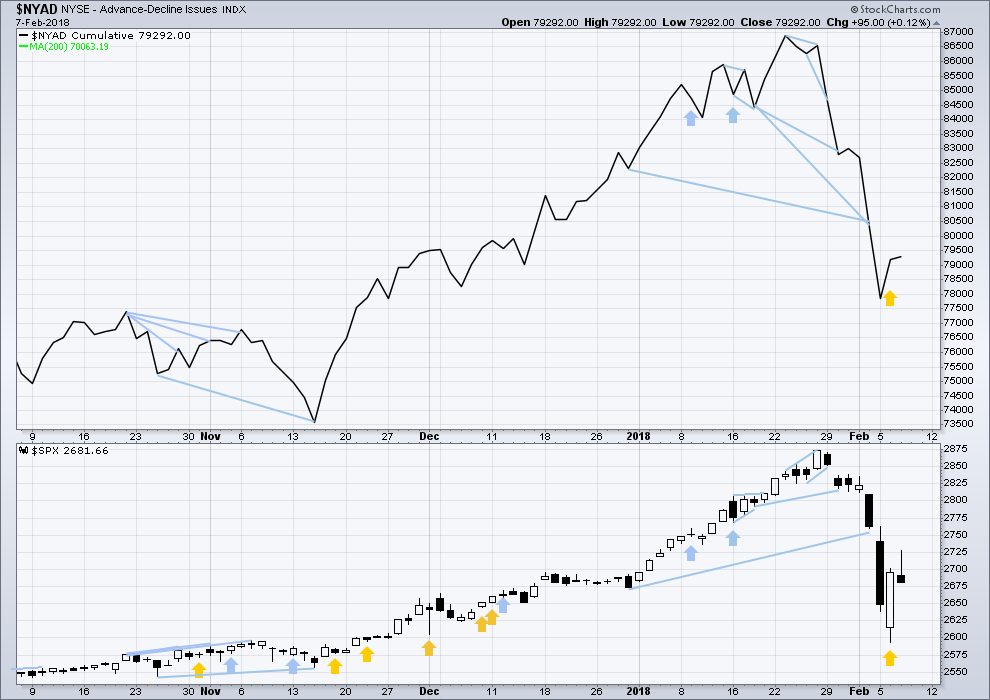
Click chart to enlarge. Chart courtesy of StockCharts.com.
There is normally 4-6 months divergence between price and market breadth prior to a full fledged bear market. This has been so for all major bear markets within the last 90 odd years. With no longer term divergence yet at this point, any decline in price should be expected to be a pullback within an ongoing bull market and not necessarily the start of a bear market.
All of small, mid and large caps last week made new all time highs. This market has good support from rising breadth.
Breadth should be read as a leading indicator.
Yesterday’s noted bullish divergence with price has now been followed by an upwards day. It may be resolved here, or it may need another upwards day to resolve it. The rise in price today was supported by rising market breadth; this is bullish.
DOW THEORY
All indices have made new all time highs as recently as three weeks ago, confirming the ongoing bull market.
The following lows need to be exceeded for Dow Theory to confirm the end of the bull market and a change to a bear market:
DJIA: 17,883.56.
DJT: 7,029.41.
S&P500: 2,083.79.
Nasdaq: 5,034.41.
Charts showing each prior major swing low used for Dow Theory are here.
Published @ 8:55 p.m. EST.

As per Lara’s alternate, 2,555 and 2,533 seem like great buying targets. Rates have reset, vol has reset, and now equities have reset. This all feels a bit chaotic, but my instinct is that rates and vol are near short term highs. The new Fed chair could simply send a tweet hinting at a rate cut or delayed rate hike and everything goes bonkers. That’s the world we live in. My only point is that it is difficult to be a bear (I am one).
I’m hoping for another 2% down day and some great buying opps. I’d also sell vol into that move. My only question, what happens to the wave counts if we break 2,500!??
“what happens to the wave counts if we break 2,500”
I have an alternate scenario. But it needs a breach of the big teal channel on the weekly chart, which at this time would be about 2,400.
Okay, thanks for following up Lara!
Well, they could not hold it but I would not chase this move down. As expected, they let it plunge into the close but I suspect they will try to pump futures big time. You simply have to be positioned ahead of time to catch these moves. These guys are becoming so predictable it’s kinda laughable. Take care everyone!
It looks like we get a lower high on VIX as we made a lower low in SPX. A sign that the VIX high was a SPX wave 3 down and now we are completing SPX wave 5 down. You taught me this Verne. Thanks.
Yes Sir! There’s a man that know what he’s talkin’ ’bout. Glad you noticed. Makes me think I am not completely wasting my time trying to help…
I too believe 5 of (1) is now or nearly/will be completed soon; 2557 pivot is my target. However, if that range does not hold we could see another round of waterfall.
Looks like the other indices have to join SPX in a new low so no overnight ramp probably…we should see new lows all around and a massive rally to end the week-end. I will be long and strong! 🙂
I don’t understand what you mean but right now futures are currently up.
Are you expecting to open lower tomorrow morning then possibly end the session in the green tomorrow?
Unless we get some kind of truncation that that is my expectation. Looks like futures in a fourth…
Come On Close Below:
SPX < 2,585.58
DJIA < 23,955.04
NDX < 6,320.64
SO close! Yea!!!!
There it is!
Looks like all three closed below…. so all 10%+ corrections from the Highs!
Hopefully that is how they settle out!
Now let’s find an entry points for the next waves UP!
10.36% for DOW Correction
Abandon ship!
Or…BOARD THAT SHIP!!?? Well, I guess it is still burning a bit….OOPS, there went captains cabin…
I wanted to get long bigly at a low price. It just keeps getting lower and lower!!
I want to correct myself: it’s not that I’ve stopped arguing with the bears. I’ve stopped “debating” the bears. I’m strive to have a neutral, nimble and “balance of the evidence” based view. When I’m there, every viewpoint is of value; it’s more data on what some segment of the trading universe thinks, and maybe specifics of why. That can be valuable, regardless of it’s immediate fit with our own evidence based view, whether it challenges it or it adds to it. More evidence: better view. So please, share the pearls, and let’s use all we’ve got to do better at making money. Hey, look at that market continue to slide down…only one more low to hold it back, I don’t even have any more fibo’s to bounce off of except the good old “100%”!! This is looking more C downish every moment now.
I appreciate your humility Kevin. I for one value your contribution on the forum and would never disparage a differing point of view, especially when supported by data. I have found over the years that disparaging commenters are generally traders of tiny accounts who would not recognize a market signal if one came up and bit the on them on the gluteus maximus. Nuff said!
As to the last bit of your comment, spot on.
They do come and go in this membership. I’m getting a bit tougher on removing anyone who disparages or is overly negative… and quickly.
We’re all here to make money. Helping each other with info and data is the way to go.
Verne, I apologize if anything I said came off as disparaging. But the point I am making is that you have been continually bearish since May 2017 (the first time I ever saw this forum). You have also talked a lot about conspiracies. But clearly you have not been short this entire time. I lost a lot of money going short in August & September 2017 when you yourself send the trend was “clearly down.” I have since stuck to small trades while I try to figure out what works and what doesn’t. I am still a little mystified as to why this move down was utterly missed by the wave count here, in addition to the August/September move up.
I am not trying to be overly critical to anyone here. I like the analysis and discussion that goes on here. But for a relatively new trader, it is hard to see beyond the noise. Missing the August/September move up and getting hit by this new move down is a major blow to anyone simply trying to simply match the S&P, much less beat it. I would appreciate if you yourself would not disparage traders with “tiny accounts” who you seem to think very little of because they cannot recognize “market signals” that haven’t even been very accurate for this admittedly short time window. I am just trying to learn.
Hang in there, Bo. Trading is hard and often disheartening. Learn everything you can from both your mistakes and your successes.
There’s some good help with that here on Lara’s comments section, but you need to weigh it against the main thing you’re here for: Lara’s analysis.
It’s also good to learn how to enjoy some of the entertaining bluster here without letting it derail you.
Bo, my response to Verne in no way meant to refer to you. Not at all. Just in case you were wondering.
I think you’ve been here long enough now to see that occasionally new people join and jump into comments without reading my comments guidelines. And occasionally I have to remove people. That’s what I was referring to.
Only two rules in trading: Never trade without stops, and when in doubt sit out.
Yep!
You’re absolutely right.
No hard feelings Bo. Just for the record, I have been with Lara for several years for a reason, and generally have active trades on based on her wave counts, and so should everone paying for her expertise. When I am uncertain or have a different opinion, I sit on hands or make different trading drcisions. I don’t at all mind telling you that Lara is usually right, and I am wrong, but clearly you have figured that out on your own. My running commentary on the forum is obviously based on my OWN personal bias about a market that continued upwards without a meaningful correction for longer than I can remember. I am truly sorry if you made some bad trades based on my commentary or my bearish viewpoint but you should NEVER allow other people’s opinions to control your trading decisions. Believe me when I tell you that I learned that lesson the hard way as it cost me tens of thousands. And that was trading advice I was PAYING for. We are all here hopefully to help one another, and wrong or right, I openly share my opinions, and occasionally a trade or two I am actually making BASED on a shared opinion. Thanks for the clarification. I really sppreciate it.
New lows in ES and YM but not NQ. It sure looks like they are going to hold it here. Bullish engulfing candles being printed as we speaks. Wow!
Grabbing a few calls expiring tomorrow and I am outta here!
Have a great evening all!
Absolutely incredible! Am I the only one watching this???!! 🙂
ES prior low was 2613.50
New low 2612.50
Just a co-incidink… of course!! 🙂
Looks like some indecision as support is tested. Back in SPXU in case support gives way. Pretty tight stop in case it holds.
Out with a quick scalp. I might end up wishing I held overnight, but ya’ll know what Cramer says…
Oops… kinda wish I stayed in 10 minutes longer, but what ya gonna do?
Walk away and smile all day! Nicely played.
What bulls do NOT want now is a gap lower…..!!
Yikes!! Another 666???!!!! 😀
We have an ES break. Mr. Market could care less what traders think. He just does his thing! 🙂
Some short instruments have NOT priced in the move we are seeing and a continued move down is going to see some outsized gains in a few of them….
Big cash dump going on in ES after the break…will it reverse?
ES fairly close to breaking to new lows. It is not looking like anyone is front-running the futures market to me so we could be heading lower along with ES if futures makes a new low…
Just in case we bounce cashing in futures trades…very nice scalp!!
Selling remaining half of SPXU calls. If we make a new low will reload…BIG TIME! 🙂
If not, get ready for a furious upside reversal for a possible C wave imho….
TMV has been working in strong synchrony with SPX all day today. Interesting. Right down to the minute level, even. I’m watching TMV to see if it flashes some bullish action in SPX before the fact…possible. Meanwhile, no buy trigger (8 > 34 ema on 5 minute) in SPX yet.
Alternate hourly updated:
Targets still the same. This wave count has an overall better look than the new idea I’ll publish below it.
New idea:
It’s possible that the last wave up was a single complete five. But as you can see, the middle of it labelled minuette (iii) does not look like an impulse on this time frame. You have to go down to the 5 minute time frame to make it work, and it does work hence we need to consider this possibility.
The poor look of that five up is why I didn’t publish it yesterday. Perhaps I should have 🙁
Anyway, let us see what the technicals tell us today after the session has closed.
Price range of 2,593.07 to 2,727.67 – while price is within this zone both ideas are valid.
Bounce of recent lows, a 5 minute swing high has been exceeded. 8/34 ema crossover is still ahead. This is looking rather bottom-ish, more confirmation needed though.
This bounce looks to me like it might possibly be wave 4 of an incomplete downward C, depending on how one labels yesterday’s moves off the high.
One more plunge before the rally resumes?
Interesting view, could be, could be….
Or, the 4 and 5 of the downmove are both already done. The 10:30-11am move could have been the 4. The current day’s low is suspiciously right at the lows (3 hits) from Feb 6.
Possible. I am wondering about another corrective C wave up. The waves are all still looking corrective to me… although I certainly could be mistaken.
I am getting positioned for a ramp up if we do not make a new low before the close….
We have a lower high in VIX. It needs to remain below the last high to rule out a third wave down so we need to pay attention people! I still think we bounce hard at the 200 day…
Taking half SPXU off the table…thank you!! 🙂
Let’s get a close that records at least a 10% correction in all the major indexes and then re-evaluate from there.
It is below there where the turn and/or next wave up may begin.
SPX < 2,585.58
DJIA < 23,955.04
NDX < 6,320.64
I think it will change the Psychology. What do you all think?
The sooner the better!
The complacency now is on the bears end now methinks. There is still wayyy too much power behind this bull market for the bears to be this giddy. Credit markets are quite safe and the big banks are too. And the economy is as strong as it has ever been. Talking about a bear market and a 50%+ drop is just wishful thinking. There is enough power behind this bull that we could hit ATHs next week.
I’ve always wondered, what is the bears’ plan when their broker goes belly-up after they get their dream come true and the market declines 90% and the world economy implodes? Physical gold? Guess we shoulda been listening to Rickards after all!
Bearish complacency?! You’ve gotta be kidding me dude!
Did you see where VIX was trading ahead of this dive?
No, I am quite serious with regard to the current price action. VIX hitting 50 is ludicrous in this context. While the bulls were complacent for much longer, the bears are clearly getting way too far ahead of themselves. Monday morning we hit VIX levels (50+) seen only during the darkest days of the dotcom crash, the crash of 08-09, 2011, and 2015. The VIX had it’s biggest overnight jump of all time. Does that honestly make sense to you?
We have people talking about an *acceleration* downward, as if Monday’s 5% dip wasn’t fast enough. As Lara has said many times, every bear market for the last 100 years has been preceded by months of divergence in the AD line. As the bears usually say, why would it be different this time?
Won’t be different. Market’s had a relatively minor correction. As I said a few weeks ago, with every such wave 4 we encounter going forward, somes folks are going to say “the top is in!” and predict sell offs that will never end. And will be wrong, until they are right. It’s rather funny to realize that this “huge” sell off only took price back to…one to two months ago prices! Whoop-te-doo is all I can say. Overdue tempering of mania. But the mania isn’t close to over. Earnings will be soaring over the next several years. This market is going to go way, way higher before it’s over. In my opinion. Which I won’t trade. I’ll trade the actual price action.
What’s ludicrous is the current equity market valuation. Plain and simple, it’s all that matters long term.
I am quite intrigued by your query about the bears’ plan in the event of a meltdown. I get the impression you think this is something the bears a rooting for with malicious glee. While that may be true for some, I think most serious traders have learned to divorce their emotions from their trading decisions. You heard me going on interminably about the extreme vol situation in the market based on what I saw. That does not mean I am happy about the trader in Singapore who lost a cool million in XIV. Having said that, I just happen to also agree that a lot of short side trades will not be paid if the market implodes and have said as much. Brokerage instruments are NOT FDIC INSURED.
But we all knew that!
I pretty much gave up arguing with the bears here long ago, and just let the price action speak….we have the first indication this little sell off might be complete. If it’s not part of the overall 4 wave down (???), then what is it? I still suspect is a big 2. Waiting for clear trend change + buy triggers now. Or maybe price will renew its plunge. WTF knows! No one.
I agree, it’s pointless to talk to argue with people who seem to always think that the market should be going down. I always appreciate your sensible takes around here in the face of all the conspiracy talk we get around here. The move today looks like a deep 2 imho. Unless we see a massive acceleration downward into the close. Which could happen, because like you say, anything is possible. But honestly I think everything so far has been a calculated, algo-driven move to wipe out the VIX shorts (which they have clearly done).
Pigs get fat, hogs get slaughtered…..being one-sided is a fools errand
Well Chris, let’s just keep quiet and keep on trading….hold onto the “pearls”…. 🙂
Ha ha, will do bud…..Pearls abound
It’s possible that this could be a deep second wave…. if the last wave up from low to high is one single complete five.
Looking at the five minute chart that is possible. The proportions aren’t good, but then the S&P doesn’t always produce good proportions.
I agree…pointless indeed…!
Stink bid on VIX 30 strike Feb 14 calls for 3.00 even… 🙂
Oops…I meant VIX puts!!! 🙂
Here is what I think is next. The stubborn bulls will capitulate at the next low and the WG executes their buy order, probably defending the critical 200 day MA.
Hear me now and believe me later, if we blow through it the way we demolished the 50 day…”Farewell and Adeiu, to you Spanish Ladies…!” 🙂
Verne,
You might be correct if this was a fair situation and level playing field. I can’t imagine the people incharge will ever allow this thing to get out of hand. I know markets are bigger that the players playing it but with unlimited supply of resources (and money) the breakdown will be much controlled to their liking not what can happen in an ideal situation.
No argument here. If it goes South, it will do so without their consent.
OK I get it. Try to keep it propped up during the bulk of the cash session, let it crash into the close, then rip the faces of bearish trades of the Johnny Come Latelys who try to hold overnight…just way too cute…
What I see is nominal backing and filling after a giant plunge. Normal market behavior, setting up the next significant rally. Could be wrong; let’s see if the monday low holds or not. That battlefield is still a ways south of the current line of bull/bear demarcation!
The real plunge is still ahead methinks… 🙂
Still WAY too much complacency!
Well, that would be Lara’s hourly alternate right there…
You would have to be BLIND, not to see that amigo…! 🙂
SPXU coiling for blast higher….
Not sure why the WG is wasting their time and capital trying to fight Mr. Market. He clearly intends to visit that 200 day. I guess they just don’t want him arriving too soon…lol! 🙂
The bulls had better hope this is a C or fifth and not a third!!!!
No panic in futures…yet…
Looks like they are expecting the cavalry…
The ultra short SPXU might take out its recent high. VIX price action today clearly shows traders were NOT expecting this plunge…
Nicely profitable here in SPXU this AM.
You mean I was not the only bear???!!! 🙂
VIX spike should be coming up. Opening another stink bid to catch the pop.
The easiest triple you will ever make! 🙂
A sharp C down to tag the 200 day would be the mother of all reversal triggers and probably complete a beautiful 4th wave ZZ.
TIMBER!!!!!!!!!!!
Looks to me like we are headed for new lows. I am putting on some futures trades while they monkey around in the cash session. We could see all hell break loose over there if they can’t prop up the cash session…
I expect some furious intervention from the working group. Either they loose control with a monster three or five down, or they continue to successfully distort market price discovery….
It would be an AWESOME bullish sign if we see a new maket low AND a lower VIX high… 🙂
Keep an eye on futures. If they suddenly turn around it means another cash dump is on its way to the cash session via contingency buy stop order from our friends. If it heads South big time, a C, fifth, or third wave could be on deck…
A cursory look at option chains suggests to me that market makers are in a state of full blown panic. We expect premiums to rise and spreads to widen as vol rises but come on….! This is way beyond ludicrous. What is it exactly, that has these guys so spooked??!!!
Cashing in DIA 249/250 bear call spread expiring tmorrow.. Move up looked corrective. Holding SPXU 11.00 strike calls…
62% retrace at 2666.5, key SPX turn decision point approaching.
Hold that line!
Held once, probably will hold twice, but now it’s looking like it’s going to be a small range, meandering day as the ringing continues to fade. Maybe a real new 3 launches at some point…but aiiii, my internet connection keeps resetting every 5-10 minutes!!! Arrrggghhhh!!! Hard to trade when you aren’t connected….
It appears to me that the main hourly count has been violated by going below 2668.62 (a 4th wave cannot enter into wave one territory). Thus the alternate hourly now calls for a new low.
Nothing very bullish about what’s going on right now imho.
I am fully aware that does not mean much with you- know- who waiting in the wings. I wish we could get some return to normal price action where market signals can be relied upon to execute trades, but now it is a minefield….yikes!
True and price is still falling. That said, there is ANOTHER alternative hourly (Lara didn’t analyze/show it) I believe wherein this pullback overall is yet another 2 instead of a 4. I think (not an expert) that’s a legitimate alternative count at this point. How likely I dunno. Bottom line for me: I’ll be watching for a turn and buy triggers one of the lower fibo’s. 2651.5 is a key 76%, there’s also a larger 50% at 2660.5, and then another 62% down at 2644.7. So lots of places for a potential turn and run the other way. I don’t think Monday’s lows get taken out myself, but I try to put what I “believe” aside and just work off the action the market gives.
Here’s the chart showing the fibo’s.
Don’t you think it rather sluggish for a second wave in an impulse? They are usually quite sharp…
from 2728 to 2644 in about a day, I don’t view that as sluggish. In fact, the momentum down here seems to be increasing, since yesterday. Maybe we’ere going to get a retest of the 2625 area lose Real Soon Now.
I didn’t chart the idea because the proportions are just so awful. The idea is invalidated with a new low below 2,627.57 anyway now.
Well, either my trying a full power cycle, OR more likely my son fiddling with the reset switch on the UVerse modem that was maybe glitching seems to have solved the problem. Mental stops? Don’t work if you aren’t connected, lol!!!
Ai yi yi, every 5-10 minutes, down. No AT&T service repair here until Saturday. Can’t really trade in these conditions! Time to pay bills and play some guitar I guess…though maybe the box will magically heal itself and stop failing. Anything is possible with technology.
AT&T coming on Saturday but meanwhile…I tried the old “hit the small red reset switch” on the back of the uverse box and so far…so good! We’ll see.
down, up for a few minutes, then down…just like this market!!
can anyone please advise me which broker I can trade spread bets on the S&P 500 cash market and where I can get the S&P 500 cash charts? I think Stockcharts do the latter?
I would imagine any of the major houses will let you do it with a margin account, and level 5 trading priveleges.
Verne, what was up with uvxy price action today? Up strongly versus a red VIX…
It seems rates and vol are highly correlated and they are both moving higher. I don’t see that reversing in the short term. I understand that we are seemingly still in an uptrend but im finding it hard to buy the dip with this backdrop. Although, it helps knowing a large portion of the short vol trade has been removed. Who said this was easy!?
It is interesting. The long vol futures instruments did not trade with the same dramatic outcomes the short ones did, and I am not certain why not. Reverse splits do not account for the huge disparity and my conclusion is the unwind is just beginning.
At the end of the day, the price should reflect the funds NAV no? The short funds got destroyed buying at market without liquidity. Long funds probably got stuck not long enough contracts and wound up doing the same. The irony here is both the levered long and inverse funds needed to buy vol into close. They created a monster!
Exactly! If anything, the long vol levered funds should have exploded even more than the short ones.
Paul Craig Roberts is reporting that “The Working Group” is back at it full time and the hedge funds see submission of their buy orders and are front-running them. If these ramps continue to be faded I think that is a bad sign for the markets. I see long vol futures continue to rise even as VIX declines. As I said, somebody thinks we are not out of the woods yet! 🙂
The market is still ringing like a bell (large range days continuing).
I like the short term end of day action (pullback), and I think a great long entry point might set up and trigger tomorrow, as this could be a larger 2 rather than a smaller 4. I’ll be watching for a turn on one of these fibo’s followed by some 8/34 ema cross overs, swing highs penetrated, and my trend indicators turning positive colors (yellow/green/purple; they are based on CCI and ADX and hueristics). The chart is 5 minute bars.
So when an invalidation gets taken out overnight on ES, like today, does that count towards the EW targets? Does this BOUNCE off 2655 count?
/ES doesn’t count at all, according to Lara.
Lara considers them distinct markets. I saw amazing proof of that recently when ES tagged its 200 day but the cash session failed to do so. I attribute that to a huge working group cash infusion. I wondered why futures were up when the markets were down recently. Apparently the working group had a huge contingency buy order and the hedge funds front-ran it via the futures market…figures!
Wabbit? Wabbit? HEY WABBIT!!!
That’s “Mr.” Wabbit to you Doc, or if you prefer, ‘Your Royal Hare-ness!”