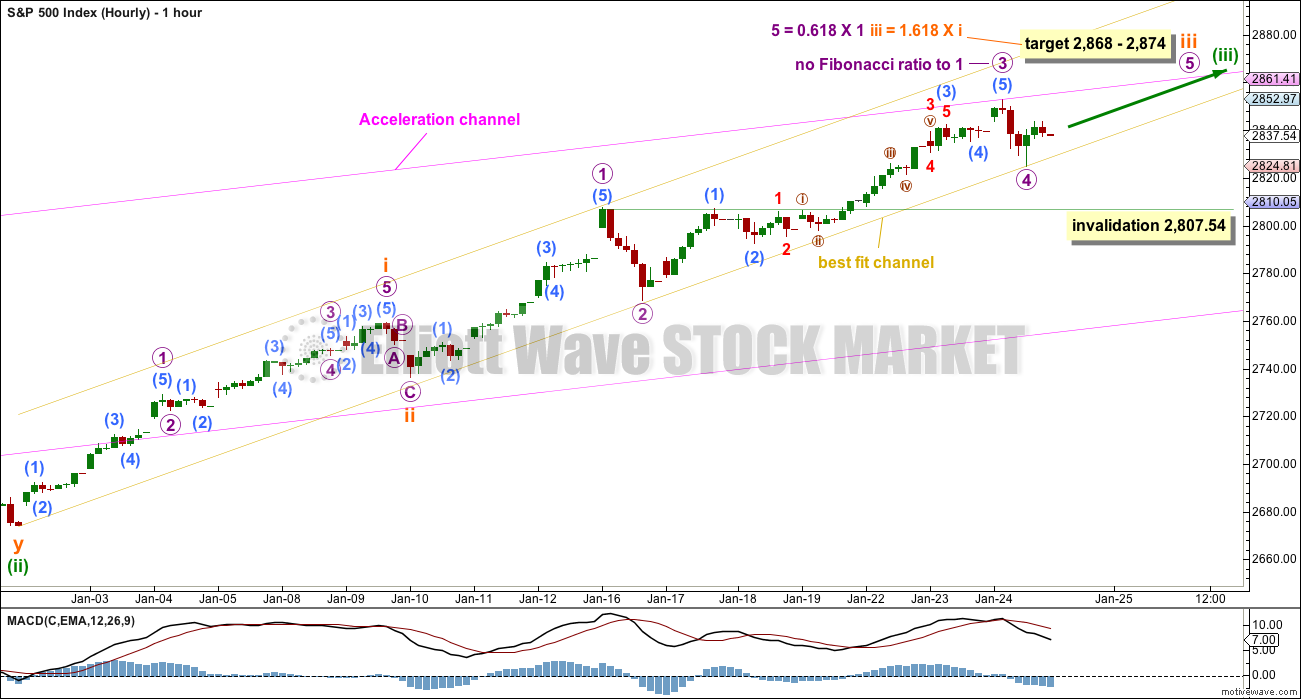
Downwards movement during the last session bounced upwards almost exactly at the support line on the hourly chart, offering members another entry opportunity to join the trend.
Summary: The trend is up and strong. Corrections are an opportunity to join the trend.
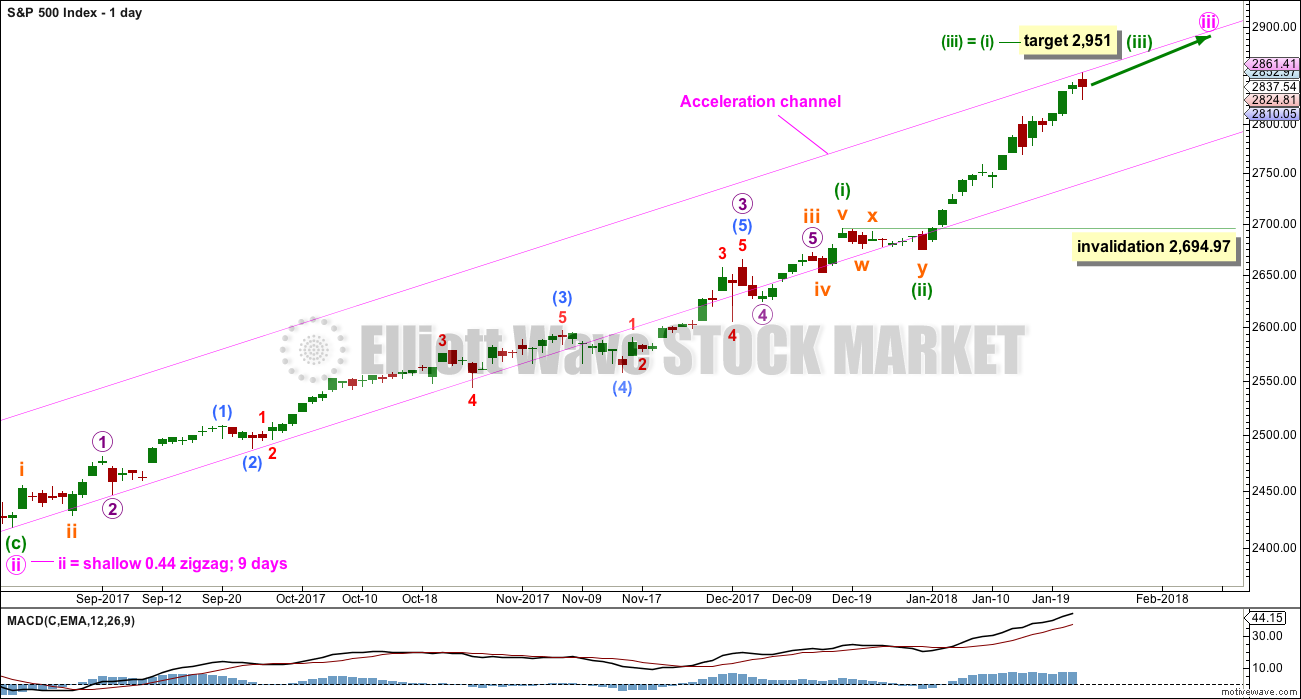
The next target is widened to a small zone at 2,868 – 2,874 for a very short term interruption to the trend (it may be over within a day), and the target after that is at 2,951 for another short term interruption to the trend (it may be over within a week).
This looks like a third wave that is still incomplete.
Always practice good risk management. Always trade with stops and invest only 1-5% of equity on any one trade.
The biggest picture, Grand Super Cycle analysis, is here.
Last historic analysis with monthly charts is here. Video is here.
An historic example of a cycle degree fifth wave is given at the end of the analysis here.
MAIN ELLIOTT WAVE COUNT
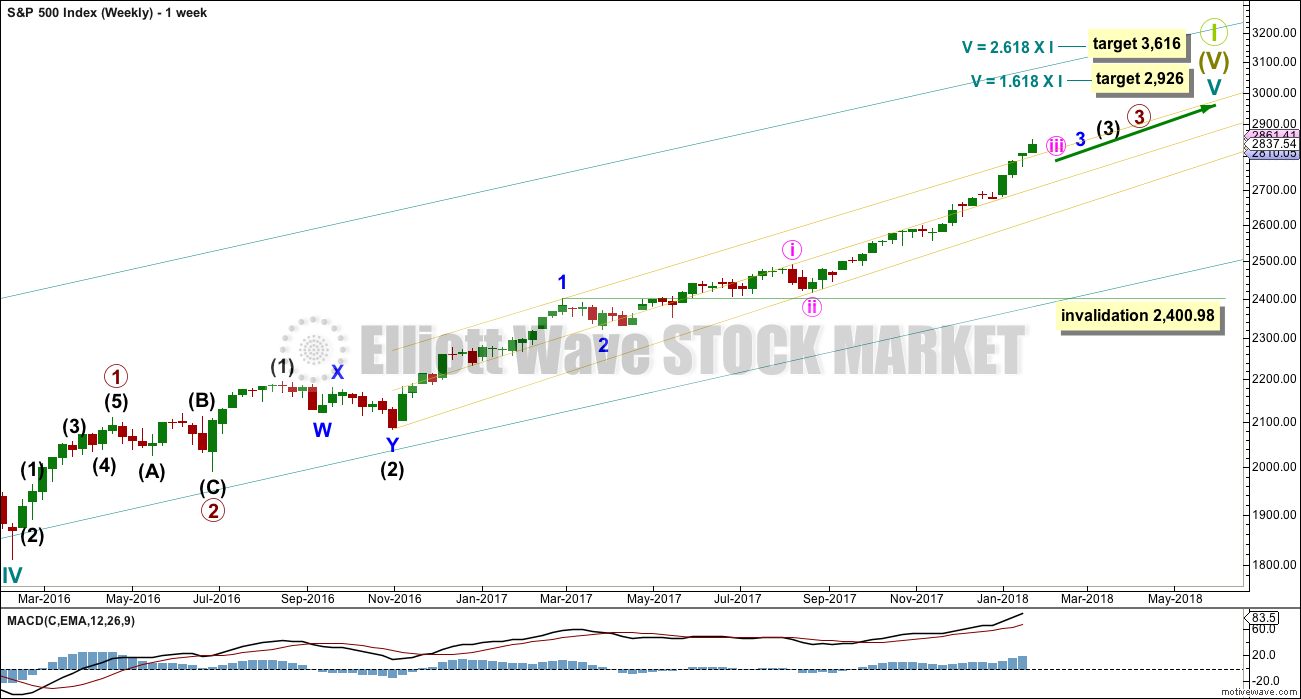
WEEKLY CHART
Cycle wave V must complete as a five structure, which should look clear at the weekly chart level. It may only be an impulse or ending diagonal. At this stage, it is clear it is an impulse.
Within cycle wave V, the third waves at all degrees may only subdivide as impulses.
Within cycle wave V, the corrections for primary wave 2 and intermediate wave (2) both show up clearly, both lasting several weeks. The respective corrections for intermediate wave (4) and primary wave 4 should also last several weeks, so that they show up at weekly and monthly time frames. The right proportions between second and fourth wave corrections give a wave count the right look. This wave count expects to see two large multi week corrections coming up.
Cycle wave V has passed equality in length with cycle wave I, which would be the most common Fibonacci ratio for it to have exhibited. The next most common Fibonacci ratio would be 1.618 the length of cycle wave I. This target at 2,926 now looks too low. The next most common Fibonacci ratio would be 2.618 the length of cycle wave I at 3,616. This higher target is looking more likely at this stage.
Intermediate wave (3) has passed all of equality in length with intermediate wave (1), and 1.618 and 2.618 the length of intermediate wave (1). It is possible that intermediate wave (3) may not exhibit a Fibonacci ratio to intermediate wave (1). The target calculation for intermediate wave (3) to end may have to be done at minor degree; when minor waves 3 and 4 are complete, then a target may be calculated for intermediate wave (3) to end. That cannot be done yet.
When minor wave 3 is complete, then the following multi week correction for minor wave 4 may not move into minor wave 1 price territory below 2,400.98. Minor wave 4 should last about four weeks to be in proportion to minor wave 2. It may last about a Fibonacci three, five or even eight weeks if it is a time consuming sideways correction like a triangle or combination. It may now find support about the mid line of the yellow best fit channel. If it does find support there, it may be very shallow. Next support would be about the lower edge of the channel.
A third wave up at four degrees may be completing. This should be expected to show some internal strength and extreme indicators, which is exactly what is happening. Members are advised to review the prior example given of a cycle degree fifth wave here. The purpose of publishing this example is to illustrate how indicators may remain extreme and overbought for long periods of time when this market has a strong bullish trend. If the current wave count is correct, then the equivalent point to this historic example would be towards the end of the section delineated by the dates November 1994 to May 1996. In other words, the upwards trend for this fifth wave may only have recently passed half way and there may be a very long way up to go yet.
DAILY CHART
Keep redrawing the acceleration channel as price continues higher: draw the first line from the end of minute wave i to the last high, then place a parallel copy on the end of minute wave ii. When minute wave iii is complete, this would be an Elliott channel and the lower edge may provide support for minute wave iv.
The focus for the short term will be on identifying the next multi week interruption to the upwards trend.
A target for minuette wave (iii) fits only with the second higher target on the weekly chart.
Minuette wave (ii) subdivides as a combination and lasted only eight sessions, about only one and a half weeks. Minuette wave (iv) may be a zigzag, which tend to be quicker structures than combinations; a Fibonacci five days will be the first expectation, but it may be over within less than one week.
Because minuette wave (i) was a long extension, minuette wave (iii) may be shorter or only about equal in length. If minuette wave (iii) is about equal in length with minuette wave (i), then they would both be long extensions. Only two actionary waves within an impulse may be extended. If both minuette waves (i) and (iii) are extended, then minuette wave (v) may not extend.
Minuette wave (iv), when it arrives, may not move into minuette wave (i) price territory below 2,694.97.
HOURLY CHART
Always assume that the trend remains the same until proven otherwise. At this stage, there is no technical evidence for a trend change; we should assume the trend remains upwards.
Subminuette wave iii is extending, and within it micro waves 1, 2, 3 and now 4 may all be complete. Micro wave 5 may be underway.
There is no Fibonacci ratio between micro waves 3 and 1, which means it is more likely that micro wave 5 may exhibit a Fibonacci ratio to either of micro waves 1 or 3. Fifth waves most commonly exhibit Fibonacci ratios to first waves.
The target for subminuette wave iii to end is now widened to a zone calculated at two wave degrees. Favour the lower edge of this zone as it is calculated at a lower degree.
The best fit channel is very slightly adjusted today. It is now drawn from the start of minuette wave (iii) (on the bottom left hand corner of the chart) to today’s low. A parallel copy is placed upon the high labelled micro wave 1. This channel contains all recent movement for this third wave.
The bottom line is that assume the upwards trend for the short term is intact while price remains within the channel. A breach of the channel to the downside by clearly downwards movement (not sideways) would indicate a more time consuming consolidation or pullback may have arrived. It would still be expected to be over within a few days to two weeks maximum.
If it continues further, then micro wave 4 may not move into micro wave 1 price territory below 2,807.54.
TECHNICAL ANALYSIS
WEEKLY CHART
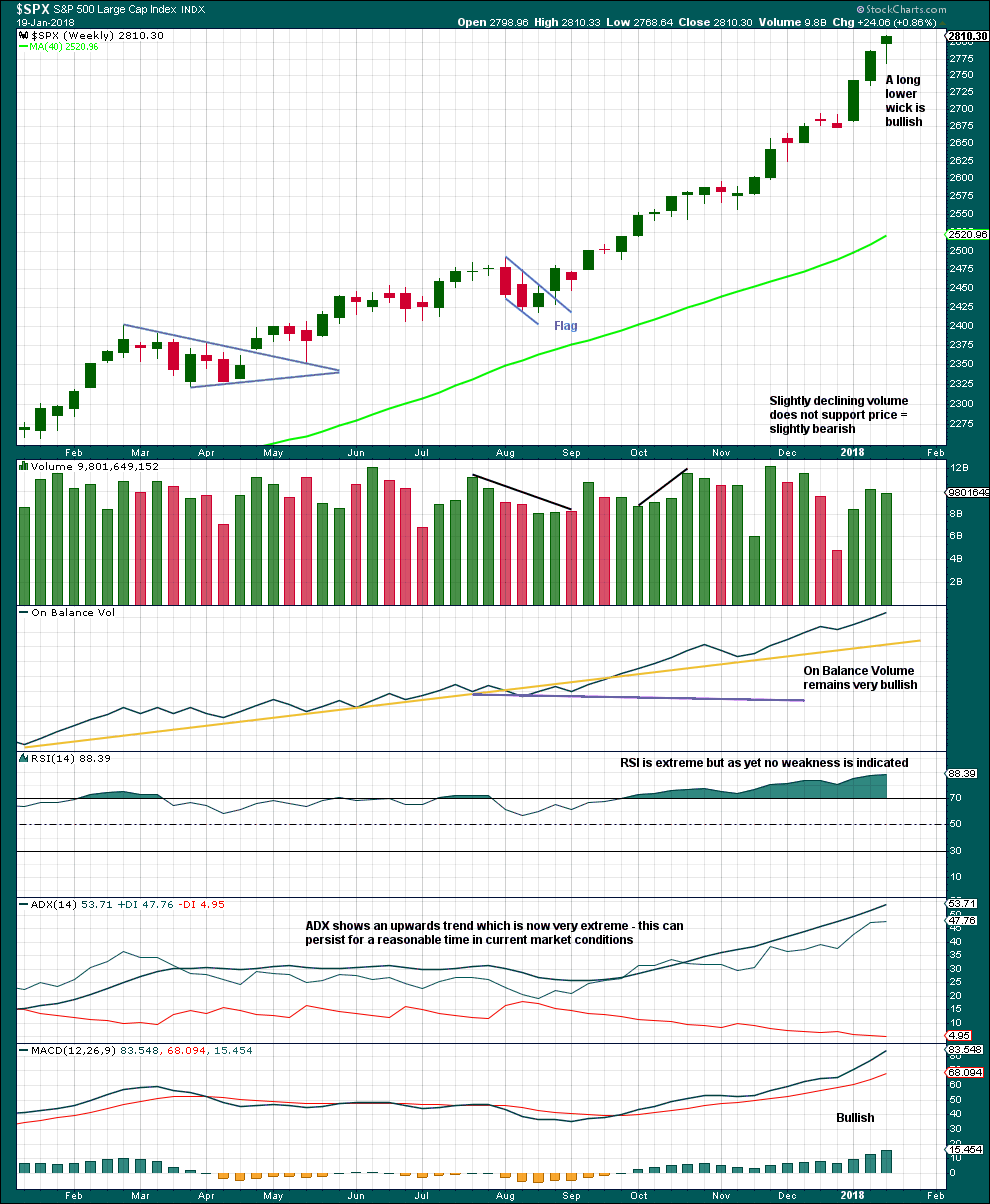
Click chart to enlarge. Chart courtesy of StockCharts.com.
This upwards trend is extreme and stretched, but there is still no evidence of weakness at the weekly time frame.
As a third wave at multiple degrees comes to an end, it would be reasonable to see indicators at extreme levels.
A correction will come, but it looks like it may not be here yet.
DAILY CHART
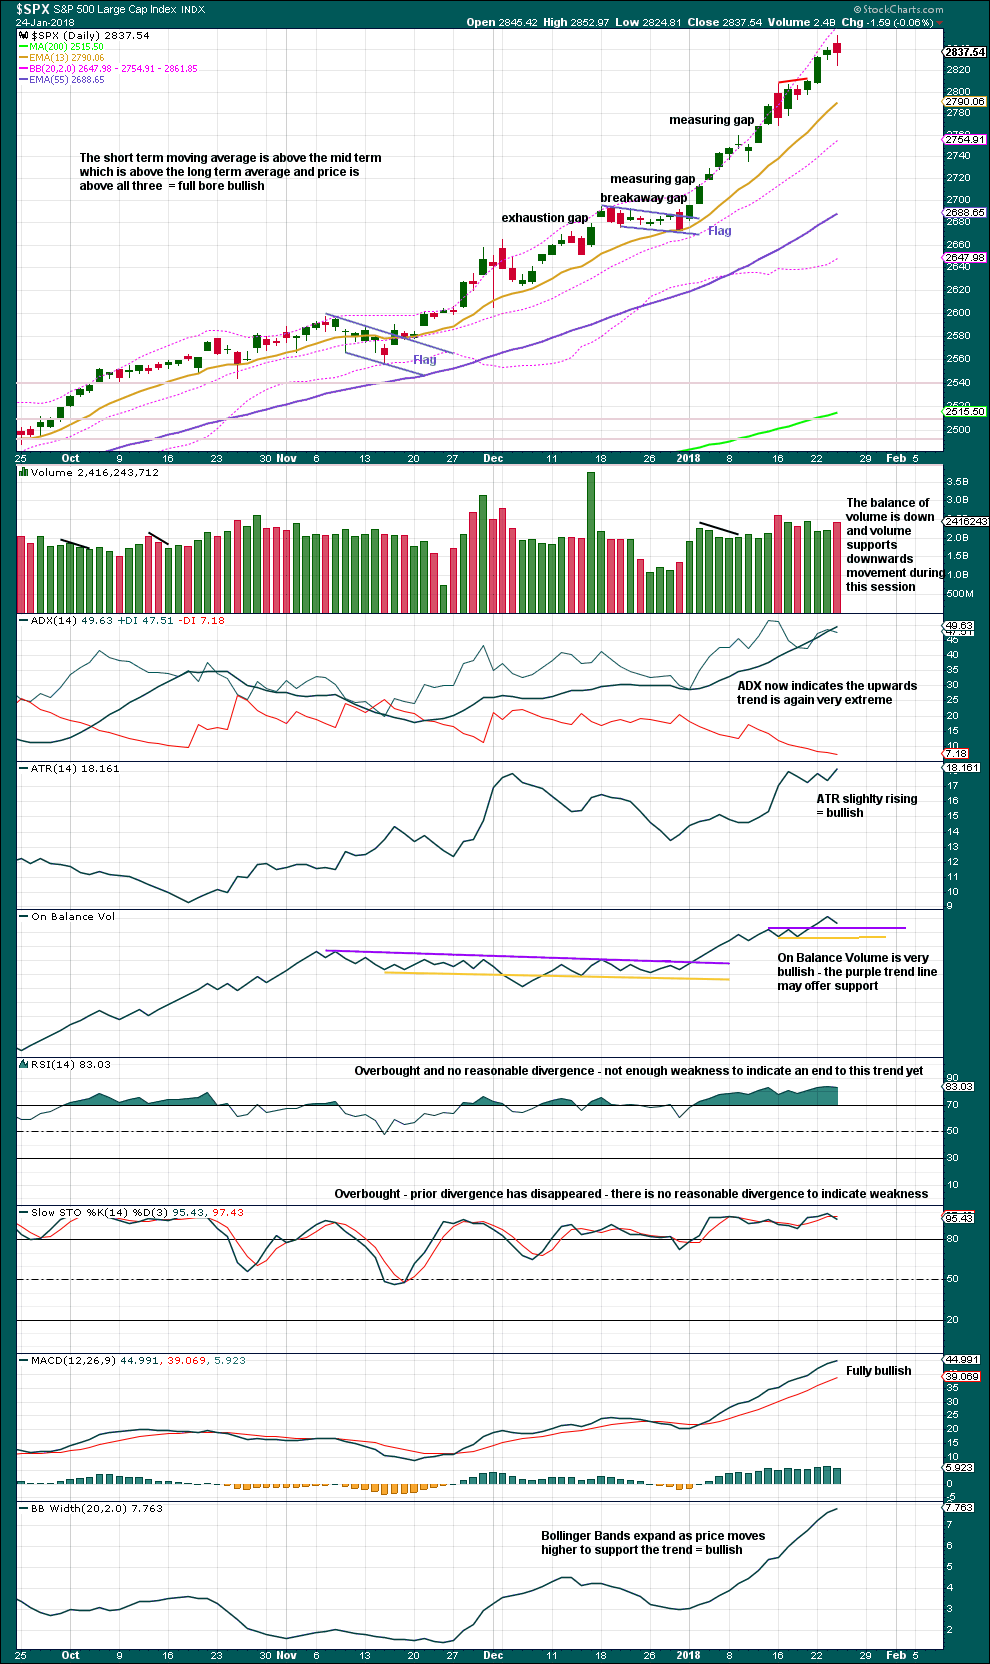
Click chart to enlarge. Chart courtesy of StockCharts.com.
Today’s candlestick has a relatively small real body and slightly longer lower wick. This looks like a spinning top with slightly bullish implications from the slightly longer lower wick.
Although volume shows an increase today for a day with the balance of volume downwards, this has happened as recently as the 25th of October, 2017, yet price turned and continued upwards straight afterwards.
On Balance Volume has a little further downwards to go before it may find support. This may allow for a little more downwards movement tomorrow.
VOLATILITY – INVERTED VIX CHART
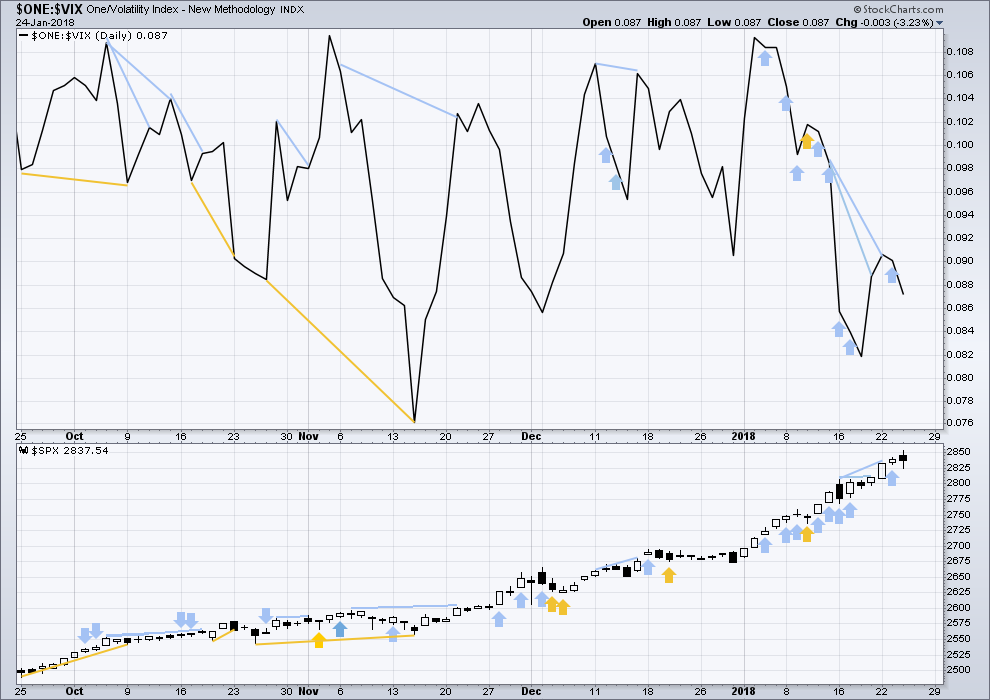
Click chart to enlarge. Chart courtesy of StockCharts.com.
So that colour blind members are included, bearish signals will be noted with blue and bullish signals with yellow.
Normally, volatility should decline as price moves higher and increase as price moves lower. This means that normally inverted VIX should move in the same direction as price.
There is still strong short term divergence between price and inverted VIX. The new high in price has not come with a normal corresponding decline in market volatility. This is bearish.
Today’s session was an outside day with the balance of volume downwards and a red daily candlestick. Downwards movement of price during this session had support from a normal increase in market volatility.
BREADTH – AD LINE

Click chart to enlarge. Chart courtesy of StockCharts.com.
There is normally 4-6 months divergence between price and market breadth prior to a full fledged bear market. This has been so for all major bear markets within the last 90 odd years. With no longer term divergence yet at this point, any decline in price should be expected to be a pullback within an ongoing bull market and not necessarily the start of a bear market.
All of small, mid and large caps last week made new all time highs. This market has good support from rising breadth.
Breadth should be read as a leading indicator.
Downwards movement during this last session has come with a normal decline in market breadth. The fall in price has support from declining market breadth, but breadth shows no divergence and has not made an important new swing low.
DOW THEORY
The S&P500, DJIA, DJT and Nasdaq last week all made new all time highs. The ongoing bull market is confirmed.
The following lows need to be exceeded for Dow Theory to confirm the end of the bull market and a change to a bear market:
DJIA: 17,883.56.
DJT: 7,029.41.
S&P500: 2,083.79.
Nasdaq: 5,034.41.
Charts showing each prior major swing low used for Dow Theory are here.
Published @ 09:15 p.m. EST.

I don’t know how many people paid attention to Chris’ comment about central banks’ participation in markets. The notion is regularly pooh poohed as “conspiracy theory” by the un-informed but if you doubt what he is saying just go to the CME website and search information about CBPBP purchases, i.e. the Central Banks Preferred Buyers Program. It gets worse folk. Not only are central banks buying their own and each others’ equity markets, they are doing so with additional trillions of Dollars illegally loaned to them by our erstwhile FED. Does this mean the market is going to crash tomorrow? Of course it does not. It just means you should know what you are talking about before you dismiss the notion of CB market intervention. Thank you! 🙂
Very sad truth I’m afraid. Don’t know the pathway back to free markets but a collapse of central banking is certainly one of them. Trade Safe!!
It’s not useful as a timing tool for when this bull market is going to end, but IMO it points to weakness within the market.
When the bull market does end then the ride down may be particularly steep.
Certainly not useful for timing; continually revising and extending counts, pattern failures, and unfathomable lack of price discovery. Weakness is building and building which is why they won’t let the market correct, which reinforces my opinion that we won’t get a correction when it stops, just free fall.
It truly is remarkable how commonplace negation of what used to be fairly reliable reversal signals has become. Very tough executing bearish trades.
Yep. I agree about how untenable a normal correction has become.
By my analysis, a VIX close below 11 would be a significant break from the recent upward trend in volatility and would signal a potential return to the 9s. On the other hand, a close above 13 would signal the break of an *extremely* consistent trendline stretching all the way back to August 25, 2016 (day after the flash crash). That could very well herald the end of the Trump rally and the first significant correction since 2016. IMHO there is not enough divergence for that and the upward momentum here has been too strong for there to be major concern. RUT hit an ATH yesterday and has been leading this Trump rally. I like the possibility of a triangle here. Of course, it would be quite fitting for the market to correct here now that I added more longs two days ago. But all of the charts still look incredibly bullish to me. Next Thursday will be a massive day for tech.
For the bulls’ sake I hope you are right. I have a sneaking suspicion that volatility is going to chase this market higher in the near term though, and you won’t be seeing the 9 pivot anytime soon…but I could be wrong about that! 🙂
I have been doing a bit of digging on what the quant dudes are thinking and it does seem as if the VIX 15.00 pivot is the real event horizon.
I do think we are in yet another triangle with a break to the upside on deck.
Transports got smacked pretty hard today so we may now be out of sync with that index.
That’s certainly a possibility too. I will show a few charts of what I’m talking about tonight. I don’t think a break above 13 could herald more ATHs in the near-term though. I think next week we are going to see a break one way or the other. A close above 13 would spook quite a few people rather quickly. Unless a 5% dip is absolutely imminent, I think one more trip to the high 9s is more likely, followed by a more significant correction in early March. That’s what Lara’s weekly and daily wave counts support at least.
You could be right though, in which case we’d see some really nutty action with SPX going up in the face of a huge drive upwards in volatility.
a-b-c compete? d underway now? Just wonderin’ …
Oops. I didn’t see Kevin’s chart below. Yea, that’s how it’s looking to me too.
They are coming after the VIX 12.00 pivot with hammer and tongs!
Could that level be more important than we thought?
Halfway to 1.00 bid on UVXY 10.00 strike calls. Will we make it by the close?? 🙂
Wait…don’t tell me…did a bunch of you guys just jump on that puppy? lol!
Reminds me of my “beat up the market makers” posse days!!
While this upwards chop does look rather corrective on the five minute chart and that favours the idea of micro wave 4 continuing further… that could certainly morph into another impulse on upwards. Sometimes they can start out a bit slow.
If micro 4 does continue it looks like it may still respect support at the best fit channel. That could see a small EW contracting triangle complete, then micro 5 break out upwards.
I must say folk who cannot see dueling personalities in price action sure are missing lot of entertainment. Take TMV for example. I find it absolutely hilarious to see all that thrashing around going on aroud the 200 day MA. It is a scream!
They are huffing and puffing to try and smash it back below the horrible 200 day MA and spending Oh so much energy in the attempt. I am going to literally roll on the floor laughing when it gaps past that pivot in the next day or two. 🙂
Top of VIX gap candle is at 11.29 so VIX needs to stay above to maintain gap…
Nice move on UVXY 10.00 strike calls people…money lying in a corner!! 🙂
Opening STC order on UVXY calls at 1.00 even GTC. I don’t expect it to get filled until tomorrow but just in case, I am taking the booty and getting out of Dodge! 🙂
That unfolding triangle (??)…
Strong alternation with the corresponding 2, which was a zig-zag I believe.
Yep. Sure does look like a nice EW triangle.
And like the classic pattern equivalent, a pennant, they’re reliable continuation patterns.
Yep! 🙂
If we have a corrective wave up in futures as appears to be the case, tomorrow’s action could provide some quick coin. UVXY 10.00 strike calls expiring tmorrow look to be tasty speculative morsels at 0.29 apiece. Buying tiny lot 25 contracts. Go Unicorn! 🙂
Whipped out of VXX this AM, but I suspect you’re exactly right, Verne.
I think it is noteworty that the VIX short sellers tried mightily to close the gap from this morning and were met with a very firm: “Oh no, you don’t!” 🙂
Looky there! Are we going to get a green candle in UUP today??!
Sweet!! 🙂 🙂 🙂
Look at that dollar go! Momma mia, thatsa bigga spicy DXY candle!!
We are gonna get a gap….!
Last TWS VIX pattern met resistance just under 200 day MA. Current pattern finding support just above…
I see a 5 down and 3 up in SPX, in which case, a 5 wave C down is coming, which will spike the VIX hard. I could be wrong, it’s a heck of a bull market. But right now this looks A-B-pending C ish to me, though it’s hanging in the balance. And it’s been awhile since we’ve seen a big triangle 4; this could certainly unfold that way, with A and B legs established. If it goes down and breaks yesterday’s low, the 50% at 2823 or 62% at 2816 are key decision pts.
So you see a big expanded flat for a fourth wave then matey?! 🙂
Maybe this as an evolving micro 4.
Not sure of the structre, but I agree that we may have a bigger 4 unfolding.
TBT 200 day holding. TMV should also recapture its own. Buying March 20 strike TMV calls for 0.50 in mid-term account. Target is TMV 21.50…
Price vol on both near and mid term horizon now starkly diverging with price…!
What am I missing? 🙂
Another big macro-economic event is an unfolding double bottom in the dollar. Looking for bullish MACD turn and a break-away gap in UUP…
There’s no double bottom in UUP on the weekly at this point, it’s just down hard, breaking through prior lows. I’ll be waiting for a clear bottom and indications of a renewed uptrend.
MACD bullish divergence on the daily. I am waiting for a break-away gap before I pile in… 🙂
DXY double bottom to day at 88.27 and 88.29….
Interesting assault on interest rates as TMV gets slammed. What happens next is well worth paying attention to….we could be about to see a real life example of who is really in charge…
VIX 200 day MA now providing strong support, B bands expanding…wow!
Pumping DJI for all they are worth, and still struggling to notch a new high even on non existent volume…a complete absence of sellers in the cash session…
Moment of decision for TMV. It has moved slightly below 200 day MA after a move above yesterday. It needs to find support there to trigger a buy signal, aad will if we get a green close today…
Starting to look like a stealthy exit in vol futures. I wonder when we will see an impact on the risk parity trade? I would REALLY like to see VIX gap past 13 as that would signal a forcible unwind….
To get the VIX up to 13 would I suspect take SPX driving down to and below yesterday’s low. I don’t think that’s going to happen today. Though a combo 4 can’t be discounted and if that were to unfold, the 62% retrace of the entire Jan 16 – 24 move is a likely bottom at 2816. In that case, yes I’d see VIX at or above 13. But right now the current 4 bottom looks pretty solid to me (famous last words). And the wave count is due a 5 back up at least to yesterday’s high.
I agree it is a long shot to happen intra-day, which is why it would be quite significant. I do expect at some point we are going to see a gap higher in VIX based on what SVXY is doing. I am very surprised it has not already happened. Long vol accumulation continues apace…
Kevin,
You mentioned RUT below. Here is my current chart on IWM daily. It looks like a rising wedge to me with MACD divergence / non-confirmation. If this is correct, it is very bearish. Rising wedges typically retrace 75% of the wedge. That would give a target about 141. If that is all true and it is a big if, the SPX would also be susceptible to a larger correction than we have seen for a while. Comments welcome of course.
Gotta go! I’ll be back later today.
I agree Rod. Multiple divergences in that puppy and I am expecting a 10% haircut… 🙂
We will probably get another Three White Soldiers candlestick VIX pattern today…
This action since the low yesterday is starting to feel strongly like “more 4” rather than the start of a new impulse up. Overlapped mess and churning. A day for patience.
Starting to see a few VIX gaps higher on 5 min chart. Amazingly enough, they are being aggressively sold! Huh???!!! 🙂
A cash session failure to confirm new futures high is quite rare!
A volatility storm is brewing. Nobody expects it. How do I know that?
No VIX gap….at least not yet….!
It’s really unbelievable, the level of central bank manipulation. Is everyone aware that they have special accounts with the CME group, established in 2014, for the sole purpose of managing equity prices? It is called the “CBIP” and is coordinated with bank market makers to pump pricing. The last 18 months of action should serve as a warning to all; they have nationalized and weaponized the markets, inducing obscene risk taking, penalizing savers and now making themselves the very banks that are too big to fail. Lara is absolutely right to reinforce risk management with tight stops. As evidenced by the last 90 days of action, countless gap fills, engulfing reversal, the fight is presently on. Thousands of prudent hedge funds have closed, the public is drunk on thinking they are smart and safe, and the party could end at any moment. There is so much to this picture I cannot share, but trade safe and be very diversified because when this starts its gonna be generational.
I read a zero hedge article yesterday in which Dalio was making fun of how traders in cash are regretting it, and that he sees no triggers on the horizon for a substantial market decline. Schiller, a more thoughtful (and humble) man, pointed out that the market does not necessarily need a trigger. He said that in the Summer of 2006 folk were lining up to buy Florida condos, and a month later the lines had completely disappeared.
Sentiment can change quite suddenly.
Notice the action of VIX right out of the gate this morning (straight up on a gap open in SPX) once again gave a screaming heads up of an immanent SPX sell off.
Anyone ever enter an extra “0” in a # of shares field, only to be surprised when 30 seconds after purchase, there’s a (relatively) massive loss showing in the “net profit position”, and then, oh my, I bought 500 not 50???? OUUUCCCHH. Well, happened to me this morning. FOCUS, SKYWALKER!!!! Lol!!!! At least I lost money to fumble fingers and not fumble brain; small favors! Now to making it back…..
Think we have all been there!!
Been there done that, thankfully not anytime lately. I feel your pain!
Fortunately only about a day’s worth of average profit so no biggee. But clearly MORE CARE and a sliiiiightly slow pace and review of correctness before every click is warranted.
Exciting action this morning. I’m fascinated to see if what I though was the bottom of a 4 in RUT yesterday is going to hold here or break. We could be getting combo 4 instead of the simple zig-zag I thought completed it. Or, the test might hold…
No, RUT is in a larger ABC down for a 4. The theoretical limit though is the top of the 1 around 1589. So I’m looking for a pause and turn just above that, setting up a very high leverage long opportunity with a very close invalidation stop.
Yes, that sort of thing has happened to me.
Another funny one: One time I had on a long trade with a large portion of my portfolio. I entered a nearby stop loss order. A few days later, the stop loss was hit and the equity turned right around and marched upwards strongly. I was really depressed. When I went to my account to check what my loss was I was surprised the stop loss order somehow was never entered properly. Thus I was in a strong profit position.
So these things have happened to me as well. Now, I try to thoroughly check every order before pressing ‘Enter’ and check to make sure the order is in place as well. But if a person executes a lot of trades, mistakes become more likely.
Thanks for sharing Kevin. I hope your lesson was not too costly. Have a good one.
By the way, we picked up an Instant Pot 7-1 for Christmas. Like you and Verne, we are learning to enjoy it.
I did something almost as silly. I once forgot to close some in the money calls and woke up to an extra half a mil in my trading account! Yikes!!!
this upwards move looks a bit corrective to me
Good eye, Nick! We’ll know soon enough, but at the moment it sure does look like another swing down may be brewing.
Lara,
Do you think you will have time to update NASDAQ analysis over the coming week(s)? If not that is fine as well. Just wanted to see how NASDAQ compares to S&P. I am getting the feeling that NASDAQ might peak for correction much before S&P but your excellent analysis will confirm /validate that for me.
Sure. I won’t be able to this weekend as it’s trapping day with Marunui so I’ll be hiking in the bush all day Saturday to protect Kiwi.
So I’ll be working Sunday. And that’ll take all day.
If there’s no surf next week then I may be able to get it done on a week day.
!!! shhhssshh….
I heard that Doc!!!!
🙂