Sideways movement sees three wave counts still valid. The AD line and VIX are giving signals, and On Balance Volume may provide a signal tomorrow.
Summary: Assume the upwards trend may remain intact and the next target for an interruption is at 2,840.
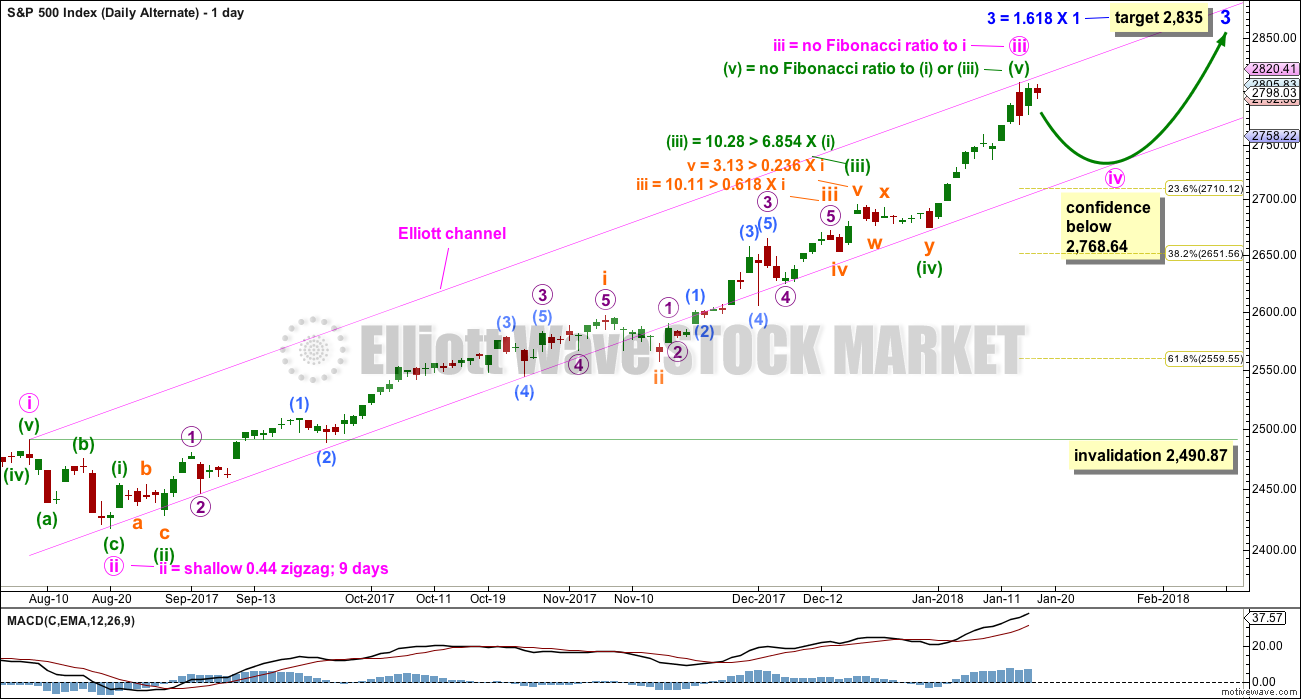
Two alternates today look at a correction or pullback beginning here to last one to two weeks. Some confidence may be had in this view if price makes a new low below 2,768.64. This view has support now from bearish signals in VIX and the AD line.
The biggest picture, Grand Super Cycle analysis, is here.
Last historic analysis with monthly charts is here. Video is here.
MAIN ELLIOTT WAVE COUNT
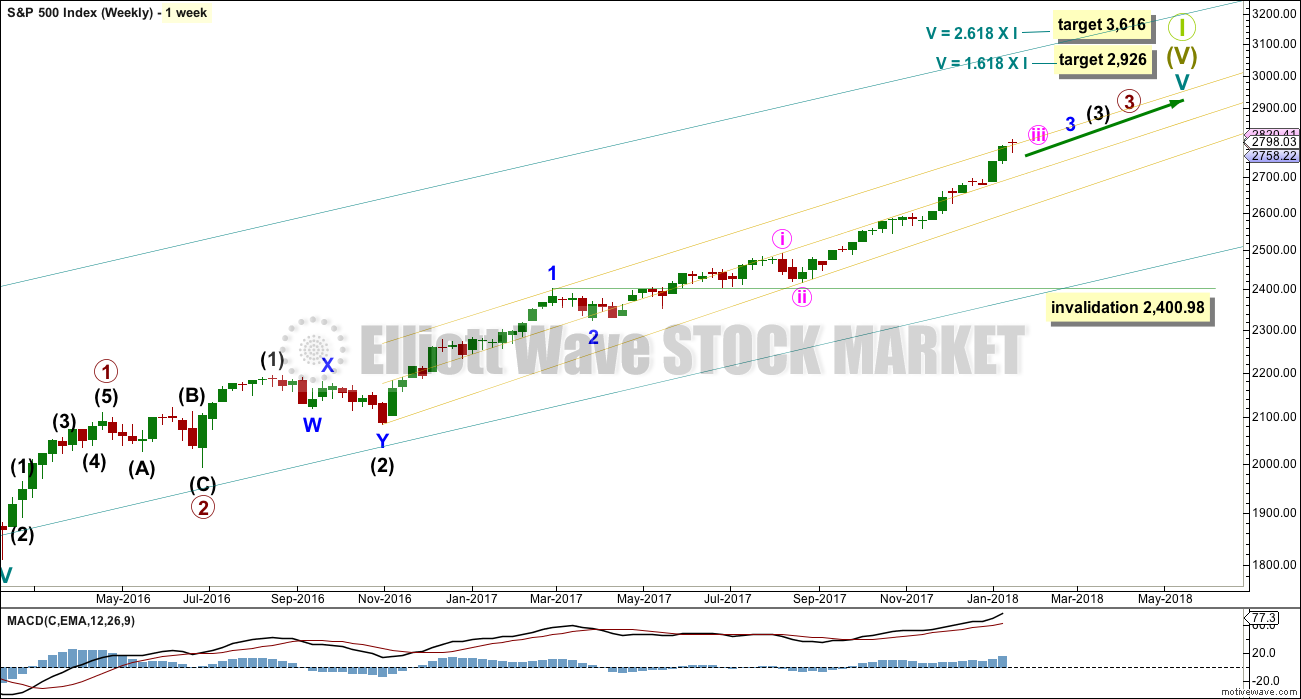
WEEKLY CHART
Cycle wave V must complete as a five structure, which should look clear at the weekly chart level. It may only be an impulse or ending diagonal. At this stage, it is clear it is an impulse.
Within cycle wave V, the third waves at all degrees may only subdivide as impulses.
Within cycle wave V, the corrections for primary wave 2 and intermediate wave (2) both show up clearly, both lasting several weeks. The respective corrections for intermediate wave (4) and primary wave 4 should also last several weeks, so that they show up at weekly and monthly time frames. The right proportions between second and fourth wave corrections give a wave count the right look. This wave count expects to see two large multi week corrections coming up.
Cycle wave V has passed equality in length with cycle wave I, which would be the most common Fibonacci ratio for it to have exhibited. The next most common Fibonacci ratio would be 1.618 the length of cycle wave I.
Intermediate wave (3) has passed equality in length with intermediate wave (1). It has also now passed both 1.618 and 2.618 the length of intermediate wave (1), so it may not exhibit a Fibonacci ratio to intermediate wave (1). The target calculation for intermediate wave (3) to end may have to be done at minor degree; when minor waves 3 and 4 are complete, then a target may be calculated for intermediate wave (3) to end. That cannot be done yet.
When minor wave 3 is complete, then the following multi week correction for minor wave 4 may not move into minor wave 1 price territory below 2,400.98. Minor wave 4 should last about four weeks to be in proportion to minor wave 2. It may last about a Fibonacci three, five or even eight weeks if it is a time consuming sideways correction like a triangle or combination. It may now find support about the mid line of the yellow best fit channel. If it does find support there, it may be very shallow. Next support would be about the lower edge of the channel.
A third wave up at four degrees may be completing. This should be expected to show some internal strength and extreme indicators, which is exactly what is happening.
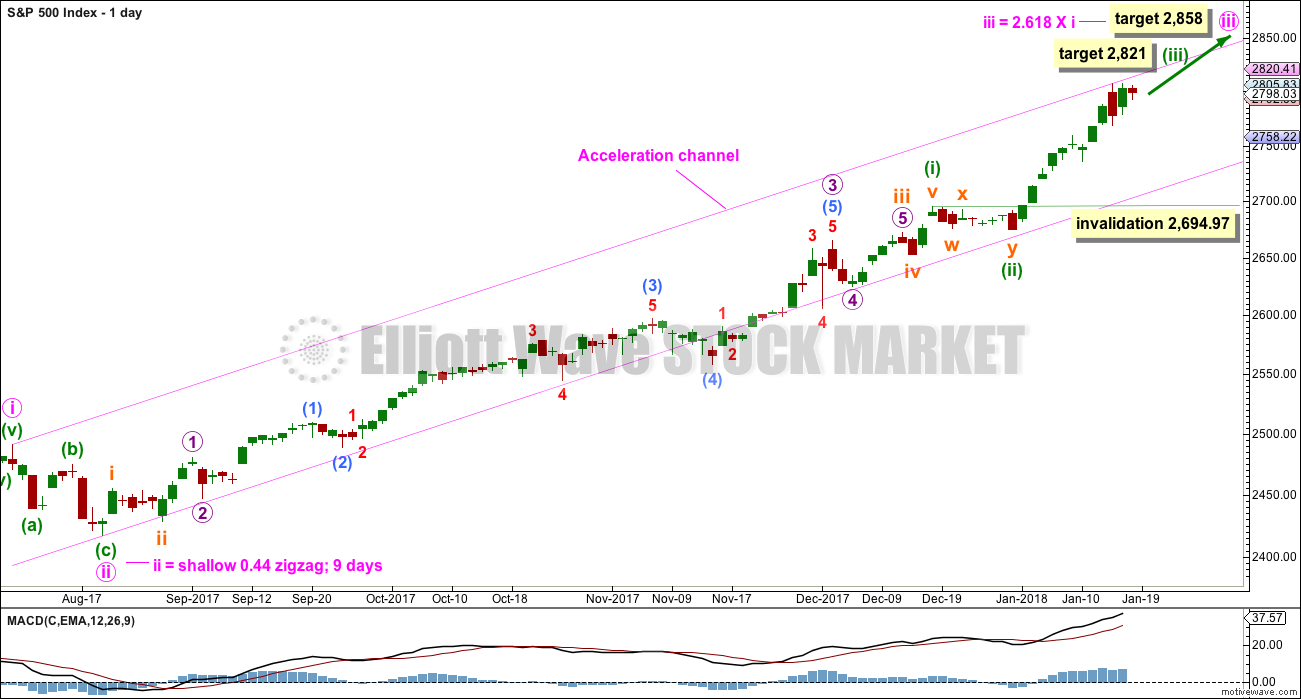
DAILY CHART
Keep redrawing the acceleration channel as price continues higher: draw the first line from the end of minute wave i to the last high, then place a parallel copy on the end of minute wave ii. When minute wave iii is complete, this would be an Elliott channel and the lower edge may provide support for minute wave iv.
Minute wave iii has passed 1.618 the length of minute wave i. The next Fibonacci ratio in the sequence is used to calculate a target for it to end.
Minute wave iii may only subdivide as an impulse, and within it minuette wave (i) only may have recently ended as a long extension. This main wave count fits with MACD: upwards momentum is showing an increase as a third wave continues upwards.
Within the impulse of minute wave iii, the upcoming correction for minuette wave (iv) may not move back into minuette wave (i) price territory below 2,694.97.
Because minuette wave (i) with this wave count is a long extension, it is reasonable to expect minuette wave (iii) may only reach equality in length with minuette wave (i). This target fits with the higher target for minute wave iii one degree higher.
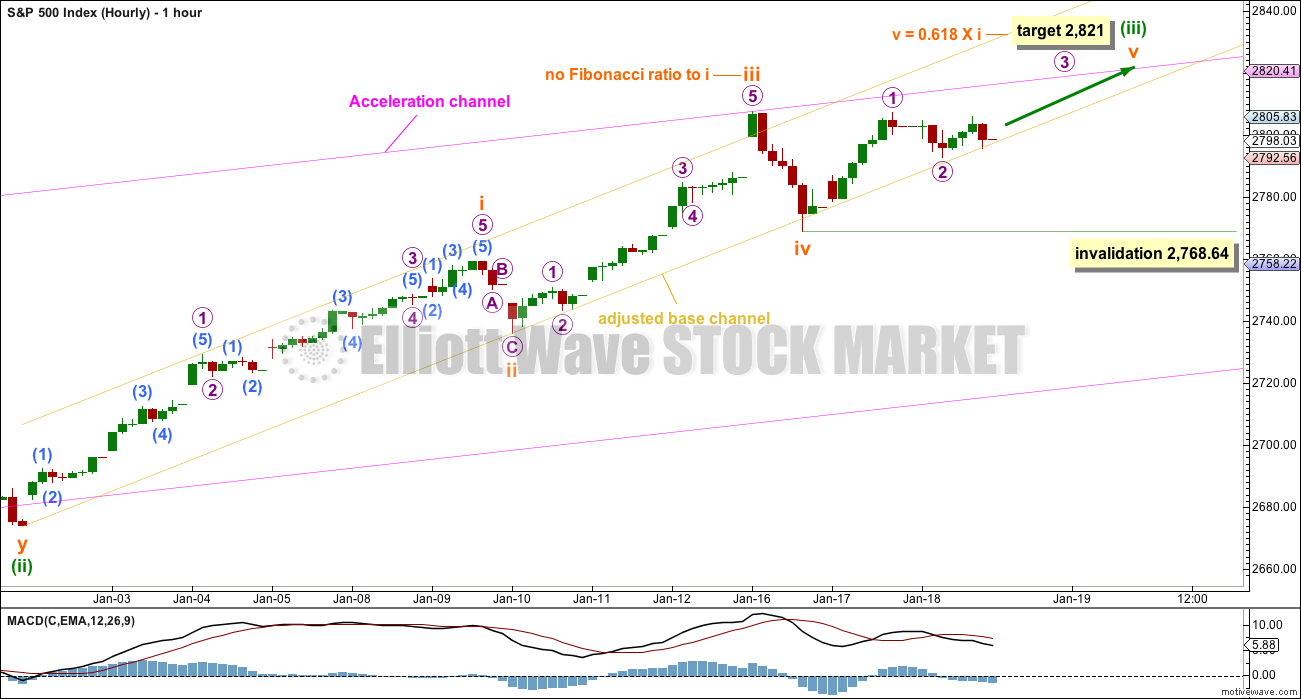
HOURLY CHART
Always assume that the trend remains the same until proven otherwise. At this stage, there is no technical evidence for a trend change; we should assume the trend remains upwards.
The last small wave count is relabelled today. Downwards movement for today’s session looks now to be too large to be a fourth wave as previously labelled, so it may be another second wave correction. Micro wave 2 may not move beyond the start of micro wave 1 below 2,768.64.
Subminuette wave iii is shorter than subminuette wave i. This limits subminuette wave v to no longer than equality in length with subminuette wave iii at 2,840.12, so that subminuette wave iii is not the shortest and the core Elliott wave rule is met.
Minuette wave (ii) was a very shallow combination lasting eight days. Minuette wave (iv) may also last about a Fibonacci eight days.
Price has again found support about the lower edge of the base channel. Assume the upwards trend remains while price remains within this channel.
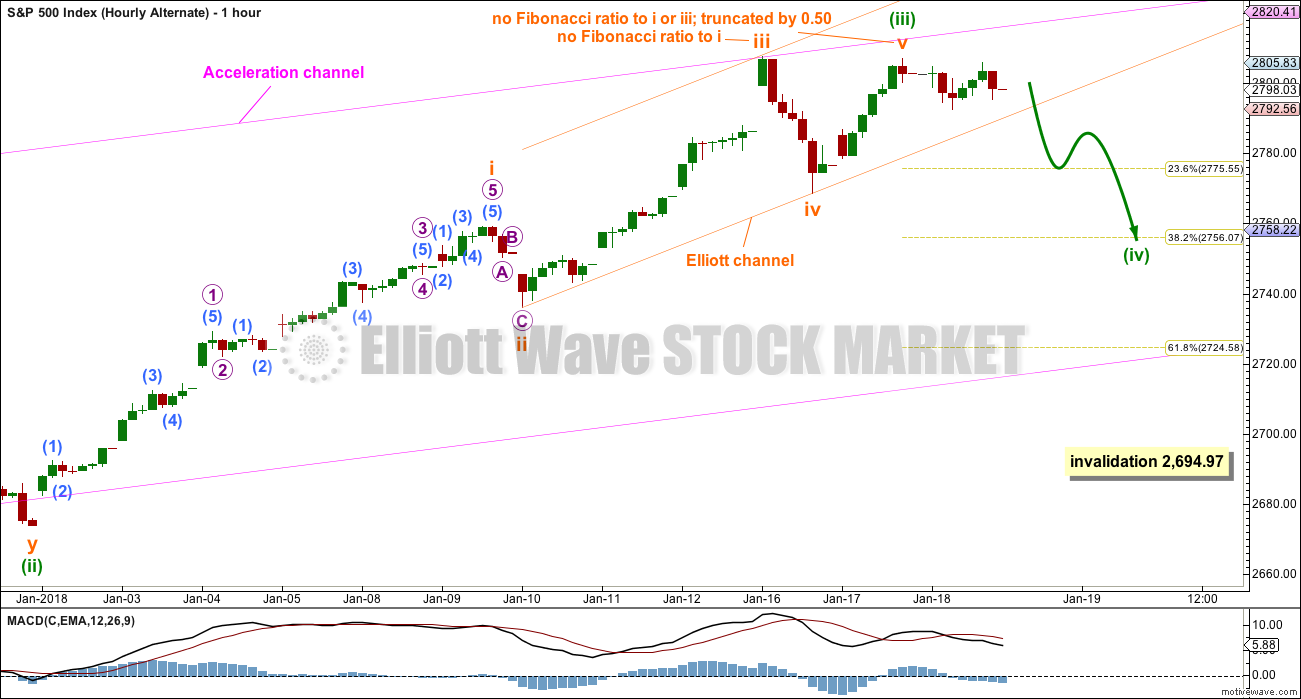
ALTERNATE HOURLY CHART
This hourly wave count is new today.
It is possible today that minuette wave (iii) is over with a slightly truncated fifth wave.
Minuette wave (ii) was a combination lasting a Fibonacci eight days. Given the guideline of alternation, minuette wave (iv) may most likely be a single or multiple zigzag and may last a Fibonacci five days; zigzags are often quicker than combinations.
Minuette wave (iv) may also be a flat or triangle and still exhibit some structural alternation with minuette wave (ii).
ALTERNATE DAILY CHART
It is possible that minute wave iii is over. Some confidence in this wave count may be had if the main hourly wave count above is invalidated with a new low below 2,768.64. If that happens, then both this alternate daily wave count and the alternate hourly wave count would remain valid.
If minute wave iv is underway, then it may be expected to be reasonably in proportion to its counterpart minute wave ii correction. Minute wave ii lasted nine days, so expect minute wave iv to last a Fibonacci eight or thirteen days.
Minute wave ii was a zigzag, so minute wave iv may exhibit alternation as a flat, combination or triangle. These corrections are all sideways and usually more time consuming than zigzags.
Minute wave iv may end when it finds support about the lower edge of the pink Elliott channel. If it does not end there and if it overshoots the channel, then minute wave iv may end within the price territory of the fourth wave of one lesser degree. Minuette wave (iv) has its territory from 2,694.97 to 2,673.61.
Minute wave iv may not move into minute wave i price territory below 2,490.87.
TECHNICAL ANALYSIS
WEEKLY CHART
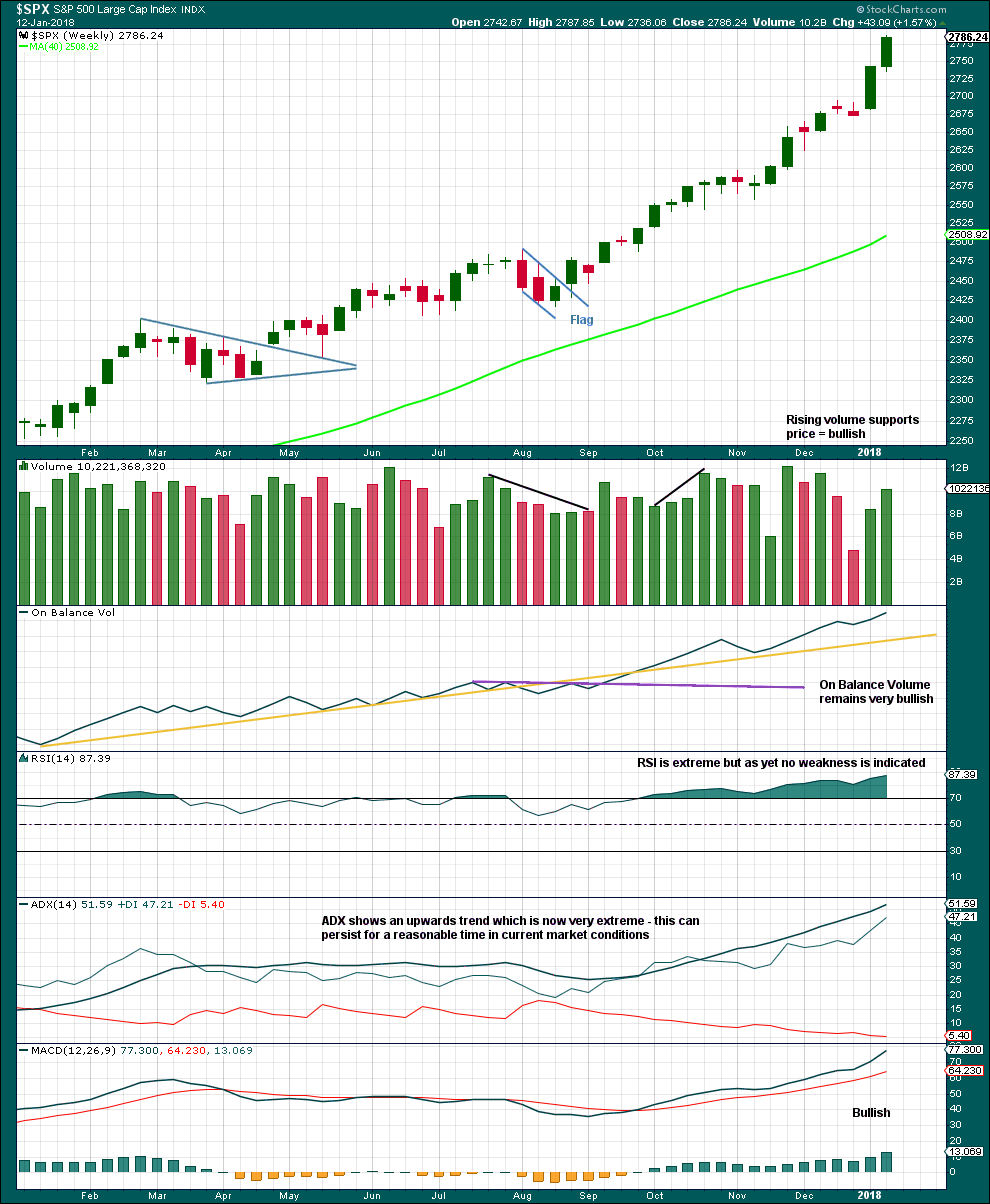
Click chart to enlarge. Chart courtesy of StockCharts.com.
Indicators should be expected to be extreme as a third wave at four degrees comes to an end.
When third waves are ending they fairly often will show weakness at the weekly chart level. There is still no evidence of weakness at this time. When intermediate wave (3) is close to or at its end, then we may expect to see some weakness.
DAILY CHART
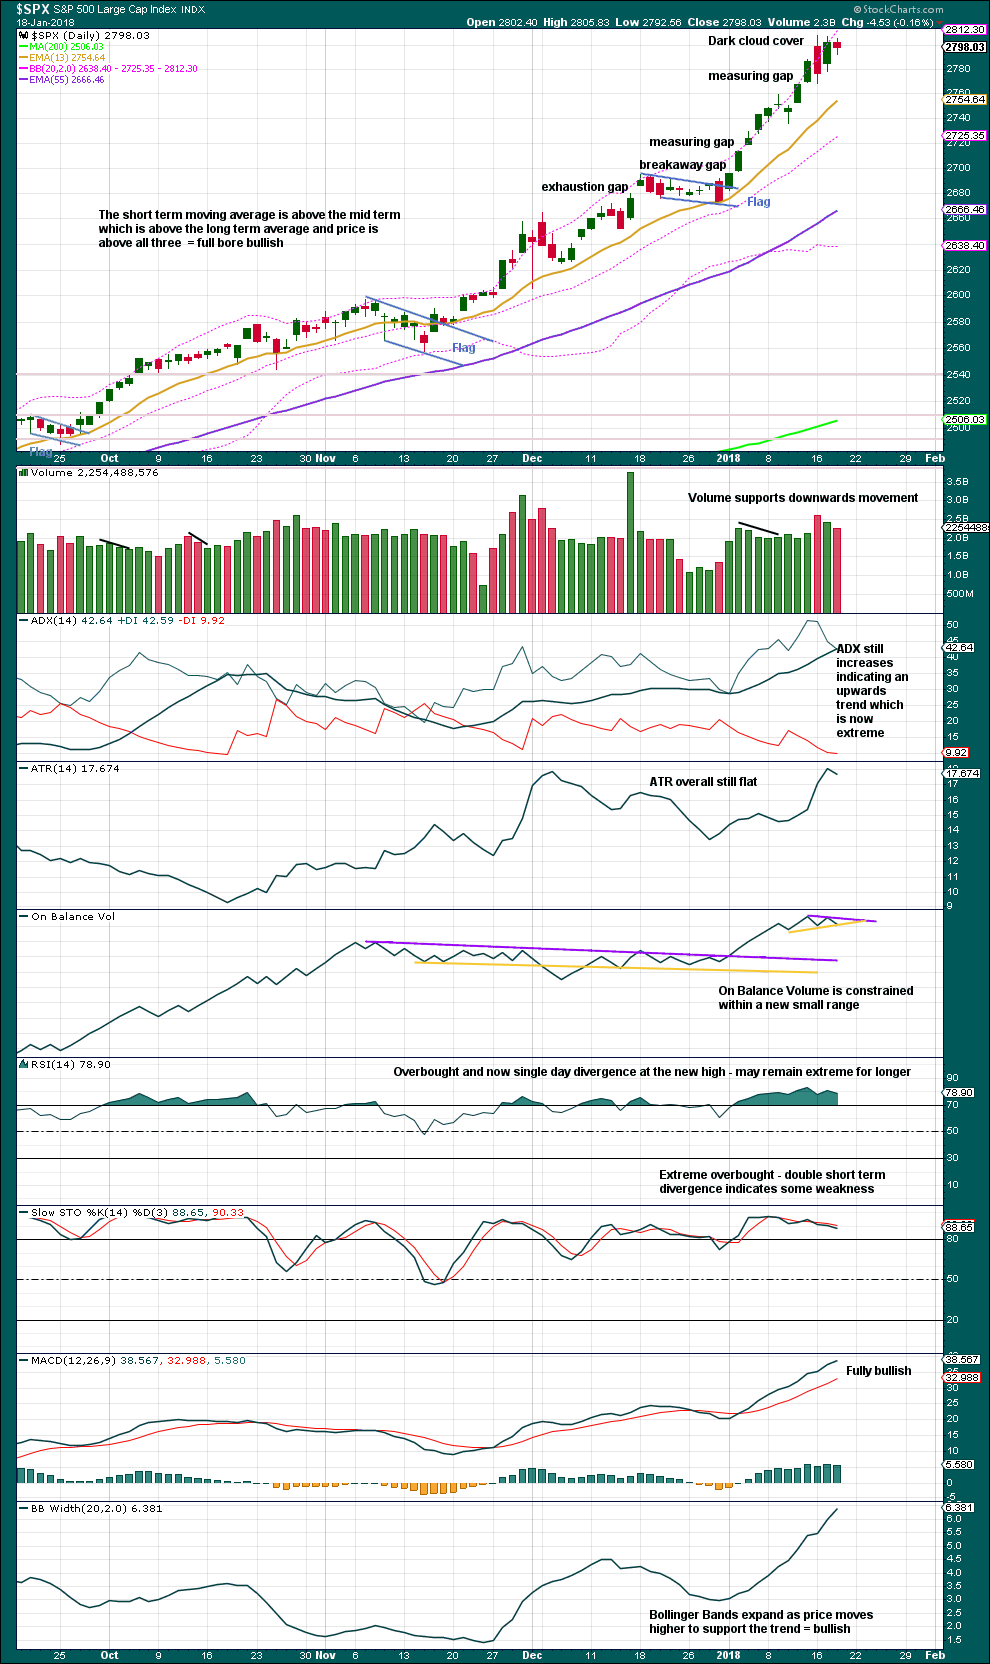
Click chart to enlarge. Chart courtesy of StockCharts.com.
It is still a downwards day within most recent movement that has strongest volume. However, today printed a red candlestick with the balance of volume down, but downwards movement during today’s session did not have support from volume.
This chart is still very bullish. The trend can still continue while the trend is extreme and stretched.
On Balance Volume looks likely to break out of its new small range tomorrow. That would provide a signal.
VOLATILITY – INVERTED VIX CHART
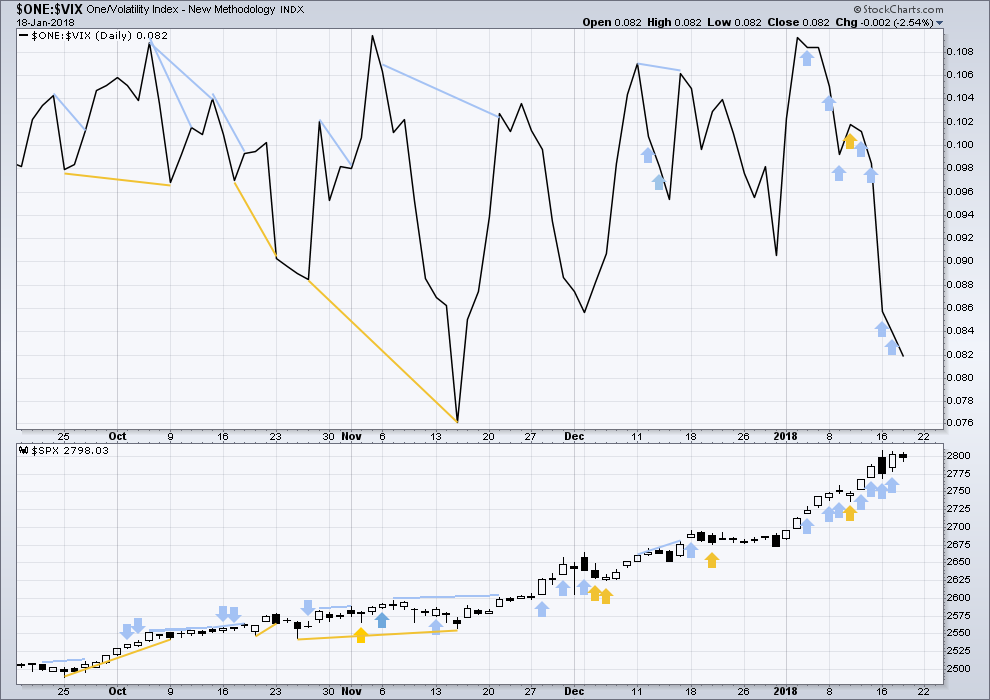
Click chart to enlarge. Chart courtesy of StockCharts.com.
So that colour blind members are included, bearish signals will be noted with blue and bullish signals with yellow.
Normally, volatility should decline as price moves higher and increase as price moves lower. This means that normally inverted VIX should move in the same direction as price.
There are still four bearish signals in a row from VIX. Price moved sideways today, but the balance of volume was upwards and the candlestick was green. There has not been a normal corresponding decline in market volatility despite upwards movement during the session. Volatility has shown a further increase for the fourth day in a row. This is now very bearish.
This has now been followed by an inside day which closes red. It may be followed by yet more downwards movement before it is resolved.
BREADTH – AD LINE
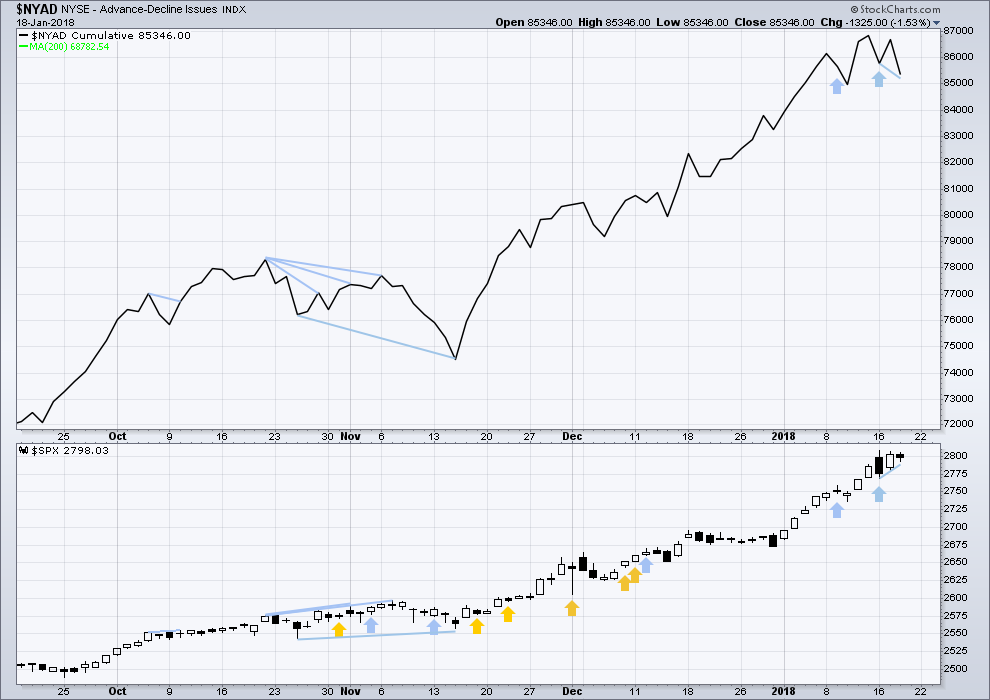
Click chart to enlarge. Chart courtesy of StockCharts.com.
There is normally 4-6 months divergence between price and market breadth prior to a full fledged bear market. This has been so for all major bear markets within the last 90 odd years. With no longer term divergence yet at this point, any decline in price should be expected to be a pullback within an ongoing bull market and not necessarily the start of a bear market.
All of small, mid and large caps last week made new all time highs. This market has good support from rising breadth.
Breadth should be read as a leading indicator.
There is short term divergence today between price and the AD line: the AD line has made a new small swing low, but price has not. This divergence is bearish, if breadth is used as a leading indicator. Price may follow more downwards movement.
DOW THEORY
The S&P500, DJIA, DJT and Nasdaq last week all made new all time highs. The ongoing bull market is confirmed.
The following lows need to be exceeded for Dow Theory to confirm the end of the bull market and a change to a bear market:
DJIA: 17,883.56.
DJT: 7,029.41.
S&P500: 2,083.79.
Nasdaq: 5,034.41.
Charts showing each prior major swing low used for Dow Theory are here.
Published @ 07:04 p.m. EST.

One point of view is that this holding of the market up against the ATH, in face of dysfunction and government shutdown (which does have negative business impacts I believe), is quite bullish, which is consistent with the primary wave count and total weight of the technical evidence. (I think we latch onto the onesy-twosy contra indicators too much, and overly dismiss the 80-90% of the evidence.) Oh enough for a friday afternoon. HAPPY WEEKEND EVERYONE!!! And thank you Lara for your fine analysis all week long, starting with that exceptional monthly refresh. Let’s go make some money again next week!!!…
You’re most welcome Kevin 🙂 It’s been a good week with S&P analysis.
I agree that we can seem to latch onto contra indicators a bit too much. I also think we may be paying too much attention to little movements, and missing the larger trend.
Volatility to ignore as Chris Ciovacco puts it.
Updated hourly chart:
I’m moving the invalidation point up and slightly adjusting the yellow channel, now called a best fit channel.
while price remains within this channel expect the upwards trend remains intact. if price breaks out below the channel we may have a multi day to multi week correction arriving
but for now, price is within the channel and the structure is incomplete.
at the hourly chart level there is now some divergence with price and MACD to indicate some weakness beginning
although I’ll note it, I’ll also note that divergence at this low time frame is unreliable. it could simply disappear in a day or so.
Rats! If I were more disciplined I could have bought back those puts for 0.02!
Or better yet, If I were REALLY smart, just let ’em expire worthless!
Actually nine times out of ten you are smart to reduce exposure. I have seen some REALLY STRANGE things happen at expiration! 🙂
Have a great week-end everybody!
Hey Vern, I have an option question for you.
If this amount of OPEN Int. calls and puts were expiring today on a 1 Billion Dollar market cap stock. Where would “THEY” Close this Stock Price today? After today’s date all other time periods have only a very small fraction of what is open here at Today at $7. Stock now at 6.88 but was over $7.10 early yesterday.
…………… Bid…….. Ask… Last…. Change Vol…. Op Int
7.0 Call… 0.00…. 0.05… 0.03… -0.03… 562… 9,417
7.0 Put… 0.10…. 0.15… 0.13…. -0.01…. 311… 4,037
I know I should have looks at this a couple of days ago.
Market makers usually “shake the trees” in both directions to dislodge as many traders as possible around the strike price. One can expect swings around the strike going right into the close. The open interest is important ONLY if you are looking at in-the-money contracts. (at expiration)
If I were to guess, I would wager an amazing “co-incidental” close right at 7.00 even. When that happens NOBODY gets paid. Cute isn’t it?
That is what I was guessing… just wanted to see what you thought.
So is the Stock now free to go well beyond $7 now that the open interest CAP is removed starting Monday? At most other time expiration periods have no more than 500 to 1000 open.
Yep! It sure is…. 🙂
It’s AG and I think I am going to double up my position right here.
They closed it at 6.88… I decided to wait until Monday to buy more.
0.12 off from $7… so the sellers of those puts lose their shares but get $7 per and keep premium previously received.
If they sold 7.00 strike puts, they will have to buy (assignment) 100 shares for a share price of 7.00 for each contract they sold.
Selling out of the money puts is actually an excellent way to buy a stock you want to own for less than the current price.
You can sell one call for each 100 shares of a stock you actually own(covered call). If price is above call price(strike price) at expiration, then you loose your shares but keep the premium for the call sold. If not, you still keep the premium and get to do it over again! 🙂
Probably being overly cautious but buying to close SPY 279 strike puts expiring today for 0.04 reducing risk of any SPY move below 279 prior to the close.
OpEX will probably make for a boring rest of the session. I imagine the move out of this sideways triangular pattern will not come until next week. Sold remaining calls for 0.42 earlier and I am glad I did. Holding spread. Oh well….
Anyone want to bet that they are going to send those puts back in the money with a spike below SPY 279???!!! 🙂
Still a bid ask of 0.10/0.11
Looks like the new “cheap” level for VIX is 11.50 🙂
I think one more high before the turn…look for VIX to chase it higher…
The 2807.5 ATH has been knocked on once, twice, almost three times, almost 4 times…and held throughout. Price is “squeezing” up against it. I would guess the highest probability given all that’s preceeded that price is going to blow through, and then I’ll be looking first at 2817.5 as a key decision price (the 127% extension of the last major upmove), and then 2831 (the 162% extension). On the other hand, if price gets below the 38% retrace fibo (exactly the low from yesterday), I’m confident SPX is entering into what is likely a multi-week corrective phase. Today should be fairly indicative before it’s over.
I suspect the backdrop of a US gov’t shutdown and continuing inability to govern in DC is a huge drag on this market, and perhaps an external indicator of a likely multi-week correction here, coupled with this stalling action in SPY. I would NOT be surprised by a large sell off at some point today, and I have a short all ready to execute at a single button push, should I see price suddenly entering free fall. Gotta be nimble and ready. Also, I see XIV still in the 140 price area (145 is the recent ATH) while VIX is up at almost 12. When/as the VIX drops back below 10, XIV is going to go to what, 160? I’d guess so. But if there’s a longer correction, that’s not happening real soon.
Whew. When the market topped and just began indicating a turn, I jumped on a moderate side scalping short (SPXU), which I’ve already cashed for quick lunch money. Trading the chop!! Now, can I find a reasonably clear bottom in XIV to do the same today on the long side, hmmm….
Hey man, that was my lunch money!!!
Ooops!!! Lol!!! We have to coordinate I guess…
The RUT is powering, and I’m quite unhappy I didn’t jump on it at its first 5 minute up bar. I looked and considered but didn’t pull the trigger, arrgh. RUT can run straight up like a dog after a cat sometimes. But I still see real hesistance in SPX as well as INDU and NDX. I’m cautious here unless/until SPX breaks through to the upside.
Final got Planning Permission for rebuilding my Garden Centre 12 months after a devastating fire!! Will break ground in 5 weeks and should be fully open for September. If anyone is ever near Heathrow, they are always welcome for a coffee and a bit of cake once we are fully open 🙂
Good for you Paresh. I remember well when you shared with us about the fire. It was a devastating time for you. Now after rising from the ashes, you are about to enter into a whole new era of hope and prosperity. May it all go well for you. Blessings.
Congrats and best of success in the renewed venture!
That is wonderful Paresh! Here is hoping they complete ahead of schedule and under budget!
Good on you Paresh 🙂
If I ever get to London I will most certainly drop in for a visit.
Speedy!! Happy Trading all 🙂
You’re numero uno in my book Paresh.
Thank you Rodney!!