An inside day fits the main hourly Elliott wave count best. The target is slightly adjusted.
Summary: Assume the upwards trend may remain intact and the next target for an interruption is at 2,840.
A daily alternate looks at a possible one to two week correction beginning here. This alternate may have confidence if price makes a new low below 2,759.14.
The biggest picture, Grand Super Cycle analysis, is here.
Last historic analysis with monthly charts is here. Video is here.
MAIN ELLIOTT WAVE COUNT
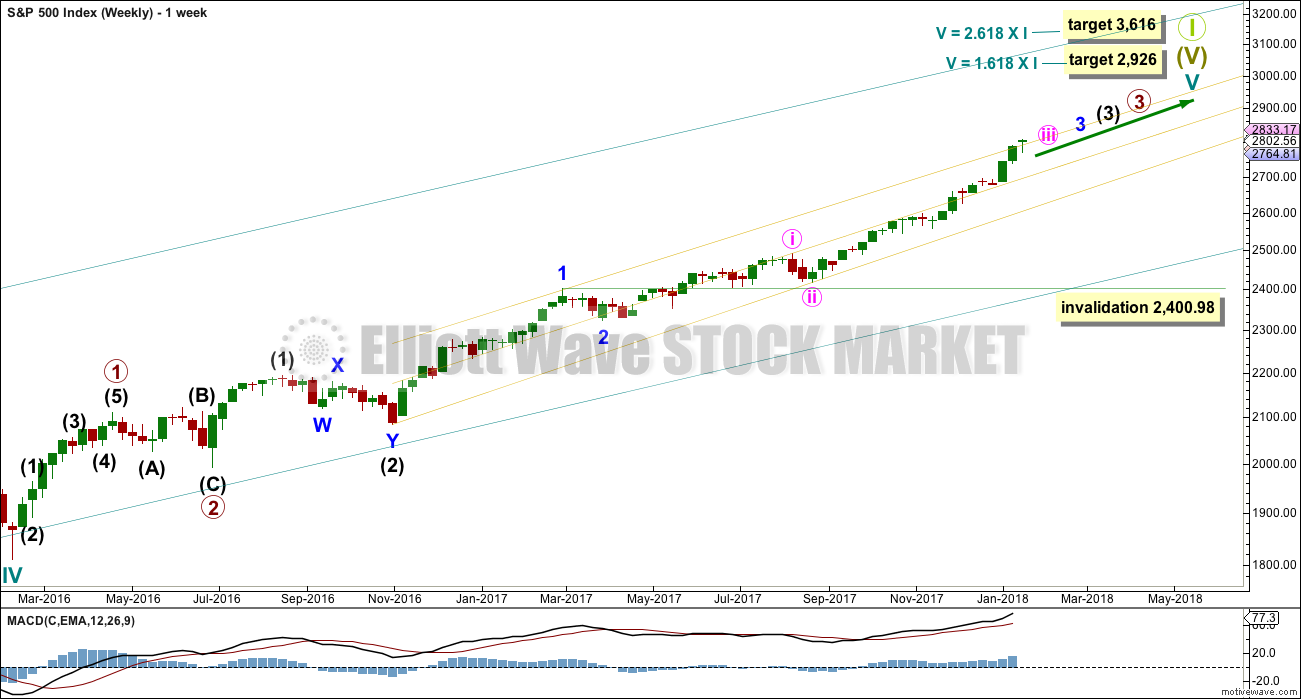
WEEKLY CHART
Cycle wave V must complete as a five structure, which should look clear at the weekly chart level. It may only be an impulse or ending diagonal. At this stage, it is clear it is an impulse.
Within cycle wave V, the third waves at all degrees may only subdivide as impulses.
Within cycle wave V, the corrections for primary wave 2 and intermediate wave (2) both show up clearly, both lasting several weeks. The respective corrections for intermediate wave (4) and primary wave 4 should also last several weeks, so that they show up at weekly and monthly time frames. The right proportions between second and fourth wave corrections give a wave count the right look. This wave count expects to see two large multi week corrections coming up.
Cycle wave V has passed equality in length with cycle wave I, which would be the most common Fibonacci ratio for it to have exhibited. The next most common Fibonacci ratio would be 1.618 the length of cycle wave I.
Intermediate wave (3) has passed equality in length with intermediate wave (1). It has also now passed both 1.618 and 2.618 the length of intermediate wave (1), so it may not exhibit a Fibonacci ratio to intermediate wave (1). The target calculation for intermediate wave (3) to end may have to be done at minor degree; when minor waves 3 and 4 are complete, then a target may be calculated for intermediate wave (3) to end. That cannot be done yet.
When minor wave 3 is complete, then the following multi week correction for minor wave 4 may not move into minor wave 1 price territory below 2,400.98. Minor wave 4 should last about four weeks to be in proportion to minor wave 2. It may last about a Fibonacci three, five or even eight weeks if it is a time consuming sideways correction like a triangle or combination. It may now find support about the mid line of the yellow best fit channel. If it does find support there, it may be very shallow. Next support would be about the lower edge of the channel.
A third wave up at four degrees may be completing. This should be expected to show some internal strength and extreme indicators, which is exactly what is happening.
DAILY CHART
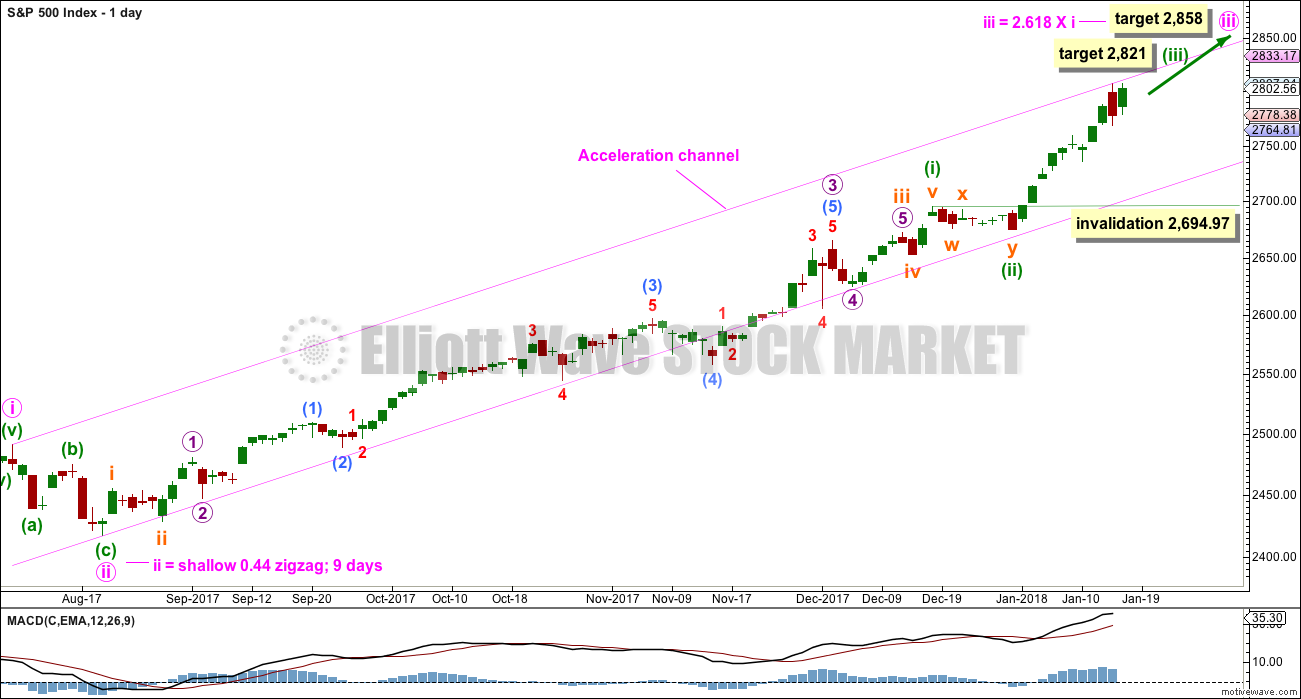
Keep redrawing the acceleration channel as price continues higher: draw the first line from the end of minute wave i to the last high, then place a parallel copy on the end of minute wave ii. When minute wave iii is complete, this would be an Elliott channel and the lower edge may provide support for minute wave iv.
Minute wave iii has passed 1.618 the length of minute wave i. The next Fibonacci ratio in the sequence is used to calculate a target for it to end.
Minute wave iii may only subdivide as an impulse, and within it minuette wave (i) only may have recently ended as a long extension.
Within the impulse of minute wave iii, the upcoming correction for minuette wave (iv) may not move back into minuette wave (i) price territory below 2,694.97.
Because minuette wave (i) with this wave count is a long extension, it is reasonable to expect minuette wave (iii) may only reach equality in length with minuette wave (i). This target fits with the higher target for minute wave iii one degree higher.
HOURLY CHART
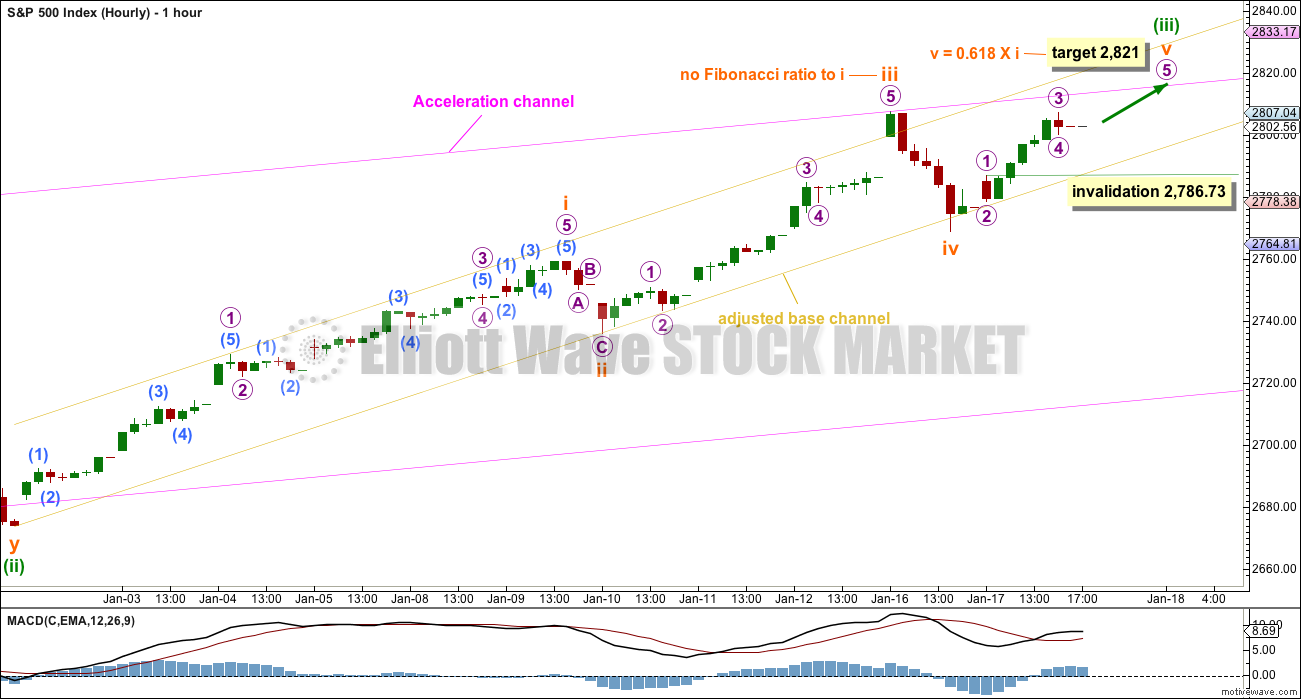
Always assume that the trend remains the same until proven otherwise. At this stage, there is no technical evidence for a trend change; we should assume the trend remains upwards.
Within subminuette wave v, micro wave 4 may not move into micro wave 1 price territory below 2,786.73.
If price makes a new all time high tomorrow, then minuette wave (iii) could be over quickly.
Subminuette wave iii is shorter than subminuette wave i. This limits subminuette wave v to no longer than equality in length with subminuette wave iii at 2,840.12, so that subminuette wave iii is not the shortest and the core Elliott wave rule is met.
Minuette wave (ii) was a very shallow combination lasting eight days. Minuette wave (iv) may also last about a Fibonacci eight days.
ALTERNATE HOURLY CHART
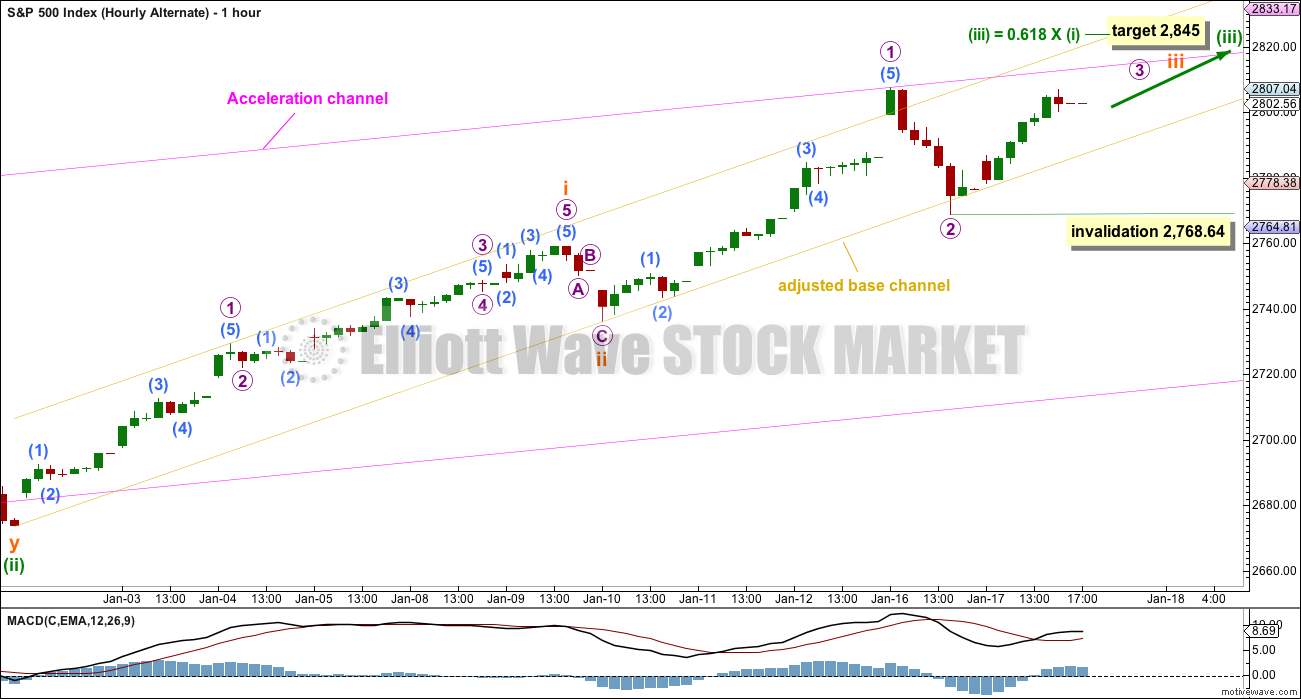
It is possible that subminuette wave iii is not over. However, this wave count is an alternate because the proportion of micro wave 2 does not look right to subminuette wave ii. Micro wave 2 looks too big.
If price breaks below the lower edge of the base channel, then this alternate wave count should be discarded. A lower degree correction at micro degree should not breach a base channel drawn about a first and second wave one or more degrees higher.
Micro wave 2 may not move beyond the start of micro wave 1 below 2,736.06. This wave count would be discarded prior to invalidation.
ALTERNATE DAILY CHART
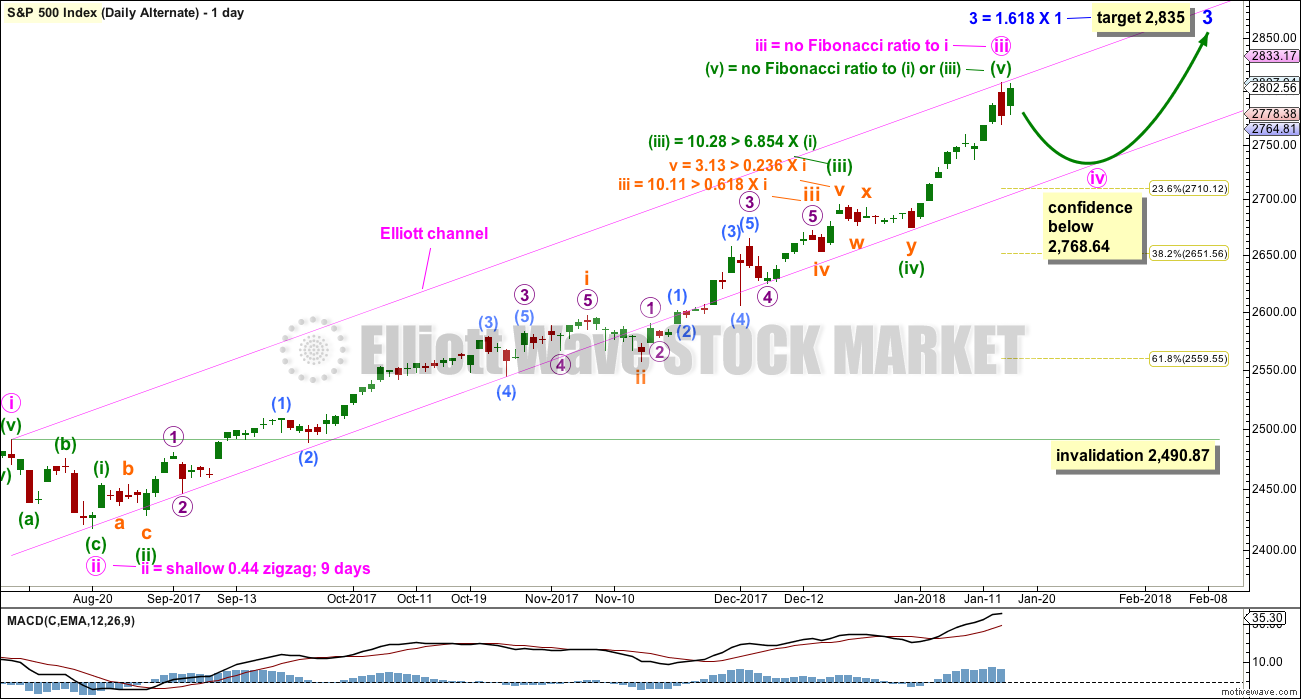
It is possible that minute wave iii is over. Confidence in this wave count may be had if the main hourly wave count above is invalidated with a new low below 2,768.64.
If minute wave iv is underway, then it may be expected to be reasonably in proportion to its counterpart minute wave ii correction. Minute wave ii lasted nine days, so expect minute wave iv to last a Fibonacci eight or thirteen days.
Minute wave ii was a zigzag, so minute wave iv may exhibit alternation as a flat, combination or triangle. These corrections are all sideways and usually more time consuming than zigzags.
Minute wave iv may end when it finds support about the lower edge of the pink Elliott channel. If it does not end there and if it overshoots the channel, then minute wave iv may end within the price territory of the fourth wave of one lesser degree. Minuette wave (iv) has its territory from 2,694.97 to 2,673.61.
Minute wave iv may not move into minute wave i price territory below 2,490.87.
TECHNICAL ANALYSIS
WEEKLY CHART
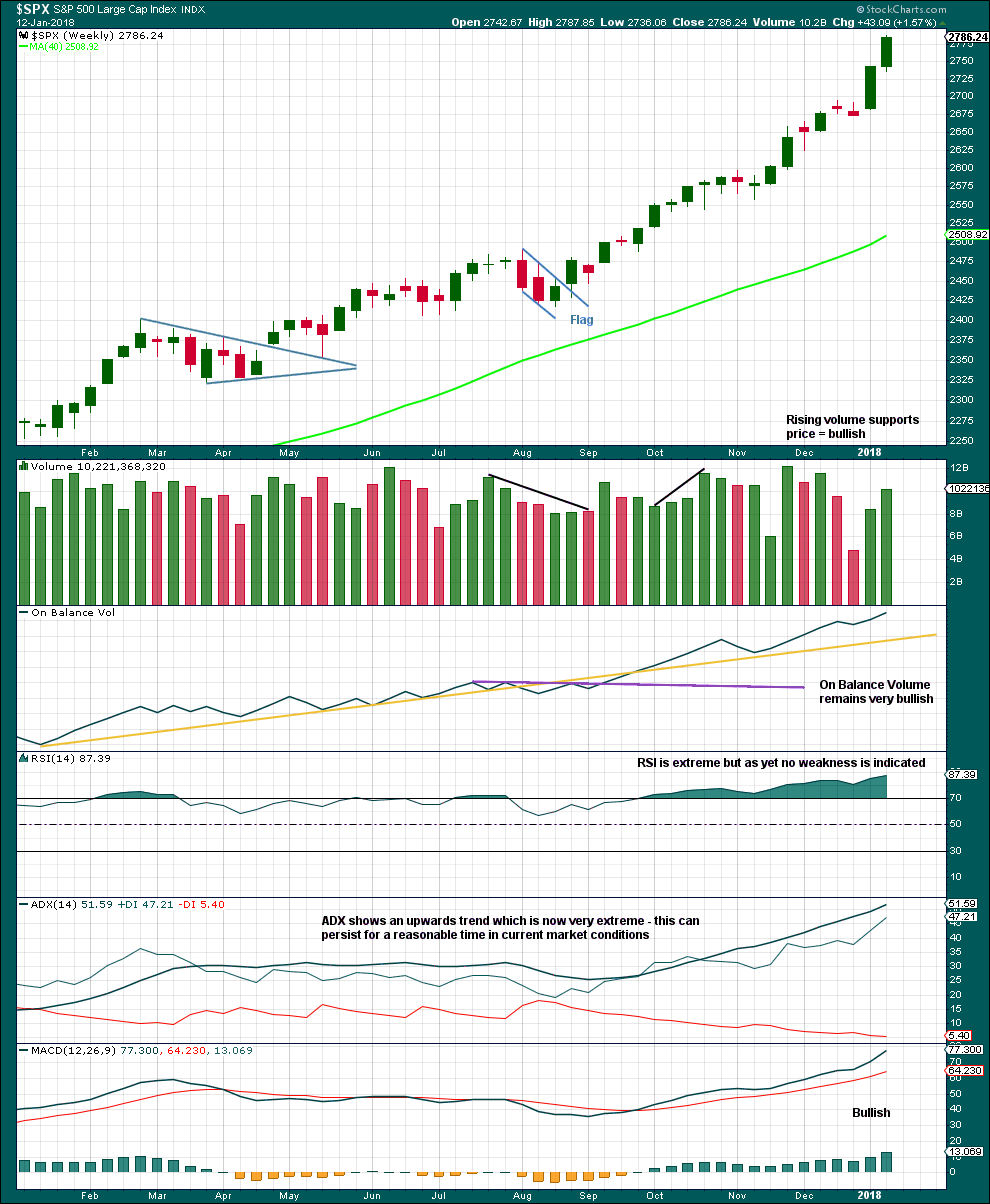
Click chart to enlarge. Chart courtesy of StockCharts.com.
Indicators should be expected to be extreme as a third wave at four degrees comes to an end.
When third waves are ending they fairly often will show weakness at the weekly chart level. There is still no evidence of weakness at this time. When intermediate wave (3) is close to or at its end, then we may expect to see some weakness.
DAILY CHART

Click chart to enlarge. Chart courtesy of StockCharts.com.
The target calculated using the last measuring gap was at 2,801, and this has now been met.
RSI is very extreme but can continue for longer. It now exhibits some divergence, but this is only single day and not enough to indicate reasonable weakness. Stochastics exhibits slight weak divergence, but not enough to indicate a correction should begin here.
This chart is still very bullish indeed.
The candlestick reversal pattern may indicate a correction to begin here. It remains valid despite today’s green candlestick. Only a close above the prior all time high would indicate this reversal pattern should be ignored.
It should be noted that there are a few reversal patterns on this chart already, none of which were followed by any sustained downwards movement: a bearish engulfing pattern on the 19th of December, a gravestone doji on the 21st of December, and a bearish engulfing pattern on the 23rd of October.
VOLATILITY – INVERTED VIX CHART
Click chart to enlarge. Chart courtesy of StockCharts.com.
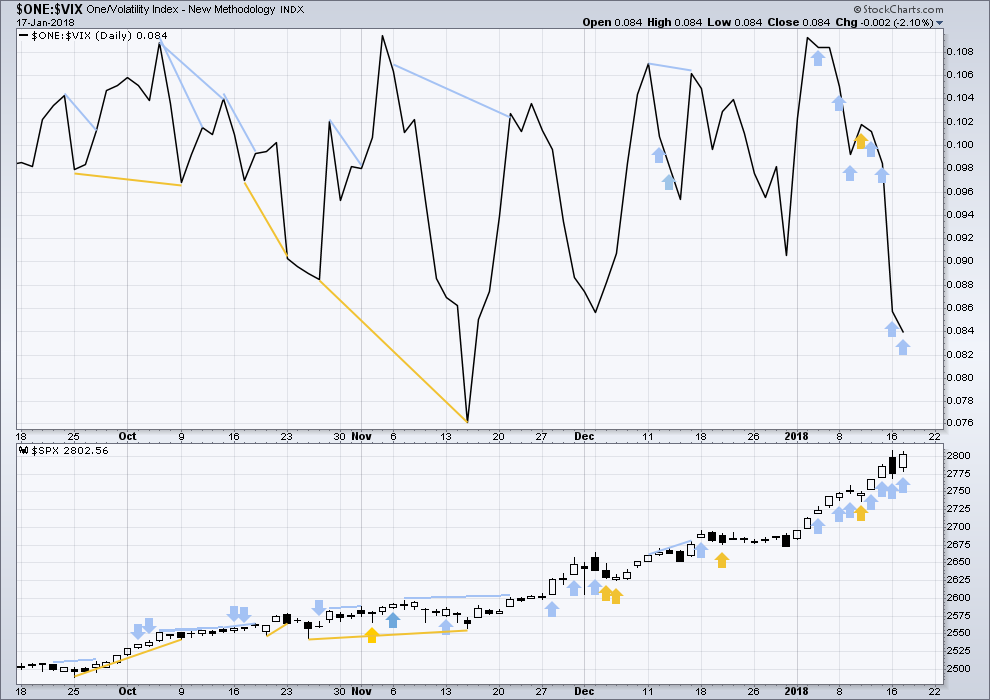
So that colour blind members are included, bearish signals will be noted with blue and bullish signals with yellow.
Normally, volatility should decline as price moves higher and increase as price moves lower. This means that normally inverted VIX should move in the same direction as price.
There are now four bearish signals in a row from VIX. Price moved sideways today, but the balance of volume was upwards and the candlestick was green. There has not been a normal corresponding decline in market volatility despite upwards movement during the session. Volatility has shown a further increase for the fourth day in a row. This is now very bearish.
BREADTH – AD LINE
Click chart to enlarge. Chart courtesy of StockCharts.com.
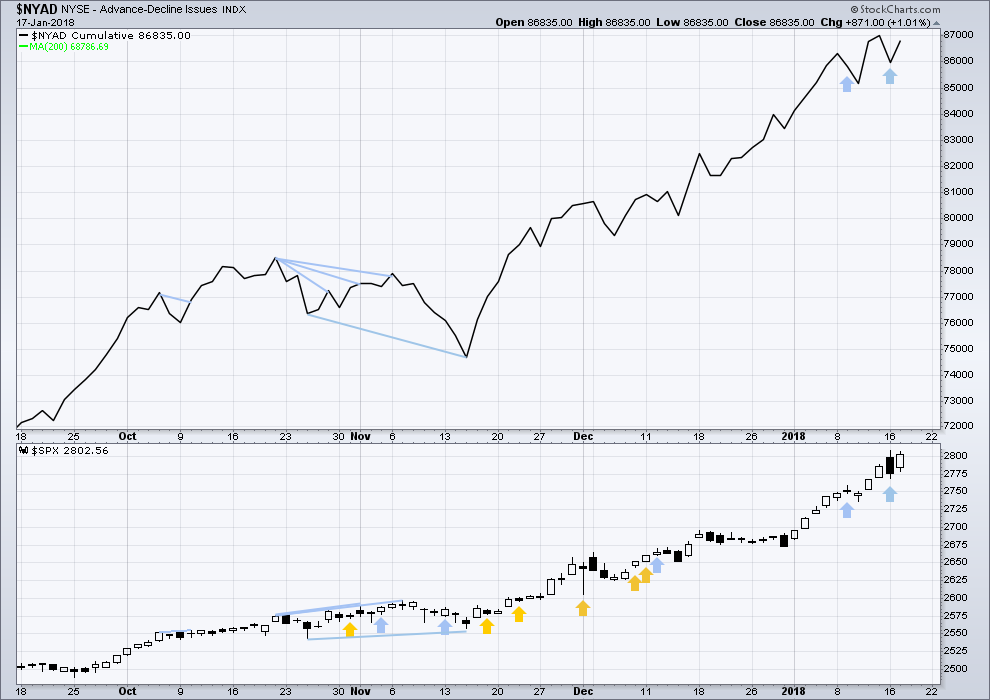
There is normally 4-6 months divergence between price and market breadth prior to a full fledged bear market. This has been so for all major bear markets within the last 90 odd years. With no longer term divergence yet at this point, any decline in price should be expected to be a pullback within an ongoing bull market and not necessarily the start of a bear market.
All of small, mid and large caps last week made new all time highs. This market has good support from rising breadth.
Breadth should be read as a leading indicator.
The bearish signal given yesterday has now been followed by upwards movement, so it may have failed.
There is no new divergence today between price and breadth. The rise in price today has support from rising market breadth, and this is bullish.
DOW THEORY
The S&P500, DJIA, DJT and Nasdaq last week all made new all time highs. The ongoing bull market is confirmed.
The following lows need to be exceeded for Dow Theory to confirm the end of the bull market and a change to a bear market:
DJIA: 17,883.56.
DJT: 7,029.41.
S&P500: 2,083.79.
Nasdaq: 5,034.41.
Charts showing each prior major swing low used for Dow Theory are here.
Published @ 08:18 p.m. EST.

BTW folk, VIX at 11 implies daily SPX range of about 12 t0 15 handles and that seems to be playing out so far, a scalper’s paradise so take advantage! 🙂
could this be a flat correction for minute IV?
Yes, it could.
I just re-entered with much larger positions both AG and IAG!
Here goes nothing!
VIX refusing to surrender upper B band. Selling 50 SPY 280 strike calls for 0.50, holding rest unless VIX does about face….
The trend remains up, until proven otherwise.
The lower edge of this adjusted base channel is again showing today where price found support and bounced up. That’s another good entry point for a long position.
The structure is incomplete. Subminuette v needs a final fifth wave.
If the target for minuette (iii) is wrong it may be a bit too high.
Minuette (ii) lasted eight sessions, so expect minuette (iv) to be about the same. Which means the upcoming expected correction is expected to be relatively brief and shallow.
Market makers must be in a great mood today. Just a penny spread on contracts expiring tomorrow…what’s up with that?! 🙂
Selling 25 for 0.52….
Continuing with the scalping theme, selling SPY 278.50/279.00 bull put credit spread for 0.14 per spread. We could possibly get a turn tomorrow and closing the 279 short put on the next move up allows positioning for any market turn manana…
..
Buying speculative SPY 280 strike calls expiring tmorrow for 0.30 per contract; small batch of 100 contracts, will sell 278 strikes if today’s low taken out.
Stink bid for Feb SPY 280 puts not very realistic at around 2.75 bid.
Switching to Jan 26 280 puts now bid at 2.00 even.
Let us cheer for one final manic upside thrust…! 🙂
So far the 38% fibo has held with a clean bounce. I view that as bullish…assuming it continues to hold! If it breaks, THEN I think price is moving into multi-day minimum and perhaps week correction phase. But until the market STOPS surprising to the upside, I’m not going to be surprised anymore. I do have a bet on that that fibo holds…a nice close “invalidation point”.
Yep. Typical for a fourth wave retrace…one more high….
Next seismic market event is a possible VIX gap past 13, which according to some quants, is the “event horizon” for the leveraged short vol trade. If this is what the hedge funds believe, it makes perfect sense that they will target that level. If a move past VIX indeed results in lots of dead men walking, look for one helluva fight to reverse any such move, and whoever wins that battle could be very important. I still think VIX 15 as per Fasanara Capital’s numbers is more critical.
Hear me now and believe me later…if we DO NOT get a meaningful retreat of VIX (at the very least back inside B bands) on any final wave up, I am personally setting my own hair on fire if it does not burst into flames spontaneously!
But seriously, it would stronlgy suggest that the long vol trade is now overpowering the short vol trade, and/or that the real muscle behind the short vol trade, namely the banksters, have withdrawn. I don’t care what anyone says. Reatail investors alone , including hedge funds could not have skewed vol to this extreme without CB participation….no way Jose!
Verne, if you do that I would recommend having a friend on standby with some water. And a camera too please 🙂
Where is Olga??!! 🙂
Opening “stink bid” to reload SPY 280 puts at 0.50 with Feb week one expiration date. If we hit Lara’s target around 2840 order should easily get filled….
I am now fully focused on VIX. I want to see a CLOSE above 13, and THEN I start to get excited….
Do you think we get a 1 to 2 full day correction in DOW & S&P here?
Lines in the sand are being defended right as we speak Joe. It’s all up to powers that be. Really, no more allocations left to buy, except for central banks, especially this quarter.
Yep! 26K DJI and 2.8K SPX seem to be battle lines….
Probably not until the final fifth up. People are now becoming so accustomed to these wild market swings they are likely to remain unperturbed by the correction’s initial waves down. I hope VIX moves back inside the B bands or I will have no idea how to spot the likely bottom…
O.K., I was a WUSS and sold puts for 1.75. I know, I know….no “huevos” you say…a real trader would be ADDING…and you are probably right….
I’d say good decision myself. The (circle) 5 wave is just about starting up here, and the VIX should be dropping as it proceeds upward. I’ve got a substantial XIV position myself, to take advantage of that (go SPX!!!). As that 5 wave completes…then it’s time to get aggressive on the long volatility side (not that I will, just sayin’). In my opinion. Best of luck Verne.
Friendly warning Kevin, while I believe you’re likely right about (5) up on the short term time scale, the inverse vol products are set to explode, and you’d be better off long SPY or call options to participate.
Uh Huh. I have long expected ongoing VIX divergence with price to signal a final wave up so that could happen. If we see another intra-day gap up in VIX it’s probably the smart money exiting ahead of the crowd…or savvy traders piling in on the long side…SVXY interesting…
Bought some SVXY Puts March 120s
Will yer be a’ladderin’ in then will ya matey?!…. 🙂
They will explode in concert with rapid down movement in SPX. Only. In my opinion. Which may be coming. Or may not be. Wave count says less likely than not. We’ll see. I still suspect the 2792.3 fibo in SPX is likely to hold, it’s being approached very timidly. But news could cause a market rout at any time, too. Okay, I’ll wait for an SPX bottom here, lick a few wounds, and get ready for the XIV explosion that will certainly be coming after this pullback is complete. As that starts up, I will be piling on. The bull is merely taking a short breather here, and VIX will settle back down as the bull turns the market back up. A day or a week or more, it’s all fine with me.
Sure enough, push up in SPX as called for by WC, and a BIG push up in XIV to match it. I caught that with added size, covering my messed up morning trades. Any landing you can walk away from, ready to fly another day! Lol!!
As most folk probably know, I have been long expecting some interesting price action in volatility but extended 2+ standard deviations???!!
Is it time to just pile into UVXY and go fishin’??!
Another good example today of not getting bamboozled by bogus bid/ask on VIX contracts. They posted a ridiculous 1.10/1.50 for those 11.00 strike calls but coughed up 1.35…. 🙂
DJI alone at new ATH. I think I will wait to see if we get a bearish engulfing candle by the close. If the other indices join DJI I am bailing pronto….!
Everything so far looks perfectly consistent with the hourly main. Although I don’t particularly believe in a turn this morning in the middle of no man’s land; I suspect more sell off to the 38% fibo, at least (higher blue line on chart, 2792.3).
Yep. I think that’s the ticket….I think the reversal is going to be sharp after the fifth up, so I will probably be lowering cost basis on the final sprint…
Of course I took the money an ran like a bat out of you -know -where on VIX calls…what else?? 🙂
What shall I do? Very nice pop on my puts.
Should I hold, or should I fold?
Can I have a forum vote…PLEEZE? 🙂
Puts on VIX or on the market?
If on the market, logic would say that a full day or couple of day correction will occur. Even if only $200 to 300 points in the DOW… Then back to crazy land!
Now I see you answered above. But really can we at least get a correction that lasts 1 or 2 full days!
SPY 280 puts snagged yesterday…
Conventional wisdom states that we can expect extended periods of low volatility to be followed by the opposite. I don’t remember ever seeing VIX trade above its B band for three consecutive days. Perhaps the extended low readings period is making the current price action appear unusual when in reality it is simply a part of the process of returning to more normal price levels.
Despite printing a red candle, VIX remains ABOVE its upper B band.
I am not sure what is going on here. I am sure this is NOT normal market behavior…
No, it’s not. At least, I can’t see this kind of weird divergence between S&P500 and VIX for four days in a row to this great degree before….
I guess I am here alone. Not even a rabbit to keep me company.
Thanks Lara for the excellent analysis.
I am missing the rabbit as well Rodney. 🙂
You’re welcome Rodney.
Pretty sure that rabbit will be back when he’s finished doing his rabbit things…