The hourly chart in yesterday’s analysis expected a little more upwards movement for the very short term. This is exactly what has happened.
The bigger picture remains the same, and a little more confidence is had in this analysis with the structure completing as expected.
Summary: Upwards movement may end tomorrow about 2,650. Thereafter, look for the pullback to continue to about 2,624 or 2,599; this may be a second wave correction. Thereafter, look for the bull market to resume towards the target about 2,773.
If price makes a new low below 2,557.45, that would indicate a multi week (about 10) correction may have arrived.
Always trade with stops and invest only 1-5% of equity on any one trade. All trades should stick with the trend. The trend remains up.
Last monthly and weekly charts are here. Last historic analysis video is here.
The biggest picture, Grand Super Cycle analysis, is here.
MAIN ELLIOTT WAVE COUNT
WEEKLY CHART
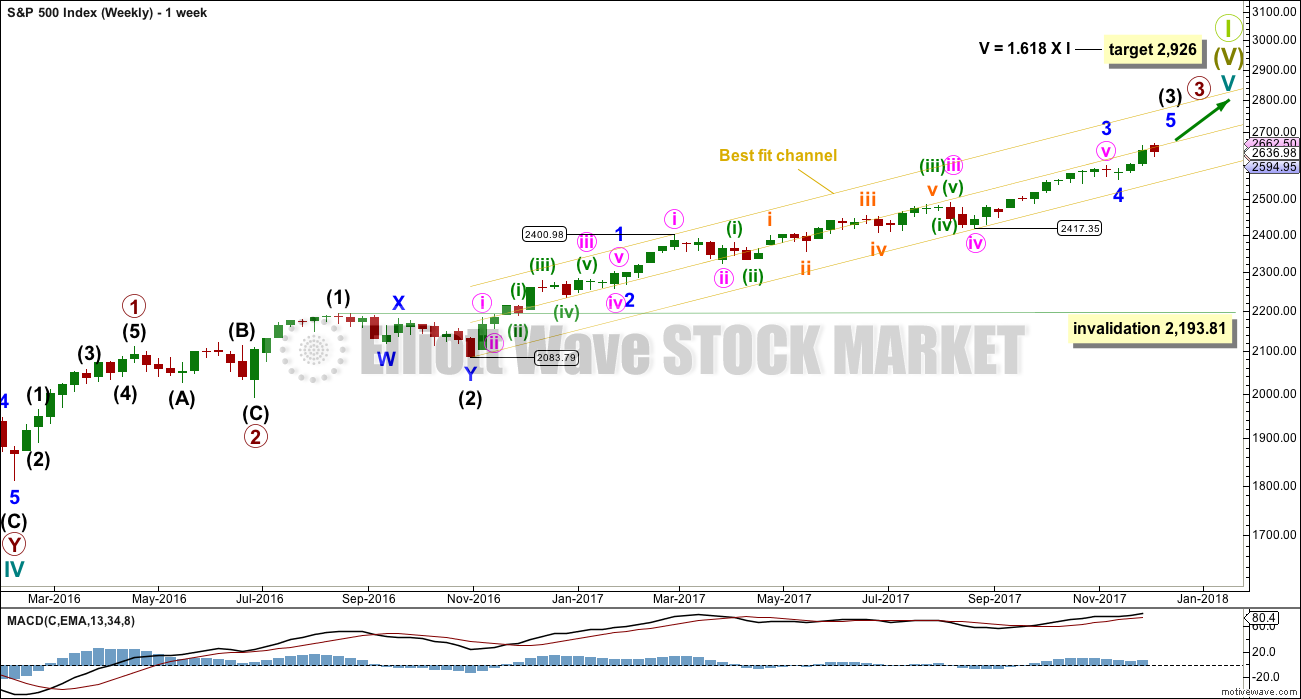
Cycle wave V must complete as a five structure, which should look clear at the weekly chart level. It may only be an impulse or ending diagonal. At this stage, it is clear it is an impulse.
Within cycle wave V, the corrections for primary wave 2 and intermediate wave (2) both show up clearly, both lasting several weeks. The respective corrections for intermediate wave (4) and primary wave 4 should also last several weeks, so that they show up at weekly and monthly time frames. The right proportions between second and fourth wave corrections give a wave count the right look. This wave count expects to see two large multi week corrections coming up, and the first for intermediate wave (4) may now be quite close by.
Cycle wave V has passed equality in length with cycle wave I, which would be the most common Fibonacci ratio for it to have exhibited. The next most common Fibonacci ratio would be 1.618 the length of cycle wave I.
Intermediate wave (3) may now be nearing completion (the alternate hourly wave count looks at the possibility it could be complete at the last high). When it is complete, then intermediate wave (4) should unfold and be proportional to intermediate wave (2). Intermediate wave (4) may be very likely to break out of the yellow best fit channel that contains intermediate wave (3). Intermediate wave (4) may not move into intermediate wave (1) price territory below 2,193.81.
The yellow best fit channel is redrawn. Price points are given so that members may replicate this channel. This channel is copied over to the daily chart.
DAILY CHART
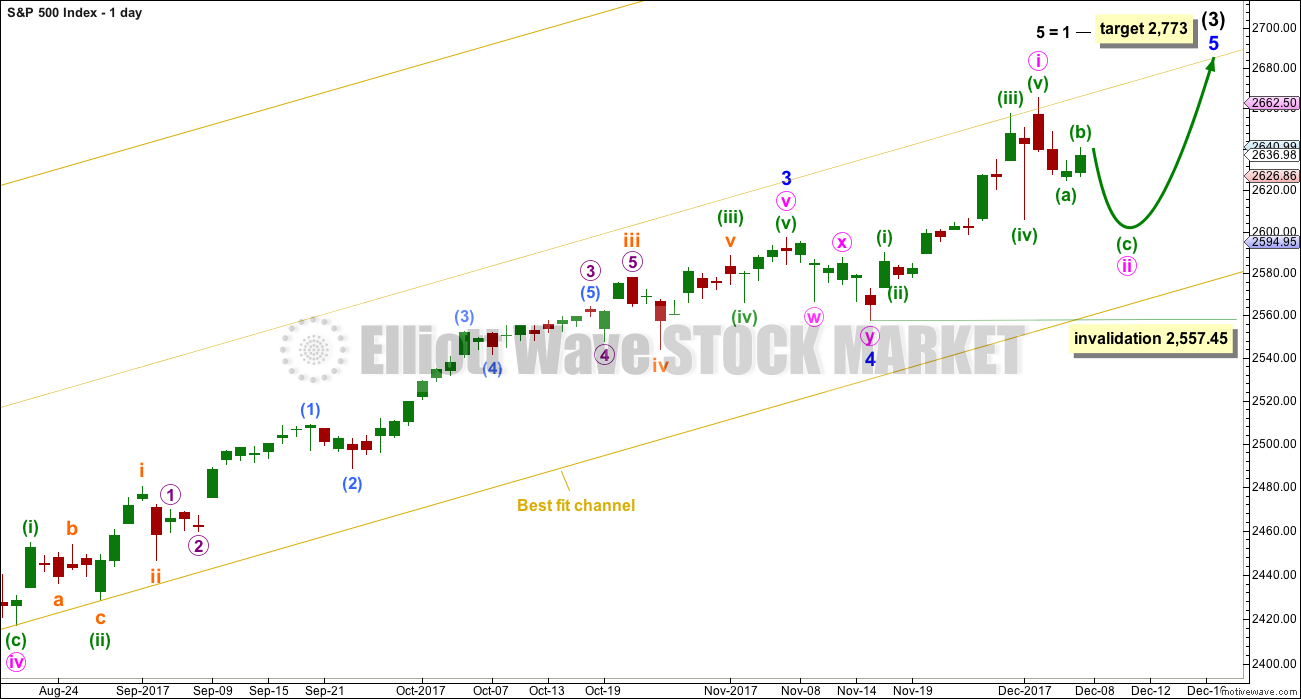
We should always assume the trend remains the same until proven otherwise. Assume that minor wave 5 is incomplete while price remains above 2,557.45.
The target calculated for minor wave 5 expects it to exhibit the most common Fibonacci ratio for a fifth wave. This target would not expect a Fibonacci ratio for intermediate wave (3) to intermediate wave (1).
Within minor wave 5, no second wave correction may move beyond the start of its first wave below 2,557.45.
HOURLY CHART
This first hourly chart follows on from labelling on the daily chart.
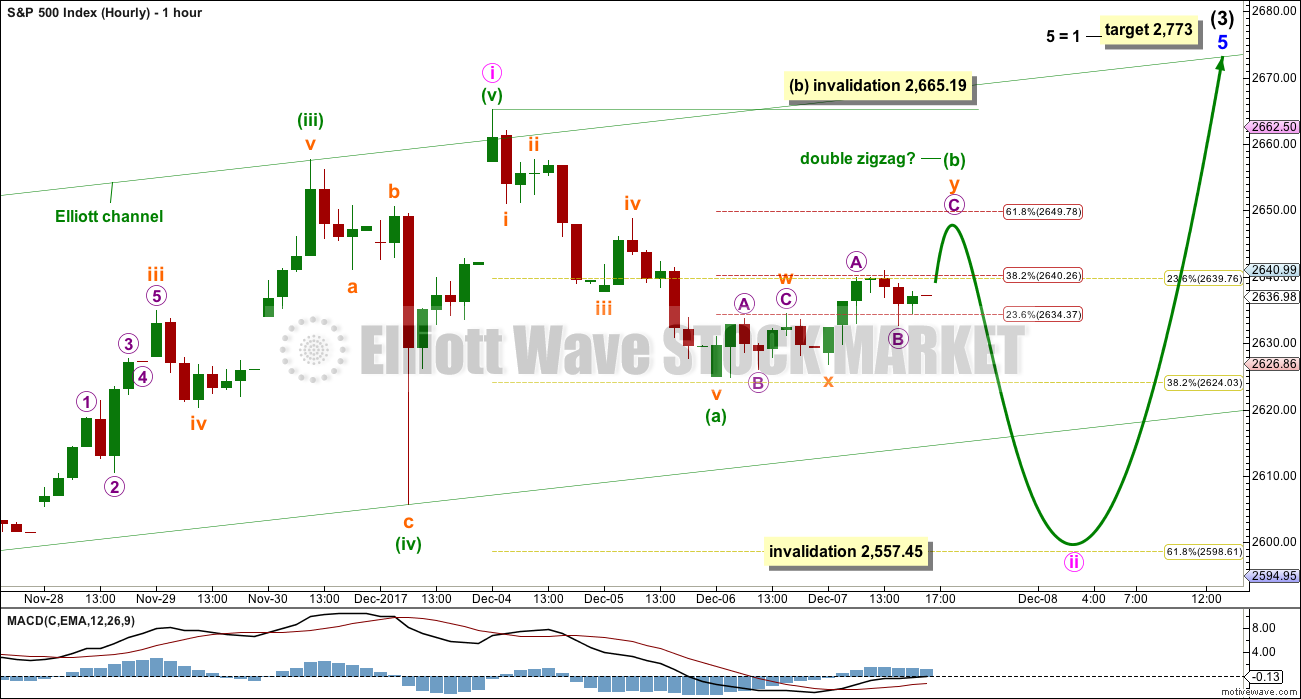
Minute wave ii may take a few days to complete. The most likely point for it to end may be the 0.618 Fibonacci ratio about 2,599, but the 0.382 Fibonacci ratio about 2,624 is also a reasonable target.
There is a five down complete at the hourly chart level. It looks like this is now being followed by a small bounce for minuette wave (b). At this stage, it looks like the structure of minuette wave (b) is an incomplete double zigzag. The second zigzag in the double may end close to the 0.618 Fibonacci ratio of minuette wave (a) about 2,650.
Minuette wave (b) may not move beyond the start of minuette wave (a) above 2,665.19. When minuette wave (b) is complete, then another five down should unfold for minuette wave (c).
Minute wave ii looks like it may now end closer to the 0.618 Fibonacci ratio than the 0.382 Fibonacci ratio. It may be subdividing as a simple zigzag.
ALTERNATE HOURLY CHART
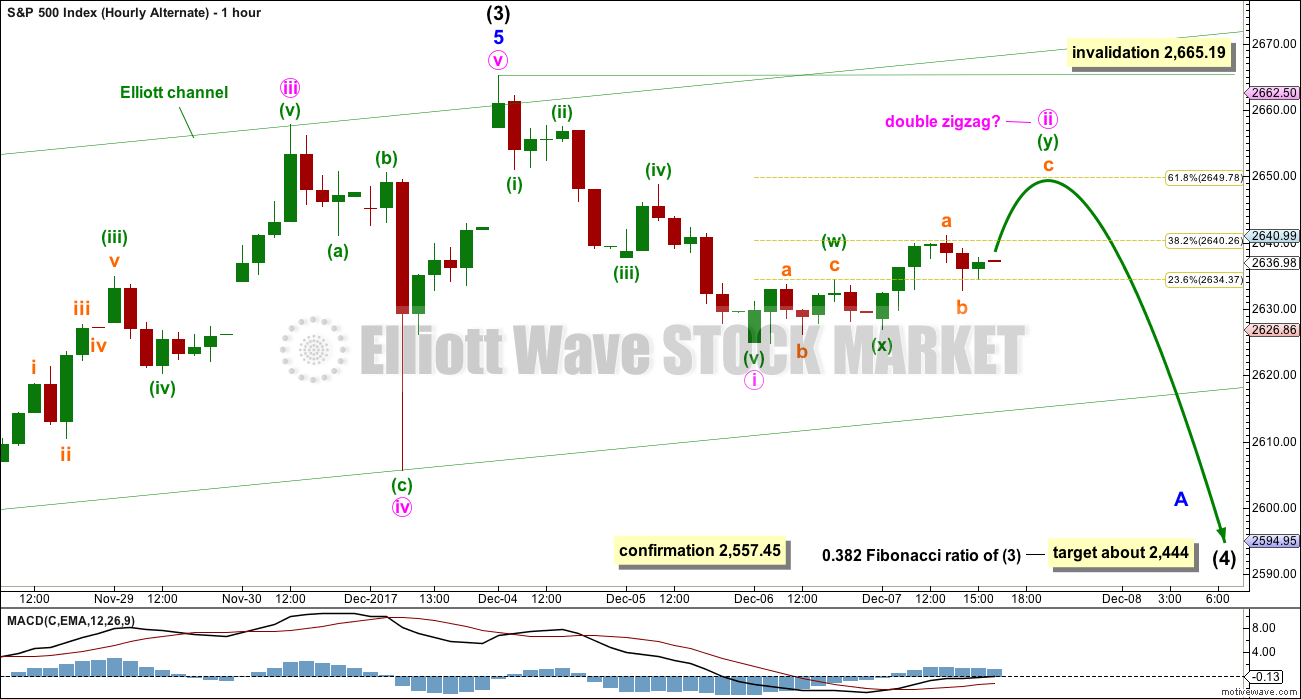
Because we should always assume the trend remains the same until proven otherwise, this wave count should be considered an alternate while price has not confirmed it.
By simply moving the degree of labelling within the five up from the end of minor wave 4 all up one degree, it is possible to see that intermediate wave (3) could be over.
If this wave count is confirmed with a new low below 2,557.45, then it would expect a multi week pullback or consolidation for intermediate wave (4) to last about ten weeks or so. If it is a complicated combination or a triangle, then it may be longer lasting, possibly a Fibonacci thirteen or even twenty-one weeks.
At this early stage, the 0.382 Fibonacci ratio of intermediate wave (3) would be a reasonable target.
For the short term (the next week or so), a trend change at intermediate degree should see a larger five down develop at the hourly chart level. So far only a first wave within that five down may be complete.
Minute wave ii may not move beyond the start of minute wave i above 2,665.19.
Both wave counts expect overall the same direction next.
TECHNICAL ANALYSIS
WEEKLY CHART
Click chart to enlarge. Chart courtesy of StockCharts.com.
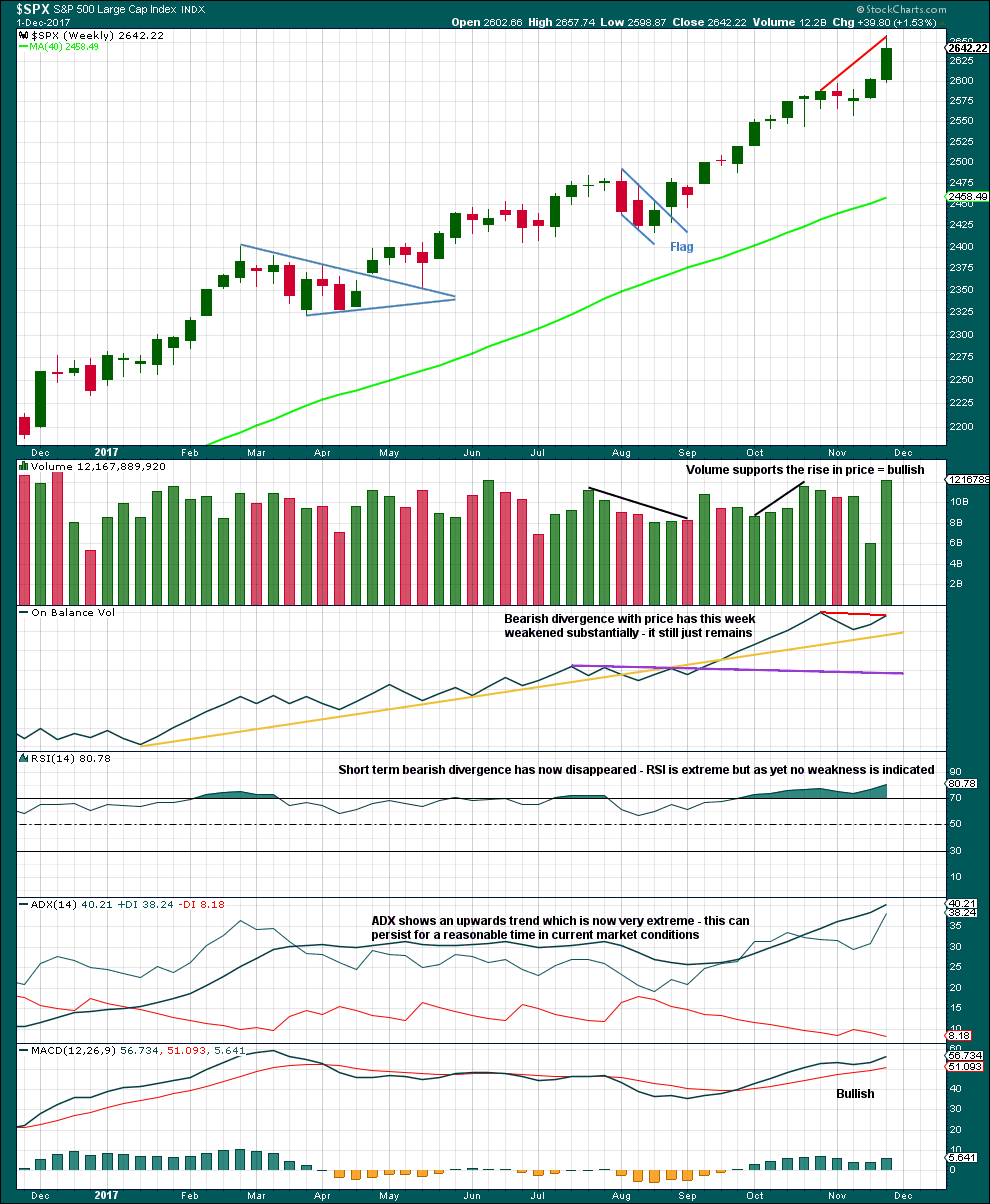
This last week completed the strongest volume for a year, which for an upwards week is very bullish.
The problem with divergence, and one reason why it is hopeless as a timing tool, is that sometimes it just disappears. That is what has happened between divergence with price and RSI. Still, the failure of On Balance Volume to make new all time highs with price is bearish especially if On Balance Volume is a leading indicator.
This trend is extreme, but it could still continue for a while longer. Look for a candlestick reversal pattern or a bearish signal from On Balance Volume.
DAILY CHART
Click chart to enlarge. Chart courtesy of StockCharts.com.
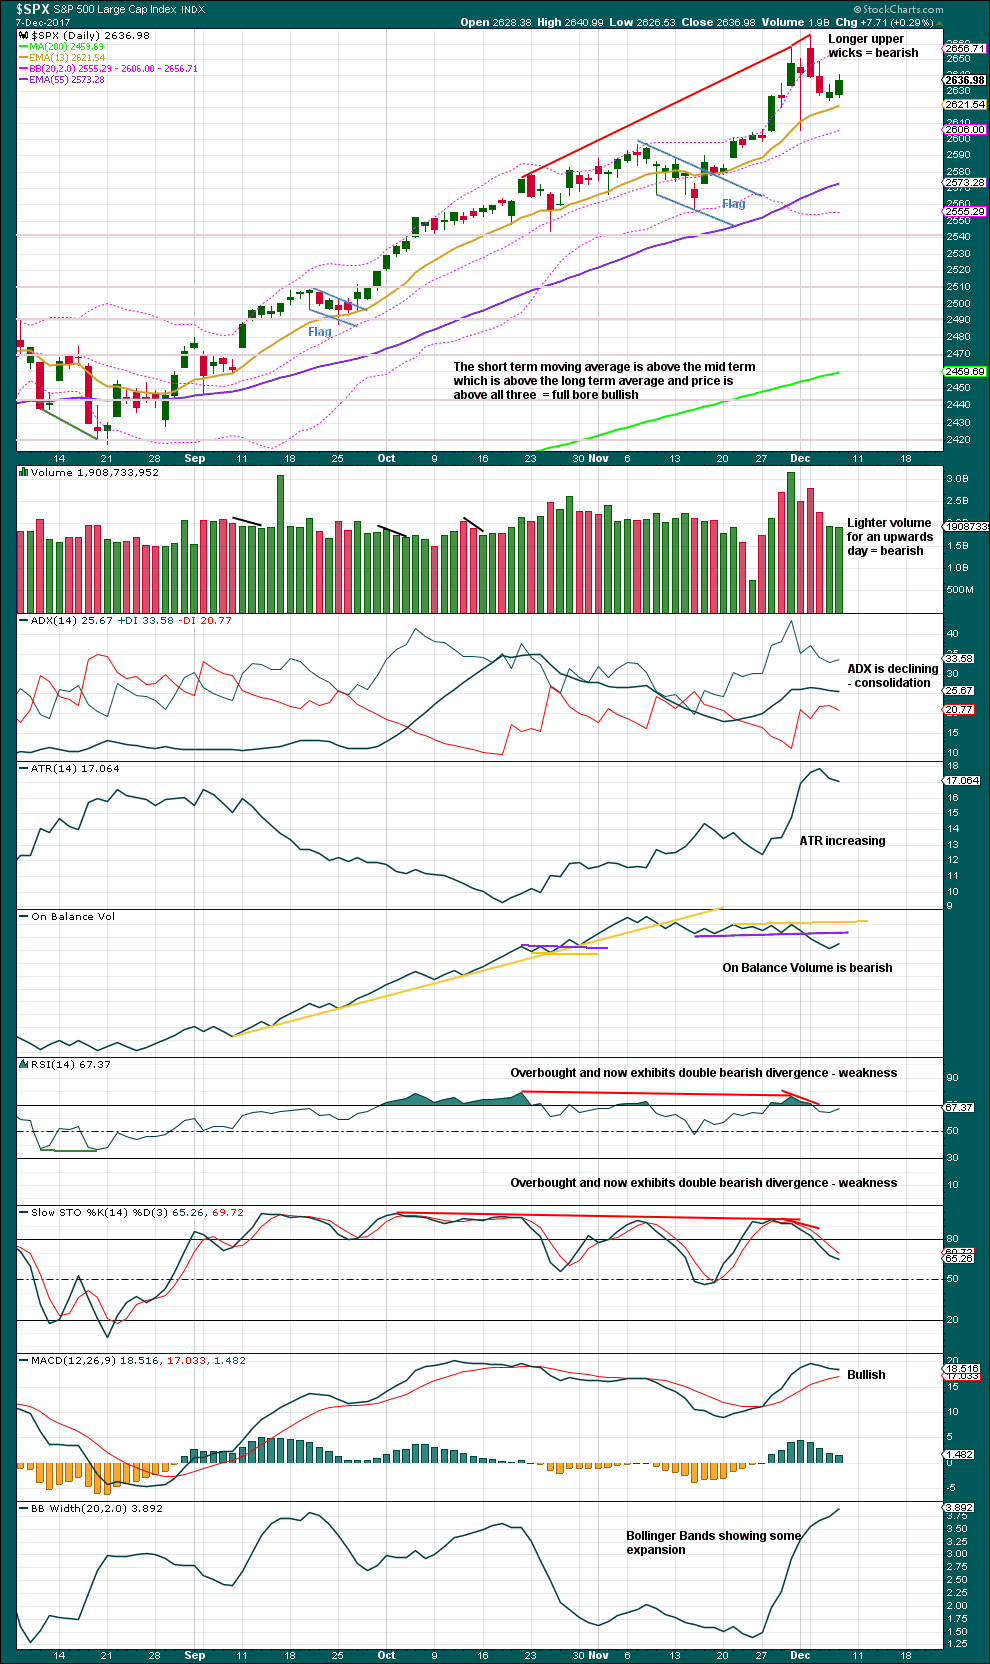
Price can fall of its own weight for some time, and this does tend to happen either early on in a trend or at the end of a trend. An absence of buyers can achieve a fall in price, having the same effect as activity from sellers. Slightly lighter volume on an upwards day indicates that this small upwards day may be a move against the short term trend.
RSI, Stochastics and On Balance Volume are all bearish.
This analysis gives weight to the bearish signal from On Balance Volume. This is exactly the kind of signal which turns up at trend changes of reasonable magnitude. It is looking a little more like a trend change of a reasonable magnitude, and this supports the alternate hourly Elliott wave count.
VOLATILITY – INVERTED VIX CHART
Click chart to enlarge. Chart courtesy of StockCharts.com.
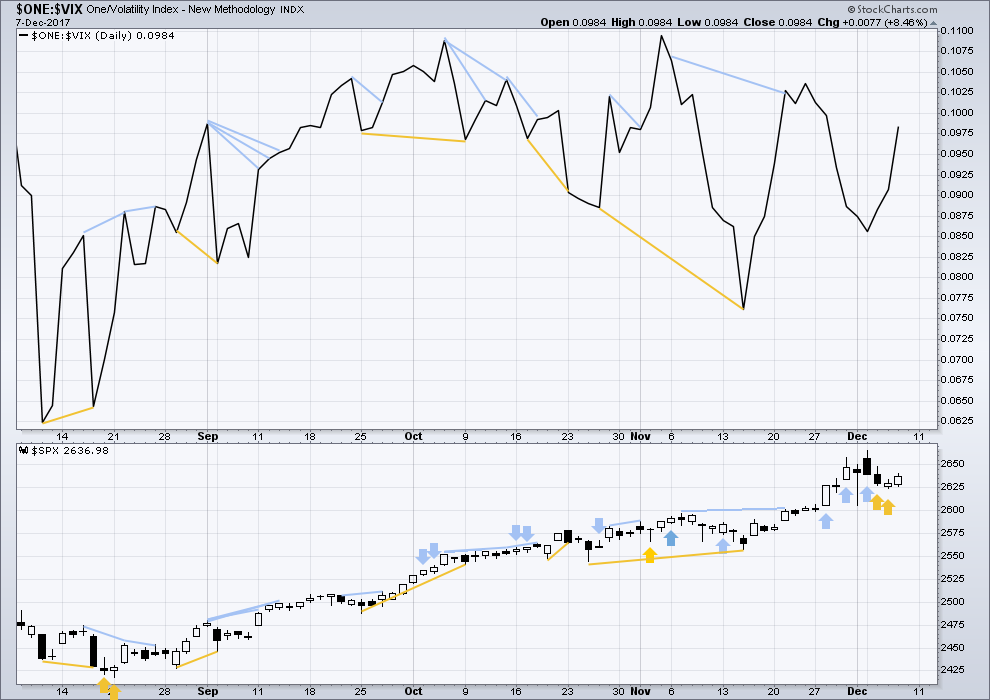
So that colour blind members are included, bearish signals will be noted with blue and bullish signals with yellow.
Normally, volatility should decline as price moves higher and increase as price moves lower. This means that normally inverted VIX should move in the same direction as price.
The bullish signal noted between price and inverted VIX has now been followed by an upwards day. It may now be resolved.
The rise in price today came with a normal corresponding decline in market volatility.
BREADTH – AD LINE
Click chart to enlarge. Chart courtesy of StockCharts.com.
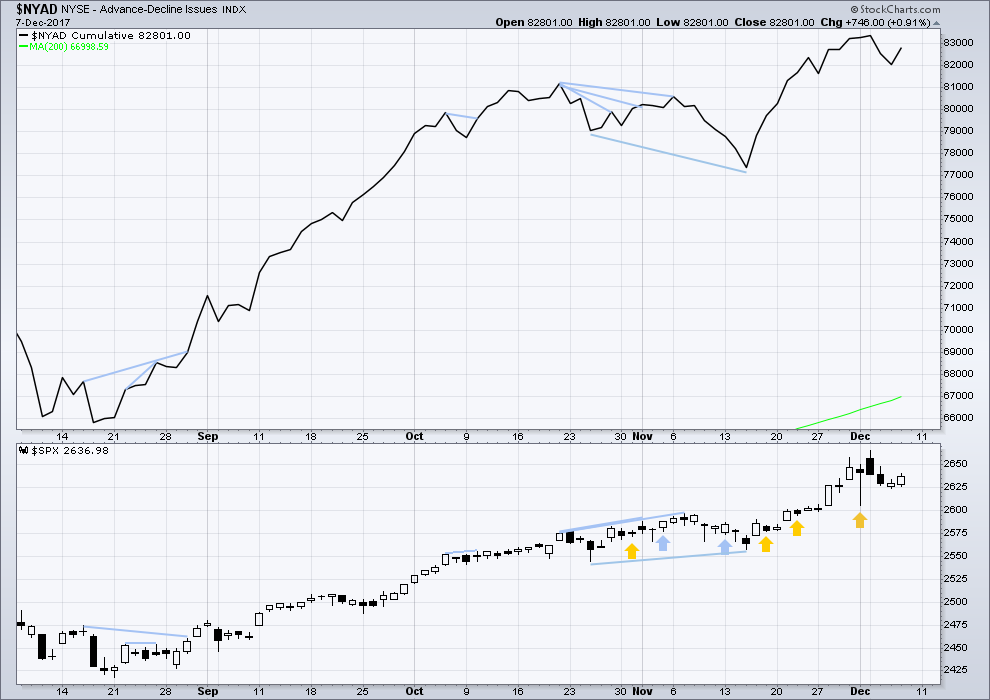
There is normally 4-6 months divergence between price and market breadth prior to a full fledged bear market. This has been so for all major bear markets within the last 90 odd years. With no longer term divergence yet at this point, any decline in price should be expected to be a pullback within an ongoing bull market and not necessarily the start of a bear market.
All of large, mid and small caps last week have made new all time highs. The rise in price has support from market breadth.
The small rise in price today came with a normal corresponding rise in market breadth. The rise in price has support from rising breadth, so this is bullish. There is no divergence at this time to indicate any weakness.
DOW THEORY
The DJIA, DJT, S&P500 and Nasdaq have last week made new all time highs. This provides confirmation of the ongoing bull market.
The following lows need to be exceeded for Dow Theory to confirm the end of the bull market and a change to a bear market:
DJIA: 17,883.56.
DJT: 7,029.41.
S&P500: 2,083.79.
Nasdaq: 5,034.41.
Charts showing each prior major swing low used for Dow Theory are here.
Published @ 08:58 p.m. EST.

On what is very likely a second wave, insane traders have shorted vol futurres to new extreme. I hope you are taking advantage!! 😉
Yeah, I had to buy some today, but glad I waited
As Kevin quite rightly notes below, we’ve been here before and expected a bigger correction which has simply not come.
Let’s see if it turns up this time.
This time the indicators are looking a bit different, which is why I’m tentatively leaning towards the alternate (but I want price to confirm it for us). That shorter term divergence with both RSI and Stochastics AND a bearish signal from On Balance Volume… we haven’t had that before in recent weeks. This time it does look more bearish.
But still… it could just all disappear and price could make a new ATH. Again.
Lets see how the indicators behave for the end of week analysis….
Minuette (b) (or minute ii for the alternate) is now perfectly at the 0.618 Fibonacci ratio of the prior five down. The structure is complete. It looks fairly likely to end here.
Two targets are calculated for the next wave down. This next wave down may be either minuette (c) for the main count, or it could be a third wave for minute iii for the alternate, hence the lower target of 1.618. That lower target would also see downwards movement breach the lower edge of the upwards channel which for the main count should happen.
This market is too choppy for short term trading, AND I am not currently certain of the intermediate (days to weeks) likely movement. The price evidence so far contradicts (as I see it) the wave count evidence (though the wave count calling for a C down is NOT invalidated yet). Time to stand aside and watch and wait for more evidence…
One small piece of evidence supporting the short side: both RUT and SPX has small double tops in place now. And now price is falling…
? as far as I can see the price action is exactly what the wave count expected… ?
a five down, now a three up to 0.618 of the five down….
let’s see what volume has to say at the end of the week
I’m perturbed by the (admittedly small) break of the .618. And the unwillingness of the market to even attempt to close that gap today. And the relatively strong action of RUT over the last 2 days. Perhaps overly perturbed. That just doesn’t look and feel right to me re: the likelihood of a C down here. For me, caution here is the better part of valor. Looks like it won’t be sorted out until early next week. I’m watching closely for the initiation of a sharp move down, nonetheless, until the close today, and proceeding into Monday.
Yes indeed! Picture perfect!!
I LOVE the VIX futures divergence with the lower high, one of my favorite set-ups for some nice impending droopage. Look alive people! 🙂
Back in the VIX trade.
My fattest position on quite some time! 🙂
VIX below 10 and a possibly terminal SPX move?? Somebody wake up da wabbit!!
What’s up Doc?!
Here goes nothing….. executed as SPX hit zone 2648.50-2649.
Ka-boom. Nice play! “According to Hoyle” (and Lara!).
Let’s see if that’s it and the gap starts filling, or, another test.
Another chance near 2650… 3rd time today a charm?
Looks like the Bulls have shot their entire _ _ _ _ near 2650! LOL
They are trying a 4th push to near 2650. 20 min chart.
If all ED’s per old man in each index turn down will be powerful.
2649.84 hit …. Lara’s alt hr exact target 2649.78 …. officially met now.
Oops! Now, will the 76.4% hold at 2655.5??? The bull appears to be very much alive and well, despite rumors to the contrary. At least for the moment!
Double Zig Zag just about done it appears… 🙂
They want all the suckers in!
The SPX hourly MACD has turned upwards from an oversold condition. It may be giving us a clue this morning’s gap will not be filled. Thus it could be a break away gap.
Yes… but look at a daily chart of the SPX for 3 months.
Plenty of room to run on the downside…
Also, That Daily Candle Stick Pattern in SPX and $DJI… Appears to me to be a topping pattern over the last 5 to 7 days or a high probability of a topping pattern. Certainly doesn’t look like a continuation candlestick pattern to me. The weekly sticks look bearish.
True enough. And Lara has said she is leaning towards the hourly alternate with a target of 2444. But she is hesitant to commit to it without confirmation of breaking 2557.
This hourly alt count… is the 1st count in a while that lines up with what have been seeing and feeling. But I have been wrong or early.
SO we shall see. But I still think a shot at a short is worth it. Use stops of course at or above the points you both have mentioned today and I am going to put another short on very soon.
The looming 61.8% retrace fibo may very well be a strongly self-fulfilling resistance point here; lots of algos and human traders are likely to sell off there. And on the other side…if it plunges through with authority, likely to buy strongly.
The set-up today may be to sell the 1st hour bounce today…
At least in a true price discovery free market, that would be the play.
2,649.50 was hit 5AM – 5:20AM IN ES… so if futures hold up 2,650 SPX may be hit in the 1st hour of trading or at least get close to.
That’s where to take a shot to short whatever index you are trading.
At least in a true price discovery free market, that would be the play.
Much will be revealed today, one way or another. Last time we expected this kind of abc down…the c never came, and the a become the 4, as I remember. Could happen again! 2650 is key, then 2655.5, the 76.4%. If THAT gets broken, most of the time price will hit the 1.27% extension of the previous down move, about 2675.2 or so here. I’ll be getting long if that 76% is broken to the upside for that reason.
Several if not most of the corrections we have expected over the past month or two have not fully developed as expected. That is why it has not been as easy as some may believe to enter long joining the trend (or add longs) on corrections.
Couldn’t agree with you more Rodney; it ain’t EASY!! This gap open and stall (and I see similar in lots of equities I follow) indicates to me this market is probably (probably) baked to completion for the time being. That gap “should” fill today, and then down next week. Could be wrong…but that’s my roadmap for the day at the moment, and if and as confirmed, that’s how I’ll trade it. A small push up and touch at 2650, THEN a turn wouldn’t surprise me. Right now…just hanging in the balance.
The most recent inflection point is above at 2658. If the SPX is to turn down it will have to do so before that point. If it breaks through we are in another up wave. Right now Lara’s script is right on. It is difficult or even foolish to go against that script.
Lara has cautioned about going against the longer term trend which is upwards.
The Daily & weekly Candle Sticks show (to me anyway) that the alternate hourly may now be in play or a higher probability of.
The daily cluster of sticks.
I’m for the most part not a positional trader, and not remotely suggesting anyone consider my approach/trading style etc., or in any way/shape/form follow me. I do counter trend trade; simply put, my “style” is to try to grind out closed trade profits every day, and I have all kinds of personal reasons why I have adopted that style for the time being. I recognize I’m the odd duck here, and for that reason, I actually try to limit what I say here about taking trades, vs. just market action. I’ll try to get back to that. You can consider my actual trading as “implied” from my view of the likely short term action. Thanks for pointing out I’m working the market in a manner not suggested for most!
No worries Kevin, you are clearly experienced and making $$ at however you’re doing it.
There are a fair few traders here much more experienced than I am, and so I hesitate sometimes to try and offer trading advice. It’s pretty much intended for the less experienced members. And I expect that many of you here can safely ignore it.
In short, you are probably more experienced at trading than I am.
*edit to add: my risk management advice however is another story, everyone should be following that
dilly dilly
You beat me Doc. I wasn’t Lightning Rod today! Regarding your previous questions from yesterday’s post; that’s enough bragging from me. I played defensive line. Perhaps more importantly I was the Scholar Athlete of the year my last three years as a chemistry major. Year later I went on to become a tri-athlete at the age of 30. At 63 years age I am a long distance backpacker and bushcrafter for my hobbies and exercise. I’ve had my fair share of spine and neck issues. But I am not doing too bad.
Care for a game Doc?
Too old now, Bugs. I’d be liable to break every bone in my body.