Analysis for the last two days has expected overall downwards movement. A small channel provided on the last hourly chart was used to indicate when downwards movement may be over for the very short term, if price breached it.
Summary: For the short term, look now for a pullback to about 2,624 or 2,599. This may be a second wave correction. Thereafter, look for upwards movement to continue towards the target about 2,773.
If price makes a new low below 2,557.45, that would indicate a multi week (about 10) correction may have arrived.
Always trade with stops and invest only 1-5% of equity on any one trade. All trades should stick with the trend. The trend remains up.
Last monthly and weekly charts are here. Last historic analysis video is here.
The biggest picture, Grand Super Cycle analysis, is here.
MAIN ELLIOTT WAVE COUNT
WEEKLY CHART
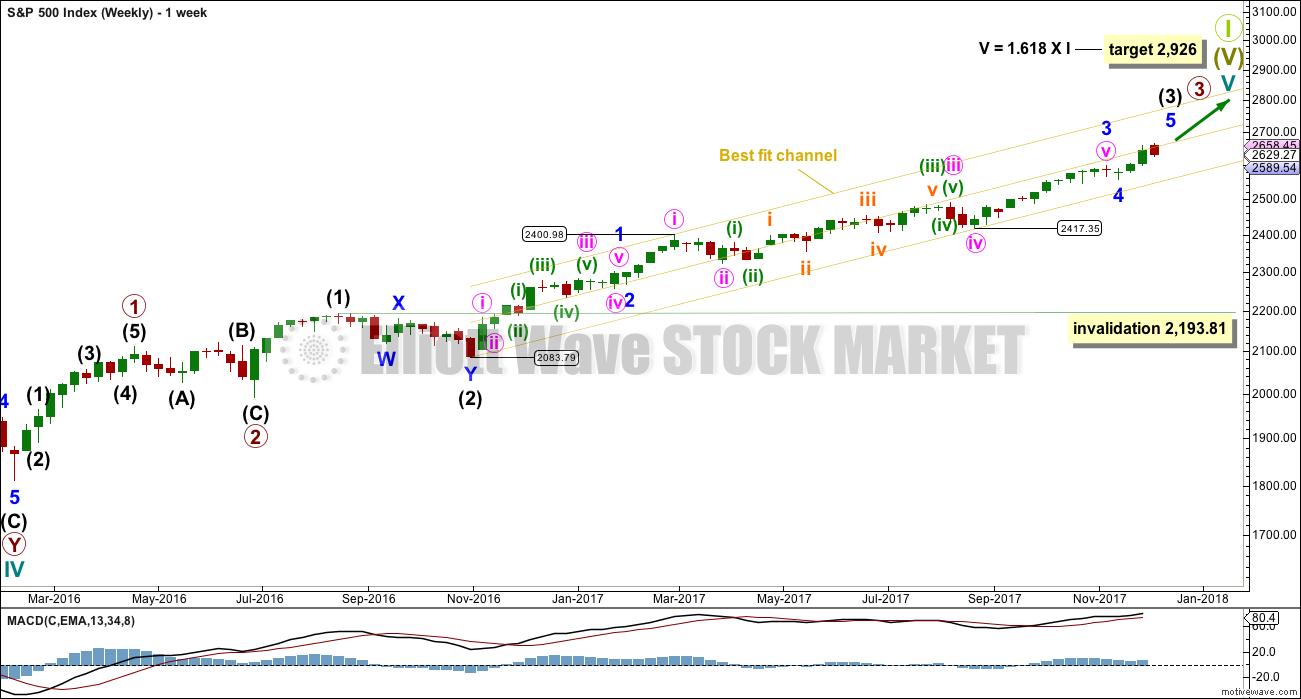
Cycle wave V must complete as a five structure, which should look clear at the weekly chart level. It may only be an impulse or ending diagonal. At this stage, it is clear it is an impulse.
Within cycle wave V, the corrections for primary wave 2 and intermediate wave (2) both show up clearly, both lasting several weeks. The respective corrections for intermediate wave (4) and primary wave 4 should also last several weeks, so that they show up at weekly and monthly time frames. The right proportions between second and fourth wave corrections give a wave count the right look. This wave count expects to see two large multi week corrections coming up, and the first for intermediate wave (4) may now be quite close by.
Cycle wave V has passed equality in length with cycle wave I, which would be the most common Fibonacci ratio for it to have exhibited. The next most common Fibonacci ratio would be 1.618 the length of cycle wave I.
Intermediate wave (3) may now be nearing completion (the alternate hourly wave count looks at the possibility it could be complete at the last high). When it is complete, then intermediate wave (4) should unfold and be proportional to intermediate wave (2). Intermediate wave (4) may be very likely to break out of the yellow best fit channel that contains intermediate wave (3). Intermediate wave (4) may not move into intermediate wave (1) price territory below 2,193.81.
The yellow best fit channel is redrawn. Price points are given so that members may replicate this channel. This channel is copied over to the daily chart.
DAILY CHART
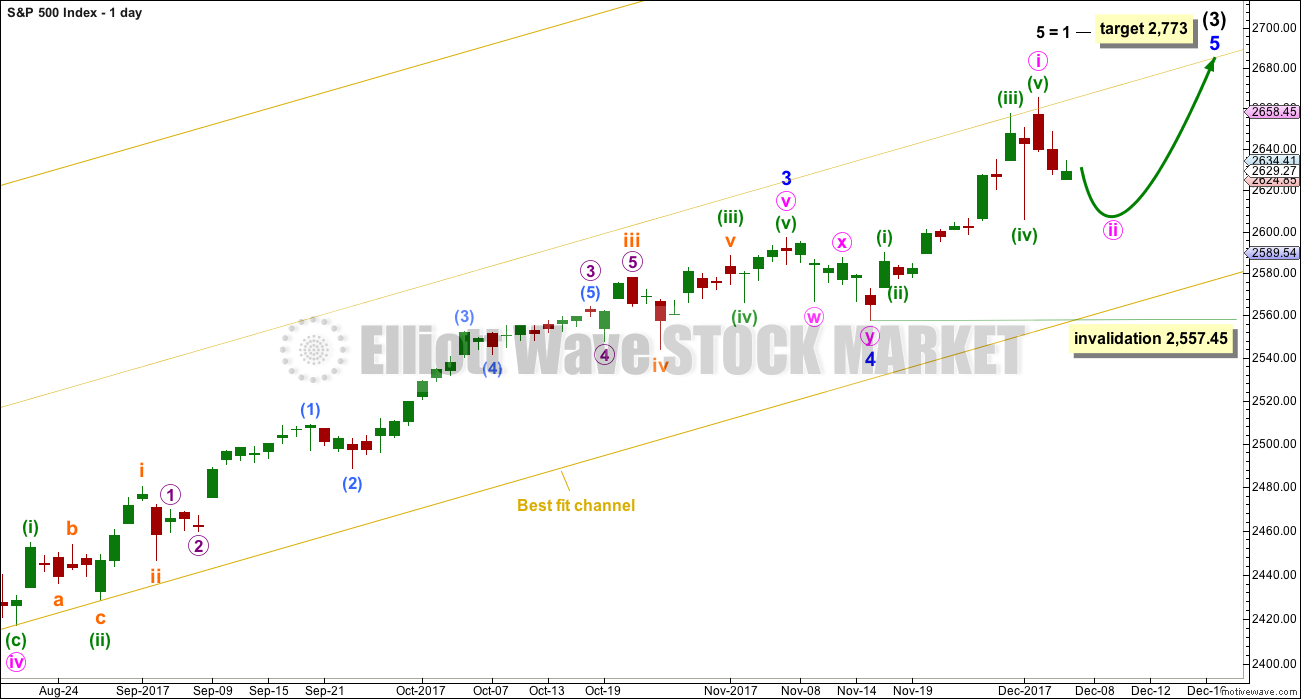
We should always assume the trend remains the same until proven otherwise. Assume that minor wave 5 is incomplete while price remains above 2,557.45.
The target calculated for minor wave 5 expects it to exhibit the most common Fibonacci ratio for a fifth wave. This target would not expect a Fibonacci ratio for intermediate wave (3) to intermediate wave (1).
Within minor wave 5, no second wave correction may move beyond the start of its first wave below 2,557.45.
HOURLY CHART
This first hourly chart follows on from labelling on the daily chart.
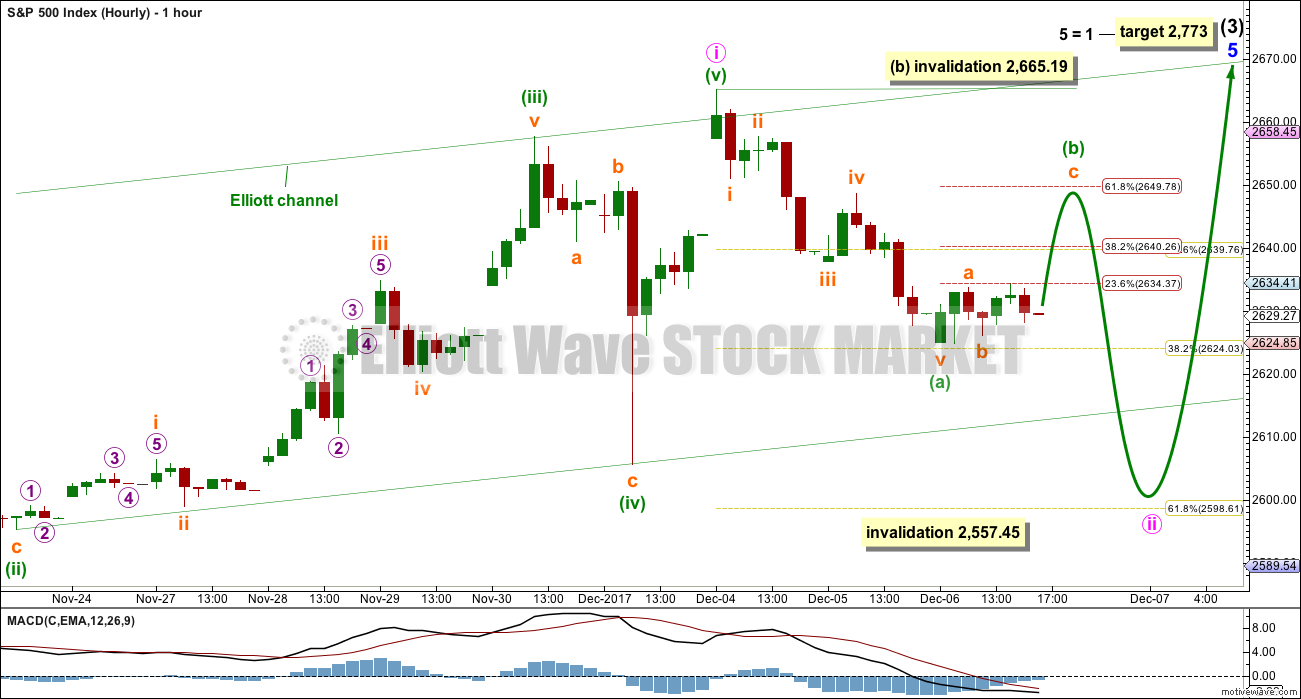
A five up from the low of minor wave 4 is complete. This wave count fits with MACD: the strongest momentum within this five up is the end of the third wave of minuette wave (iii), and within the third wave the strongest portion of the histogram is its middle, subminuette wave iii. At the end of the five up, there is some divergence with price and momentum for the fifth wave of minuette wave (v).
With a five up now compete, a three down should follow. If minor wave 5 is incomplete, then only minute wave i may be over at the last high. Now minute wave ii may take a few days to complete. The most likely point for it to end may be the 0.618 Fibonacci ratio about 2,599, but the 0.382 Fibonacci ratio about 2,624 is also a reasonable target.
There is a five down complete at the hourly chart level. It looks like this is now being followed by a small bounce for minuette wave (b).
Minuette wave (b) may not move beyond the start of minuette wave (a) above 2,665.19. When minuette wave (b) is complete, then another five down should unfold for minuette wave (c).
Minute wave ii looks like it may now end closer to the 0.618 Fibonacci ratio than the 0.382 Fibonacci ratio. It may be subdividing as a simple zigzag.
ALTERNATE HOURLY CHART
Because we should always assume the trend remains the same until proven otherwise, this wave count should be considered an alternate while price has not confirmed it.
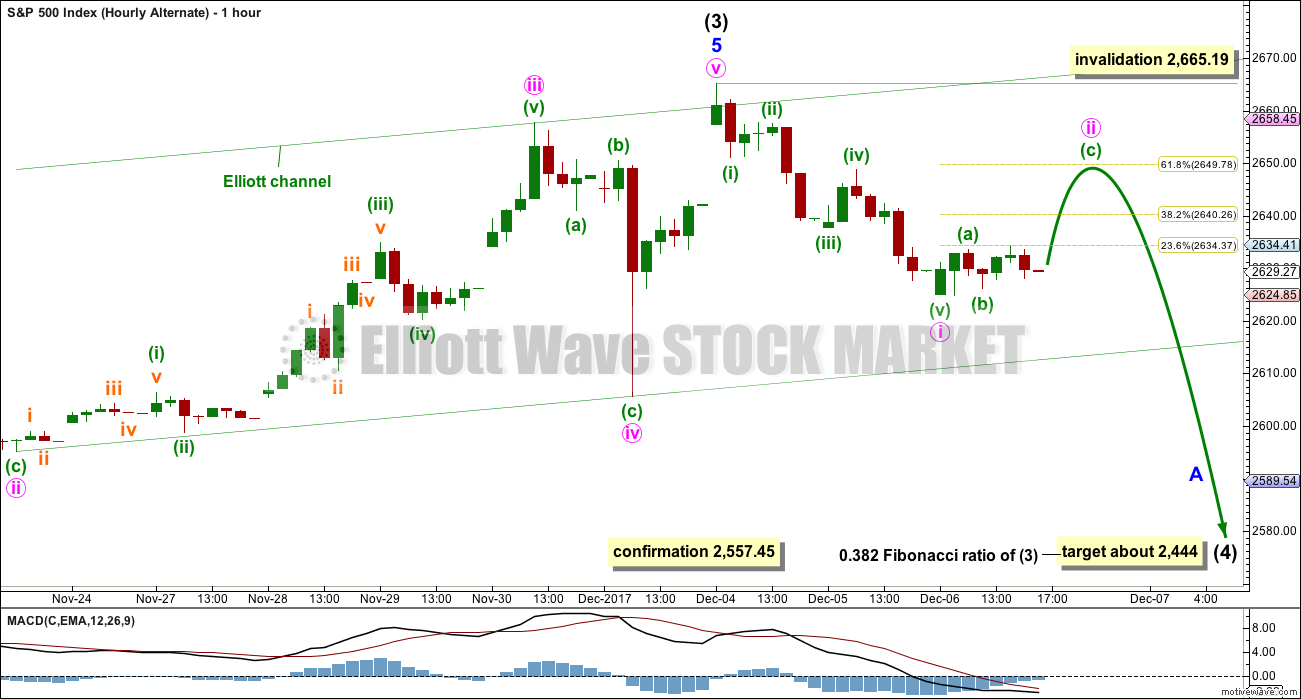
By simply moving the degree of labelling within the five up from the end of minor wave 4 all up one degree, it is possible to see that intermediate wave (3) could be over.
If this wave count is confirmed with a new low below 2,557.45, then it would expect a multi week pullback or consolidation for intermediate wave (4) to last about ten weeks or so. If it is a complicated combination or a triangle, then it may be longer lasting, possibly a Fibonacci thirteen or even twenty-one weeks.
At this early stage, the 0.382 Fibonacci ratio of intermediate wave (3) would be a reasonable target.
For the short term (the next week or so), a trend change at intermediate degree should see a larger five down develop at the hourly chart level. So far only a first wave within that five down may be complete.
Minute wave ii may not move beyond the start of minute wave i above 2,665.19.
Both wave counts expect overall the same direction next.
TECHNICAL ANALYSIS
WEEKLY CHART
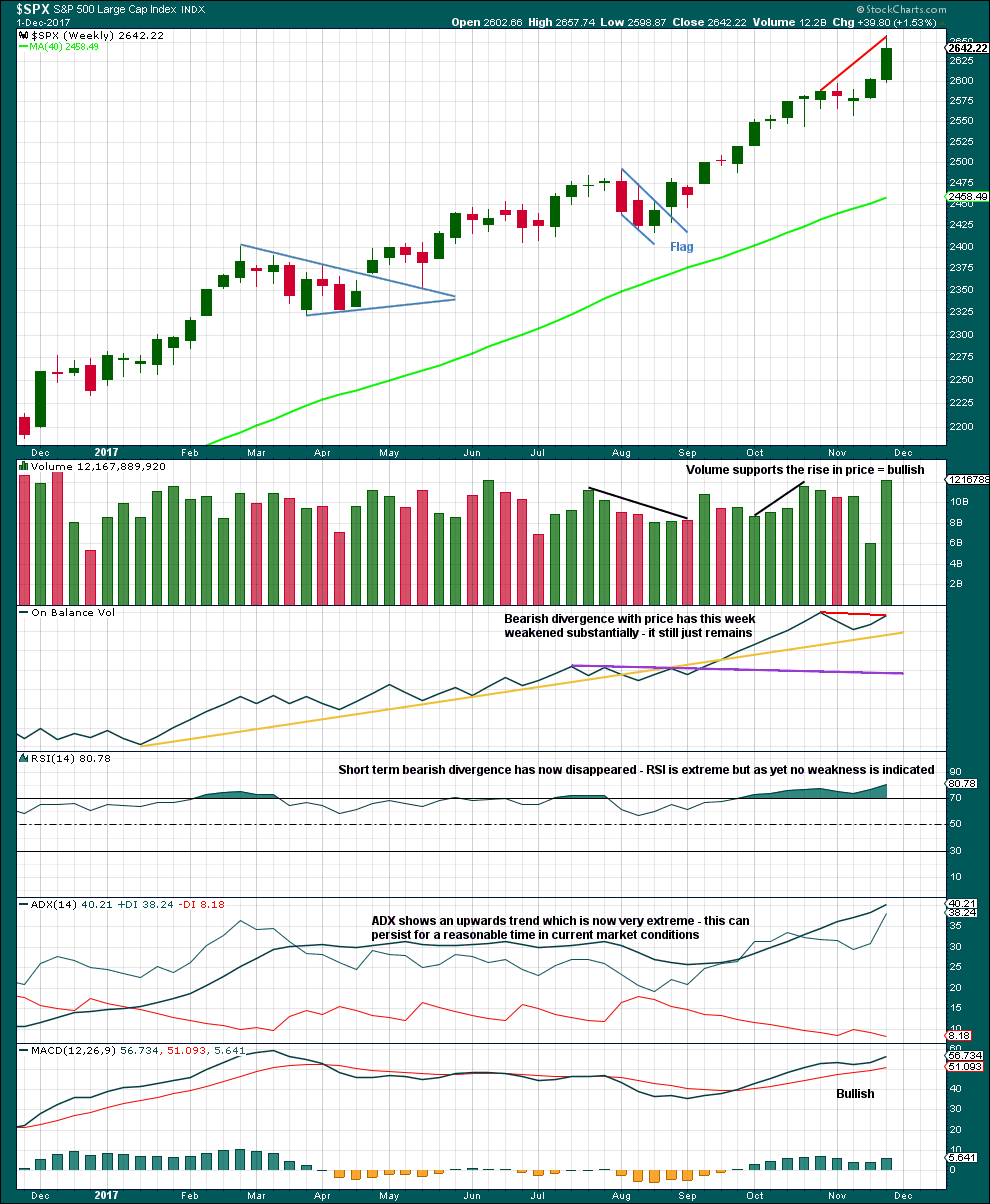
Click chart to enlarge. Chart courtesy of StockCharts.com.
This last week completed the strongest volume for a year, which for an upwards week is very bullish.
The problem with divergence, and one reason why it is hopeless as a timing tool, is that sometimes it just disappears. That is what has happened between divergence with price and RSI. Still, the failure of On Balance Volume to make new all time highs with price is bearish especially if On Balance Volume is a leading indicator.
This trend is extreme, but it could still continue for a while longer. Look for a candlestick reversal pattern or a bearish signal from On Balance Volume.
DAILY CHART
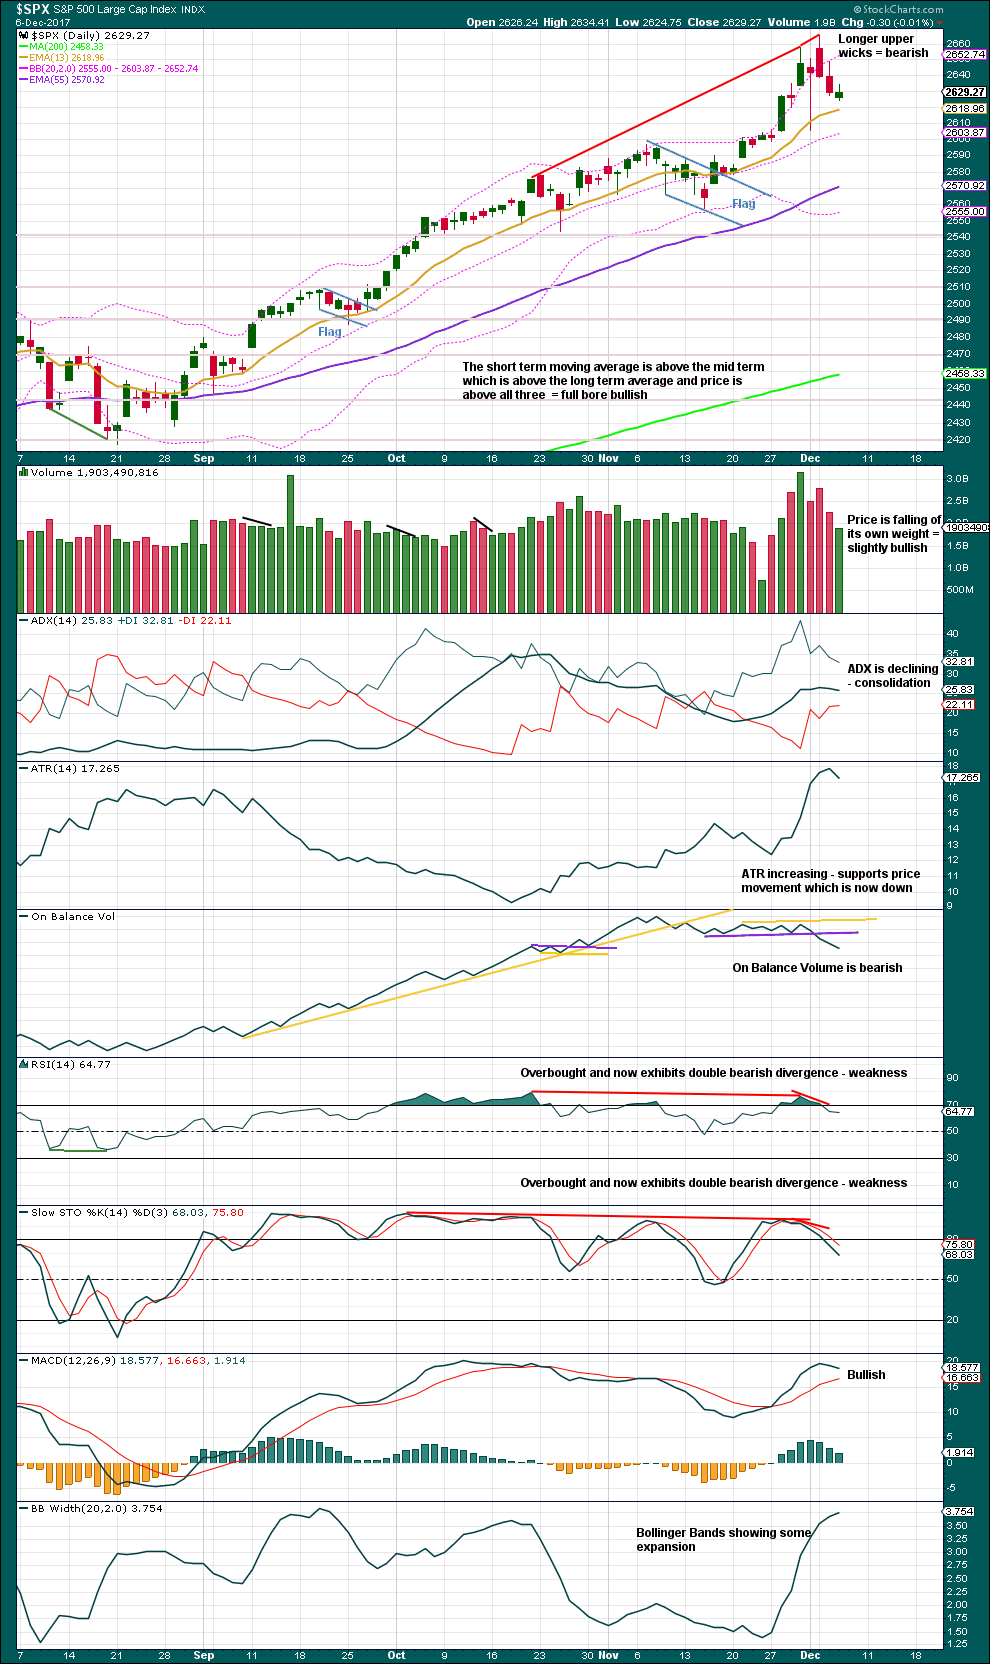
Click chart to enlarge. Chart courtesy of StockCharts.com.
Price can fall of its own weight for some time, and this does tend to happen either early on in a trend or at the end of a trend. An absence of buyers can achieve a fall in price, having the same effect as activity from sellers.
RSI, Stochastics and On Balance Volume are all bearish.
This analysis gives weight to the bearish signal from On Balance Volume. This is exactly the kind of signal which turns up at trend changes of reasonable magnitude. It is looking a little more like a trend change of a reasonable magnitude, and this supports the alternate hourly Elliott wave count.
VOLATILITY – INVERTED VIX CHART
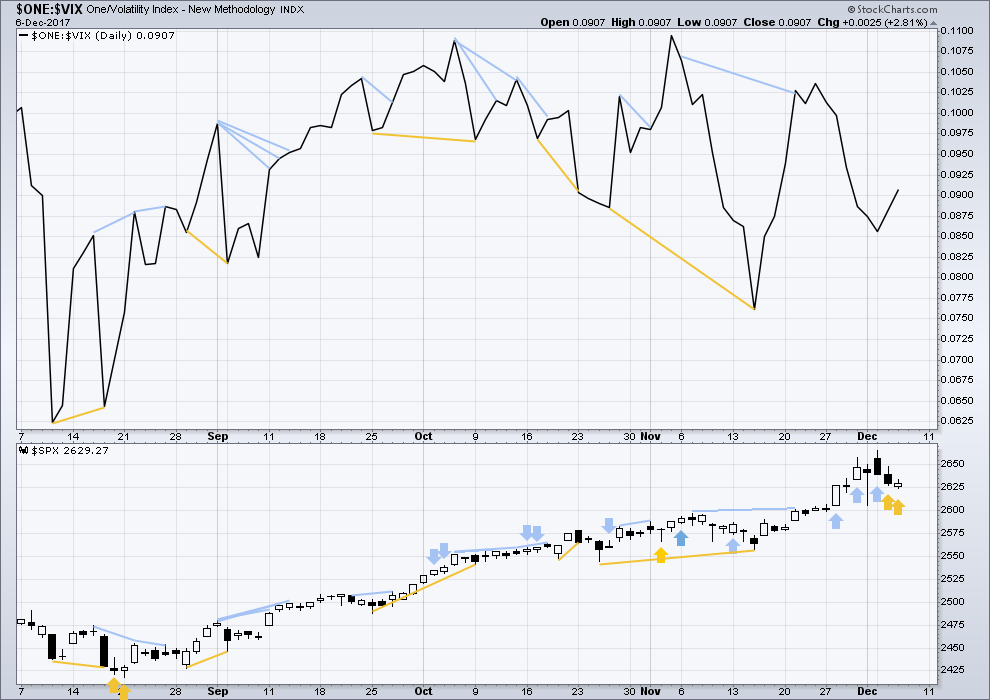
Click chart to enlarge. Chart courtesy of StockCharts.com.
So that colour blind members are included, bearish signals will be noted with blue and bullish signals with yellow.
Normally, volatility should decline as price moves higher and increase as price moves lower. This means that normally inverted VIX should move in the same direction as price.
The bullish signal noted yesterday between price and inverted VIX has been followed by another downwards day. It may have failed, or it may yet be followed by one or two upwards days to resolve it.
Price moved lower and inverted VIX again moved higher today. The fall in price has not come with a normal corresponding increase in market volatility; volatility has declined. This is again interpreted as bullish.
BREADTH – AD LINE
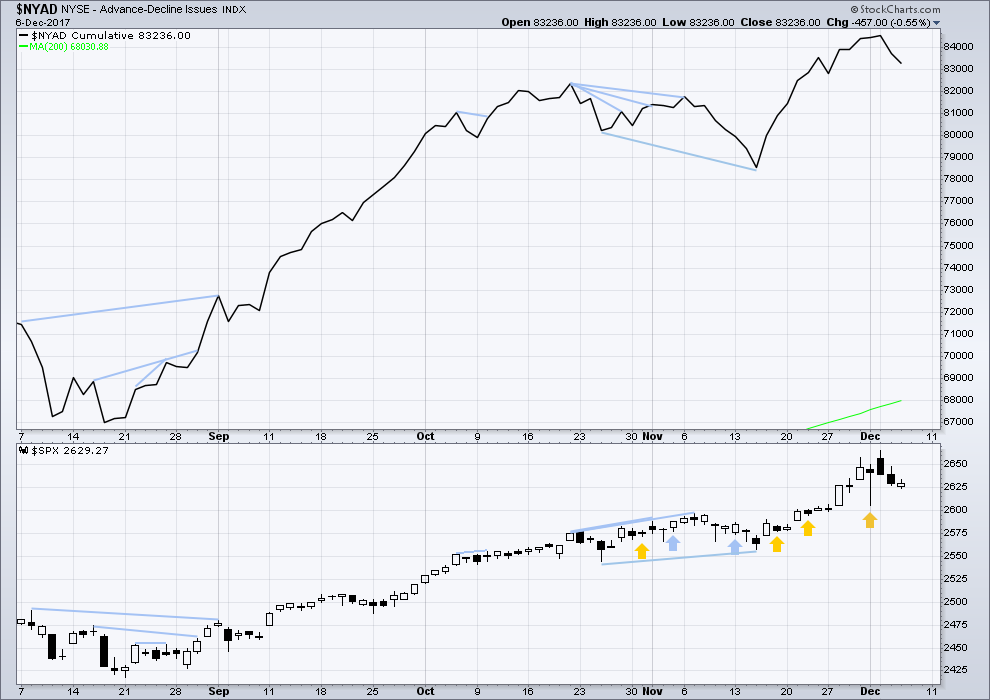
Click chart to enlarge. Chart courtesy of StockCharts.com.
There is normally 4-6 months divergence between price and market breadth prior to a full fledged bear market. This has been so for all major bear markets within the last 90 odd years. With no longer term divergence yet at this point, any decline in price should be expected to be a pullback within an ongoing bull market and not necessarily the start of a bear market.
All of large, mid and small caps last week have made new all time highs. The rise in price has support from market breadth.
The fall in price again comes with a corresponding normal decline in market breadth. The fall in price is supported by a fall in breadth, which is bearish.
DOW THEORY
The DJIA, DJT, S&P500 and Nasdaq have last week made new all time highs. This provides confirmation of the ongoing bull market.
The following lows need to be exceeded for Dow Theory to confirm the end of the bull market and a change to a bear market:
DJIA: 17,883.56.
DJT: 7,029.41.
S&P500: 2,083.79.
Nasdaq: 5,034.41.
Charts showing each prior major swing low used for Dow Theory are here.
Published @ 07:52 p.m. EST.

Lara, I am sorry but I need to correct you. It has to do with your football terminology and use of the word “punt”. Having played American football for many years including 4 years as a starter on varsity at a major US college, and having been a season ticket holder (24 tickets) for the NFL Chicago Bears including the year they won the Super Bowl (1985), this topic is quite important to me.
When a team punts, they free kick the ball downfield to the opposing team thereby changing from offense (trying to score) to defense (attempting to keep the opponents from scoring). Therefore, if a person “punts” on a financial trade, they would be closing out the position after having attempted to score (make money).
I just want to make sure you do not confuse any of your global members especially in the USA. If you need any further instruction on American football (is there really any other kind?), please do not hesitate to contact me. I will gladly give you such instruction free of charge.
Go Seattle Seahawks!
what position did you play Rodney?what school? that is a major accomplishment to play 4 years as a starter,, I bet you are feeling the effects of it as you age,,,I have taken care of many x football players and they feel it,, and I concur,,,, GO SEAHAWKS…
This VIX move has died. Wow, this is really a head scratcher.
No head scratcher Joe and entirely to be expected during the current upward correction..
INCY hammered since March of 2017. AND…it’s just hit it’s 61.8% retrace of it’s Feb ’16 to Mar ’17 upmove!! On lower time frames it’s already giving buy triggers. Might be an opportunity for a positional place with very positive EV and relatively limited risk (barring unforseen giant gaps down, ala CELG a month or two ago!! always a danger trading ANY single equity).
Doing my Super Happy Morning dance today 🙂 🙂
Analysis has been going well, and over at Elliott Wave Gold it’s superb. Along with superb trading advice. This makes me Very Happy.
My Christmas tree is up, the sun is shining… no surf but I’m still stoked. (no spell check, not smoked!)
A bounce upwards is unfolding as expected. For more aggressive and experienced members this may be an opportunity to enter short at it’s conclusion. Target is the 0.618 Fibonacci ratio of the five down, about 2,650, for the bounce to end.
If you wish to take a punt on the short side then please manage risk. I know I sound like a stuck record, but we have a few new members today and so this message is for you.
If you wish to trade this short you’re trading against the larger trend, so there is more risk. Reduce position size until you are rising only 1-3% of equity. It is essential you use a stop. It should be just above the invalidation point, allow for broker spreads, but if price makes a new high exit shorts.
When trading downwards movements within a larger consolidation it is best to take profits more quickly. It’s not as easy as a buy and hold strategy for a bull run.
When minuette (b) is complete then I’ll calculate a target for minuette (c). The first ratio to use would be equality with minuette (a) which was 40.34 points.
Now, while this main count expects only a smaller zigzag down for minute ii, the alternate sees what is happening now as only the early days of a consolidation which may last up to about three months.
I’d lean to the alternate at this time, but I know I should also follow my own advice to “assume the trend remains the same, until proven otherwise”. Proven otherwise means a new low below 2,557.45.
That was an awesome call on the exit from the Gold triangle. I jumped on that baby with all four feet! I just LOVE triangles! 🙂
Took my little short profit already, tyvm!!!
I see gold performed today “as predicted”. I am watching my fibo and symmetry projections for a turn decision closely (not there yet) for a possible long.
Hope the swell rolls in to allow your happy dance to move onto the water!!! I am a HUGE fan BTW of Kassia Meador and her longboarding ability. Ballet in motion over the water, just incredible!
*goes away to watch Kassia Meador on YouTube*
Yeah, she’s really good!
That’s my goal. To surf like that.
I can take one step forward and one back, and 50% of the time I’m still on the board LOL. Getting there…. it’s way harder than it looks!
If you’d like to see “my” break in action, check the youtube footage titled “20151130_Noriega – Raw Footage”. Remind you of Pipeline??? Oh yea!! No, I DO NOT surf it that big!!!! Noriega is my cross street, about a mile up the hill. SF Ocean Beach on days like the one recorded is absolute world class, and very hard core! Just getting outside is a SERIOUS task! Me, I like it about 3-4′ myself!
oh wow, that looks like a really awesome break! lefts and rights! very nice indeed Kevin 🙂
me too, I like it smaller, 2-3 ft best, and 4ft my limit.
Keeping an eye on open DJI gap which seems so far to be proving stout resistance. Quite a bit of capital being expended but the bulls in an attempt to close it.
The ability of NDX to push through it’s major downtrend line today bears careful watching. Should it, along with RUT and SPX breaking back to new highs, I suspect the market could zoom up for a few hours at least.
At the moment, a synchronous downturn in SPX at the 38% fibo, and the NDX at the descending trend line. We’ll see if those hold, and this is it for SPX until the C down plays out. Looks 50-50 to me at this point. On the sidelines…
Fascinating battle in NDX, SPX and INDU at major fibo and trend line resistance. SPX has been knocking on the door headed up for about 2 hours; no answer!!! Now everything seems to be starting down. I’ve taken a little short myself; the EV is good, lots of downside potential and a very close above invalidation/stop point. Lessee what happens here…
TRADERS: Please consider. I’ve been waiting for this set up…and it’s here (though the day isn’t done). I’m long, and will get ALOT MORE long is it holds up.
I’ll add that my confidence on this set up is significantly enhanced by Lara’s recent analysis of RUJ (which is virtually identical to RUT in form). The pullback was a 2 per her analysis, so a 3 is launching.
This leads the cross market question: if RUT is launching a 3, does that cast a more bullish light over SPX, vs. the current view that it needs another significant “C” wave down here? I dunno. I suppose both can be right, but we’ll see.
Short term my RUJ analysis does expect a little more downwards movement so that c moves below a at 1,856.30. This could fit neatly with the EW analysis for the S&P500.
Front page NYTimes business section article on bitcoin, title: “Bitcoin Hasn’t Replaced Cash, but to Investors It’s as Good as Gold”.
One thing to keep in mind about Bitcoin: despite serious questions about it’s ultimate value (let’s face it, all cash is “fiat currency”, and so is Bitcoin, right? However, some cash has reasonable support for it’s value, ala the US$ backed by the US government, though with our new massive growing debt, it’s future value is more and more debatable), the UNDERLYING TECHNOLOGY of the blockchain is unquestionably revolutionary as a means of securely recording transactions, and WILL transform the financial industry over time. Guaranteed. A distributed cryptographically secure ledger is far, far, far superior to a “high walled institution” supposed “securely” holding your money and recording your transactions; witness the billions being stolen every year from banks by various governmentally supported mafias (Russia and NK lead the list).
It looks to me like the ongoing battle to resist the impending trend change is resulting in a more complex corrective wave; some kind of combination perhaps? DJI 24200 a battleground…
Move up today corrective. I think we will next see a minuette C down to finish minute two. We are clearly not in any kind of third wave down. I wonder how the possible shutdown on Friday will affect the markets?
SPX has finally penetrated above the first 23.6% fibo after ranging underneath it for a day+. Upcoming decision points are (roughly):
2640 (38%)
2644.8 (50%)
2649.6 (62%)
Per Lara’s analysis, one of these “should” end the “B” move back up, and initiate the C wave down.
Artificial intelligence just demostrated a QUANTUM LEAP in a capability yesterday.
Googles “DeepMind” AI was given 4 hours (4 hours) to “learn chess”. No opening book, no nothing, just the basic rules, and it played itself for 4 hours.
Then it played the absolute strongest chess engine on the planet, developed over many years, “Stockfish”. 100 games.
Final score: DeepMind wins: 28. Stockfish wins: 0. Draws: 72.
Which is to say, DeepMind crushed Stockfish. After 4 hours of “learning chess”.
The future is not going to be like today, folks. This kind of technology is in another realm, and we can hardly conceive of it’s uses, and it’s impacts over time.
Incredible! No wonder Putin said the country that first masters AI will rule the world!
Or…will the first AI’s to be widely deployed rule the world, themselves? What might be the future of countries, in such a world? “Oh tiiiimes, they arrrrre, a chaaaangin’!!!”
Watch out for “Sky Net” of the Terminator series.
I’ll be back.
In fact, that raises the extremely serious question: how will such incredible “brain power” be used? My concern: to much more fully develop the corporate police state. In Beijing for example, there is facial recognition all over the city. I expect the same in all major US cities within 5 years. When you combine data from all sources and feed it to extremely powerful AI’s, you get “insights” that essentially mean all privacy is gone, AND that enables you to be targetted in many many ways (not just for advertising, but for far more subtle manipulation, setups, you name it). It’s a corporate gangsters dream. This technology will be “weaponized” by the corporates to separate us from our wealth, sure as the sun rises every day. It will be “weaponized” by the government to “protect us” (lol!!!) sure as the sun sets every day. It’s not going to be a pleasant future, in my estimation.
Interesting you say that Rodney. Today there are lots of comments about how indeed the Google building resembles the Skynet building in Terminator 3!!! Hilarious…sort of.
This is worthy of a read, we are watching a new era unfold, for better or worse!
Double bottom hits just above a major 50% retrace fibo and now a solid push up give a strong indication of trend change back to “up” in the RUT this morning.
One analogy for what just happened: DeepMind was shown a giant pile of metal parts. It studied them for 4 hours. Then it built a Ferrari from them.
Small correction: the name of the AI is “AlphaZero”, the research group itself is called “DeepMind”.
Adding to my VIX 10.00 strike calls. Thank you!! 🙂
My how they are thrashing around this morning! I guess it’s time to sell the rip…
US markets are probably approaching the limits of CB liquidity being sufficient to keep them elevated. I think a bargain has been struck to bring offshore profits back to the US so they can be used to continue share buybacks and pay fatter dividends and bonuses. Very little of that money is going to do what they are claiming it will I am afraid…
IT will not go to Stock Buy Backs and dividends!
IT will go to investment in the USA that can be 100% expensed and eventually grow the top line!
I know nobody here believes me… but that is where it will go.
Joe I know you were very confident that the FED would be true to their word and begin unwinding their balance sheet. Remember that?
Have you taken at look at their balance sheet lately? I would direct you to the matter of the MBS holdings. You cannot trust anything these people tell you. In fact it is generally not a bad idea to expect them to do the EXACT opposite!
The fact of the matter is that they are hopelessly trapped, and have no choice but to continue the present course until the entire thing implodes, at which point we will have the great reset and all that that implies….. 🙂
Watching VIX this morning 20 min Chart… 7:40 and 8:00AM candle sticks were manipulated.
At the last 3 seconds of 7:40 AM stick a green stick hammer was drawn to turn to what you see and the 8:AM gapped up and way down the 1st second of trading.
They are trying to hide Bullish movement of the VIX. + right before the close of 8AM they tried to paint that stick all red… but it failed and you now have what you see.
Very Interesting… watch it live if you can.
I witnessed their tricks. BUY BUY BUY VIX!
Look how they are trying to manipulate these VIX candle sticks on 20 min chart. They are still doing it.
Amazing!
This is going to be a very interesting day at least that’s what looks to be unfolding at the moment.
Still trying hard to paint the 8:20 stick all red!
There is a reason they call it the “fear gsuge”. It is probably the most important metric in the markets to watch right now for all the reasons we have been discussing. There was a hurculean effort to ramp futures higher overnight that fell flat…literally! Today should be revealing. I was a WUS and sold my DIA puts yesterday…charts don’t lie…usually! 🙂
It’s great that more are bearing witness. I hope that they get exposed soon.
Yep. I have long wondered about people that smugly dismiss the idea of market manipulation. It seems to me impossible NOT to see it. Unless of course you are not paying any attention…or you are completely blind! 🙂
Another thing….At some point the crowd is going to recognize the remarkable situation in vol and the pendulum is going to swing to the other extreme…unprecedented FEAR…
For the time being, I would continue to respect the 14.00 pivot and take profits each time we approach it. The key thing to look for is a gap through it, which will signal they have lost control, at least in the short term. A gap past 14.00 means a run to 17.00 and above is very likely….
They are STILL shorting futures!!!
Only have small position and judging by the number of emails in my spam folder this week about BitCoin the euphoria is here to inflate a massive bubble
Or such euphoria points to an immediately impending correction. Wave analysis indicates a very large 4 wave due in BC, I believe, taking price back down below 10000.
Taken my profit today! Quite happy to make some money and come back when the time is right
ES in some kind of fourth wave so we should get a fifth wave down there. Not sure how this lines up with the cash session but we should see another move down there as well to complete either a minute two or minute three per the analysis. A move by VIX above the upper B band with a long upper wick would favor the first scenario ahead of resumption of the move up to complete minor five. A full VIX candle with B band expansion to contain price I think would favor the count that sees an intermediate four underway.
Where have you been Doc?
golphin
🙂