Price is behaving mostly as the new main Elliott wave count expects.
Targets remain the same. The AD line gives an important signal today, which will be given weight in the analysis.
Summary: The first Elliott wave target is again at 2,614. A target using the measured rule is 2,634. The second Elliott wave target is 2,773. As price approaches each target, if the structure is incomplete and there is no weakness in price, then the next target will be used. But if price approaches a target and the structure is complete and there is some classic weakness, then a high may be in place.
A bullish signal from the AD line today suggests a green daily candlestick tomorrow.
Always trade with stops and invest only 1-5% of equity on any one trade. All trades should stick with the trend. The trend remains up.
Last monthly and weekly charts are here. Last historic analysis video is here.
MAIN ELLIOTT WAVE COUNT
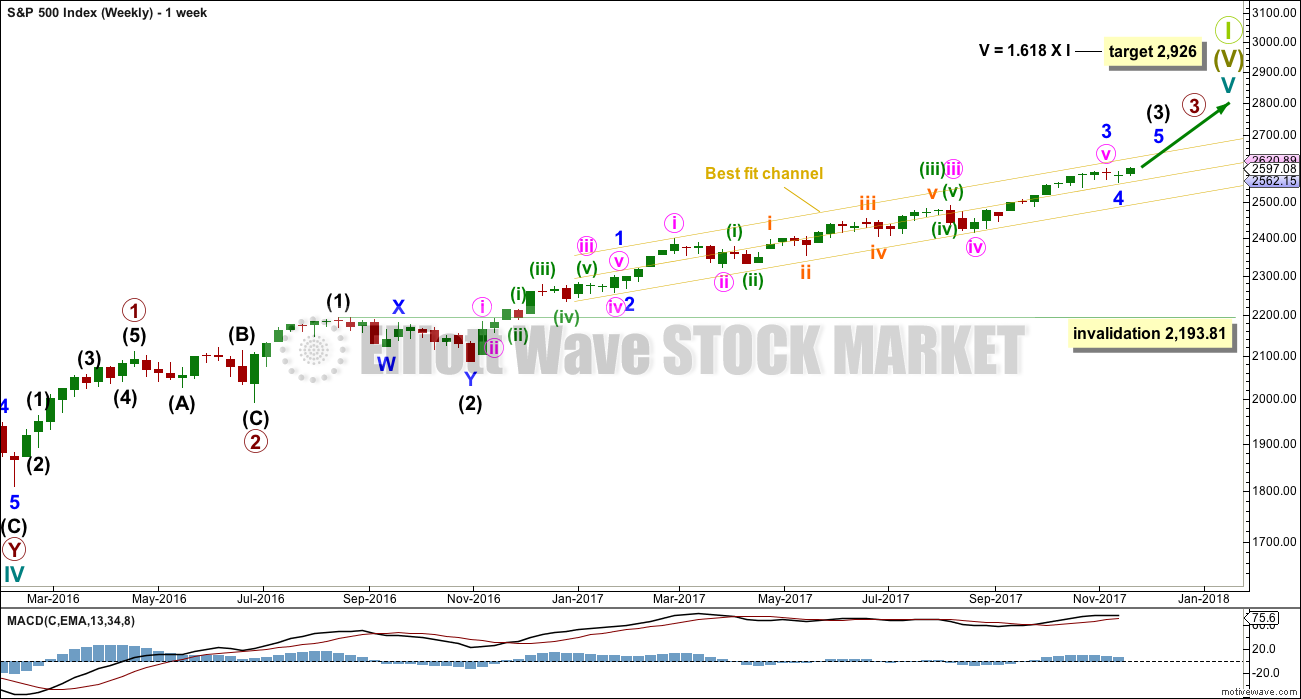
WEEKLY CHART
Cycle wave V must complete as a five structure, which should look clear at the weekly chart level. It may only be an impulse or ending diagonal. At this stage, it is clear it is an impulse.
Within cycle wave V, the corrections for primary wave 2 and intermediate wave (2) both show up clearly, both lasting several weeks. The respective corrections for intermediate wave (4) and primary wave 4 should also last several weeks, so that they show up at weekly and monthly time frames. The right proportions between second and fourth wave corrections give a wave count the right look.
Cycle wave V has passed equality in length with cycle wave I, which would be the most common Fibonacci ratio for it to have exhibited. The next most common Fibonacci ratio would be 1.618 the length of cycle wave I.
Intermediate wave (3) may now be nearing completion. When it is complete, then intermediate wave (4) should unfold and be proportional to intermediate wave (2). Intermediate wave (4) may be very likely to break out of the yellow best fit channel that contains intermediate wave (3). Intermediate wave (4) may not move into intermediate wave (1) price territory below 2,193.81.
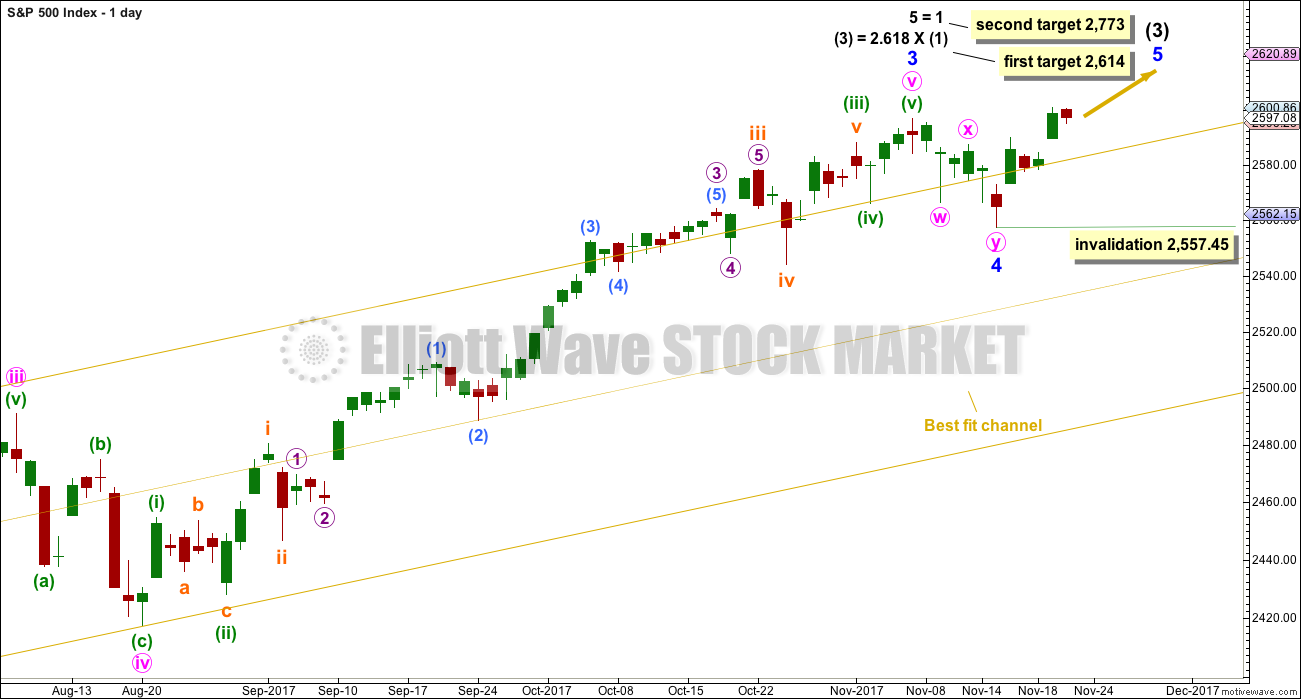
DAILY CHART
Minor wave 4 may now be complete. It will subdivide very well as a double zigzag. This provides only a little alternation in structure with the single zigzag of minor wave 2. There is also poor alternation in depth: minor wave 2 was very shallow at only 0.16 of minor wave 1, and minor wave 4 would be only 0.12 of minor wave 3. Alternation is a guideline and not a rule; it is seen more often than not, but not always.
The first target at 2,614 would see a Fibonacci ratio between intermediate waves (3) and (1), but no Fibonacci ratio for minor wave 5. This would be acceptable. There is already a somewhat reasonable Fibonacci ratio between the two actionary waves of minor waves 3 and 1, so minor wave 5 may not exhibit a Fibonacci ratio to either of minor waves 3 or 1.
The second target calculated for minor wave 5 expects it to exhibit the most common Fibonacci ratio for a fifth wave. This target would not expect a Fibonacci ratio for intermediate wave (3) to intermediate wave (1).
If price gets up to the first target, and the structure may be complete and there is some divergence with price and Stochastics or RSI, then members are warned that it would be possible for a high to be in place for the mid term. But if price keeps rising through the first target, then the second target would be used.
Within minor wave 5, no second wave correction may move beyond the start of its first wave below 2,557.45.
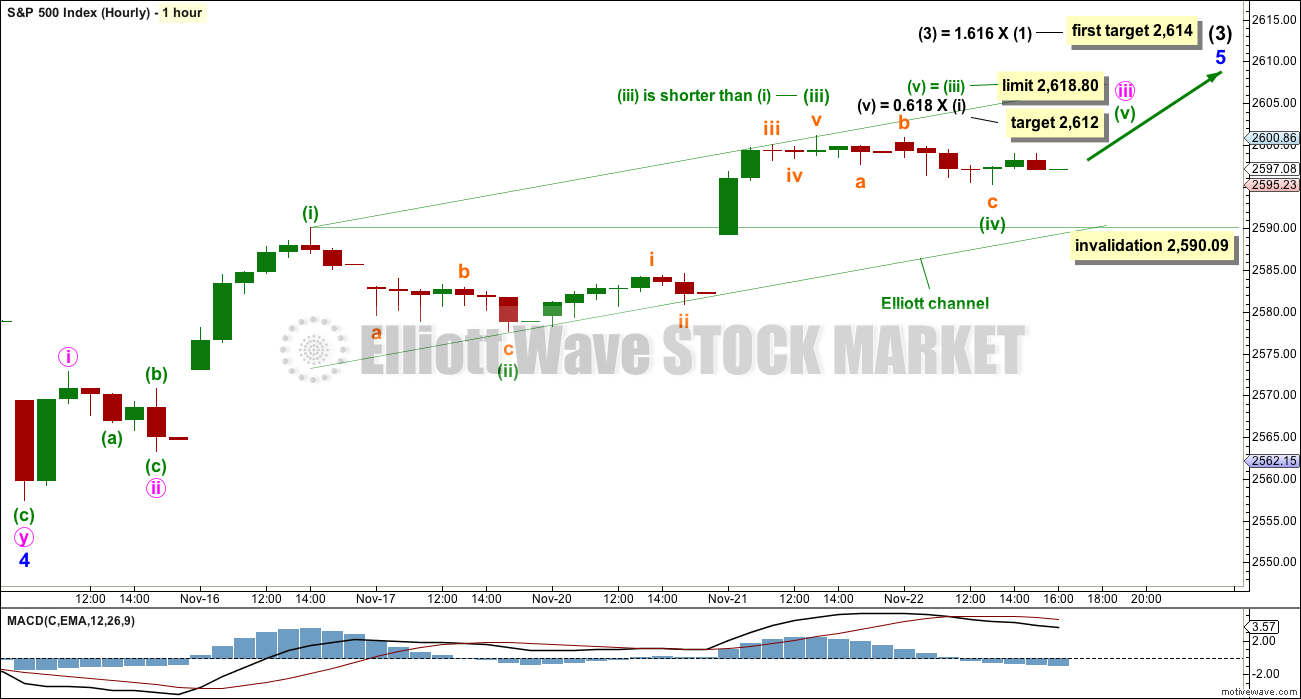
HOURLY CHART
This wave count would fit very neatly with the first Elliott wave target at 2,614.
Within minor wave 5, it may be that minute wave iii is developing as a very long extension. This is typical behaviour for the S&P.
Minute wave iii may only subdivide as an impulse. Within minute wave iii, minuette waves (ii) and (iv) should be clear; here, they are. Minuette waves (ii) and (iv) are now almost even in duration after some more downwards movement for this last session. The wave count now has a better look. A target is calculated for minuette wave (v) to complete minute wave iii tomorrow or very soon after.
Minuette wave (v) is limited in length, so that minuette wave (iii) is not the shortest actionary wave within the impulse and the core Elliott wave rule is met.
Minuette wave (iv) may not move into minuette wave (i) price territory.
This wave count expects overall upwards movement for another few days. If minor wave 5 exhibits a Fibonacci duration, then it may continue for another three days to total a Fibonacci eight. Along the way up, minute wave iv should show up as at least one red daily candlestick or doji at the daily chart level.
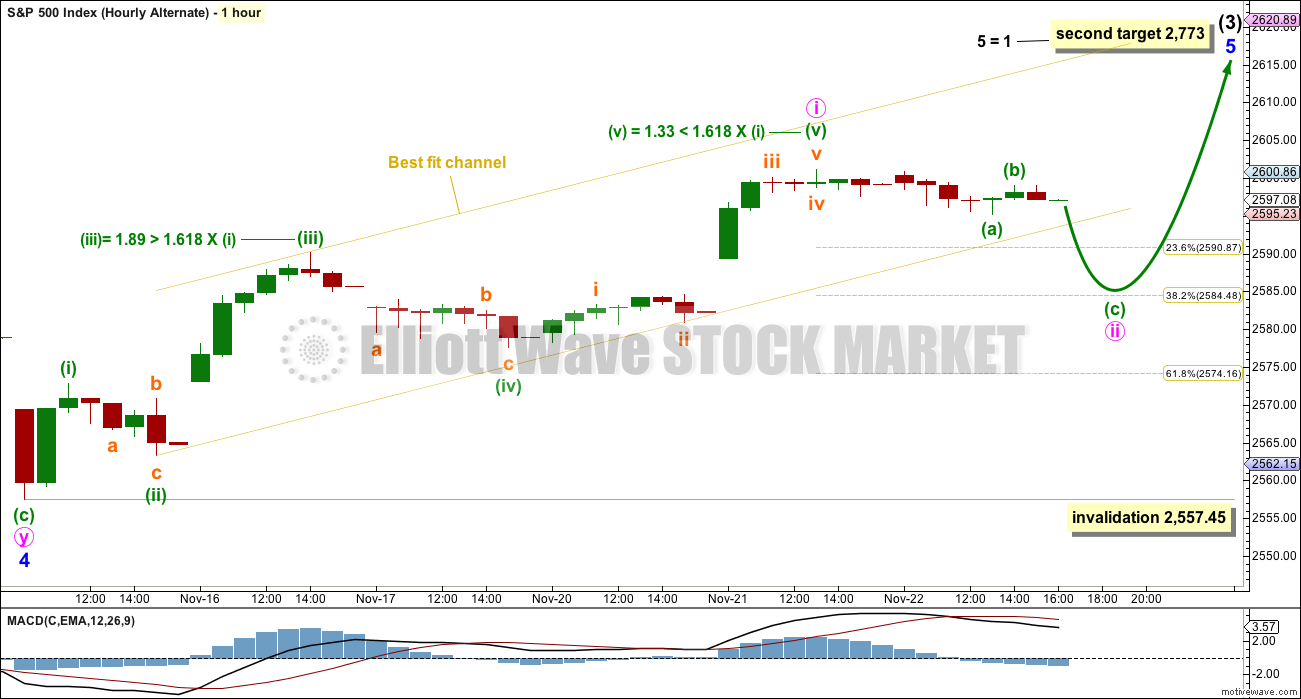
ALTERNATE HOURLY CHART
A five up may be complete. This may only be minute wave i within minor wave 5.
This wave count would now expect a pullback for minute wave ii.
Minute wave ii may end about either the 0.382 or 0.618 Fibonacci ratios. The first small second wave correction for the S&P is sometimes shallow, and that is why I have put the label for minute wave ii closer to the 0.382 Fibonacci ratio. Members should be aware of this possibility.
The next target for this alternate wave count, at 2,773, has a better fit.
It is of course possible to move the degree of labelling within minute wave i all up one degree to see minor wave 5 complete at the last high; if so, then the entirety of intermediate wave (3) could be complete. This idea would be published if price makes a new low below 2,557.45, or On Balance Volume gives a clear and strong bearish signal.
TECHNICAL ANALYSIS
WEEKLY CHART
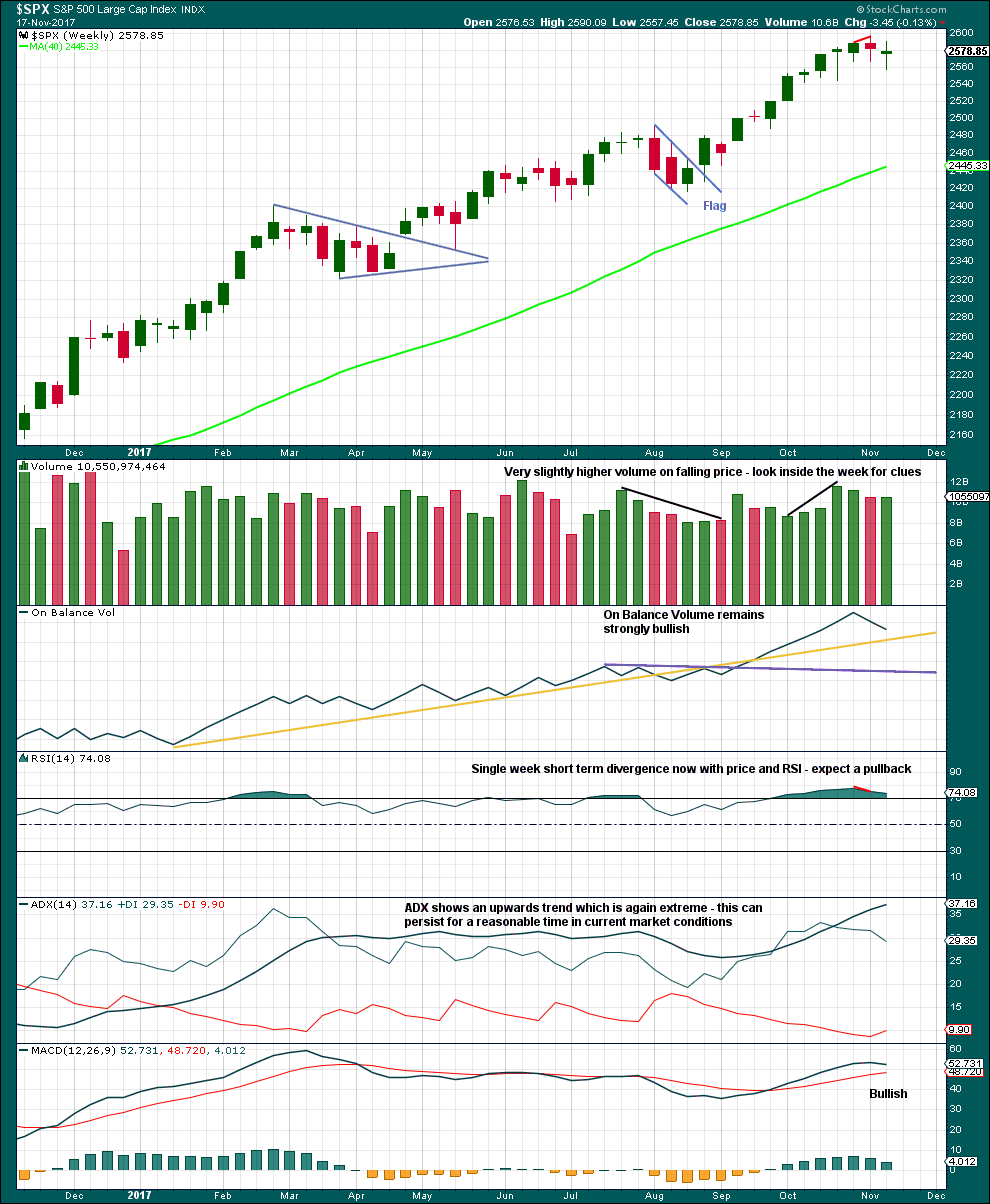
Click chart to enlarge. Chart courtesy of StockCharts.com.
A small range, downwards week completes as a small doji. This indicates a balance of bulls and bears and indecision. At this stage, this small week does not look like a convincing beginning of a new downwards trend, and looks much more like a small pullback within an ongoing upwards trend that should be used as another opportunity to join the trend.
There is a little distance below before On Balance Volume finds support. It is entirely possible that the pullback is not over.
DAILY CHART
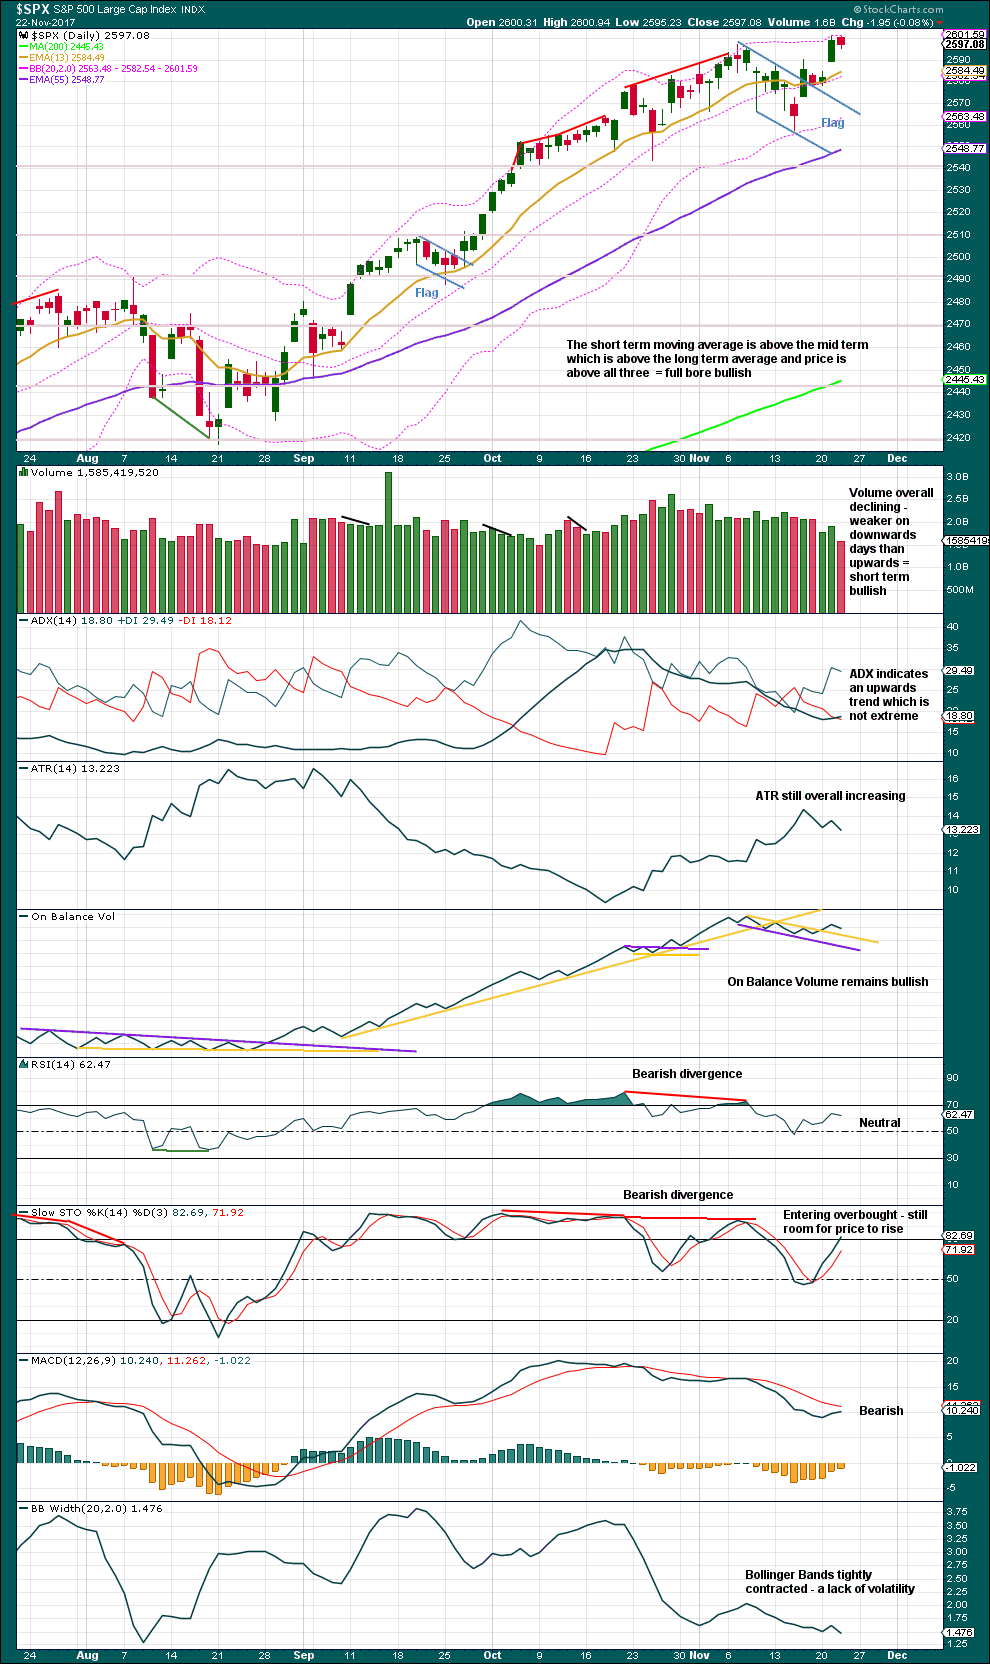
Click chart to enlarge. Chart courtesy of StockCharts.com.
Fifth waves often exhibit some weakness towards their end. Here, tightly contracted Bollinger Bands indicate a lack of volatility in the market. Overall, declining volume for the last several sessions also looks fairly typical for a fifth wave.
Remaining comments are on the chart. Volume indicates an upwards day tomorrow.
VOLATILITY – INVERTED VIX CHART
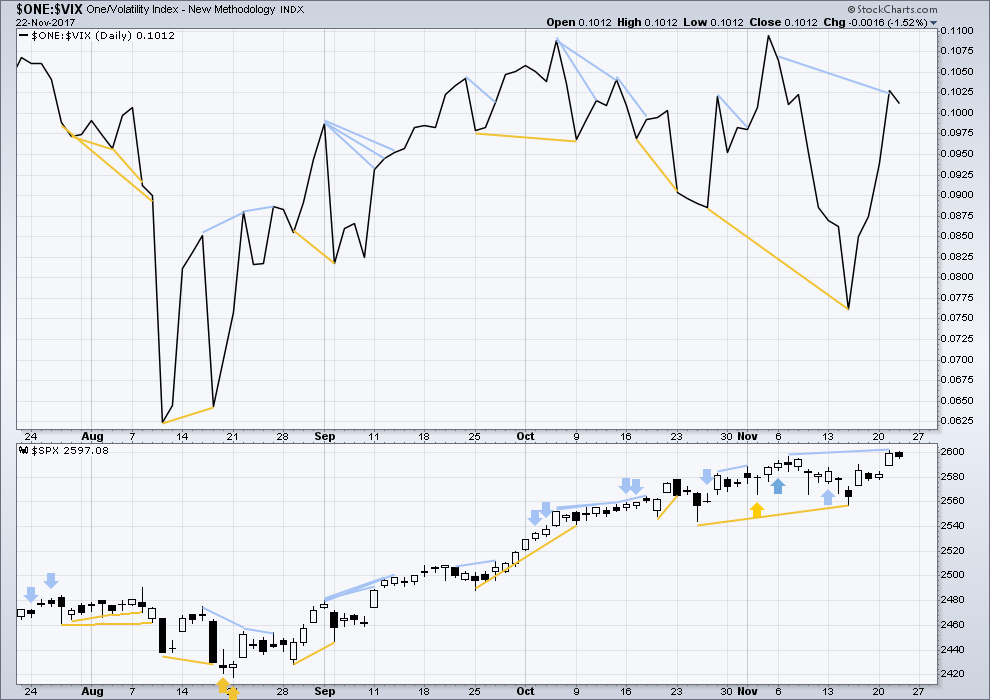
Click chart to enlarge. Chart courtesy of StockCharts.com.
So that colour blind members are included, bearish signals will be noted with blue and bullish signals with yellow.
Normally, volatility should decline as price moves higher and increase as price moves lower. This means that normally inverted VIX should move in the same direction as price.
There was regular bearish divergence yesterday between price and inverted VIX: price made a higher high, but inverted VIX did not. This indicated underlying weakness. This has now been followed by one red daily candlestick. It may now be resolved, or it may need another downwards day to resolve it.
BREADTH – AD LINE
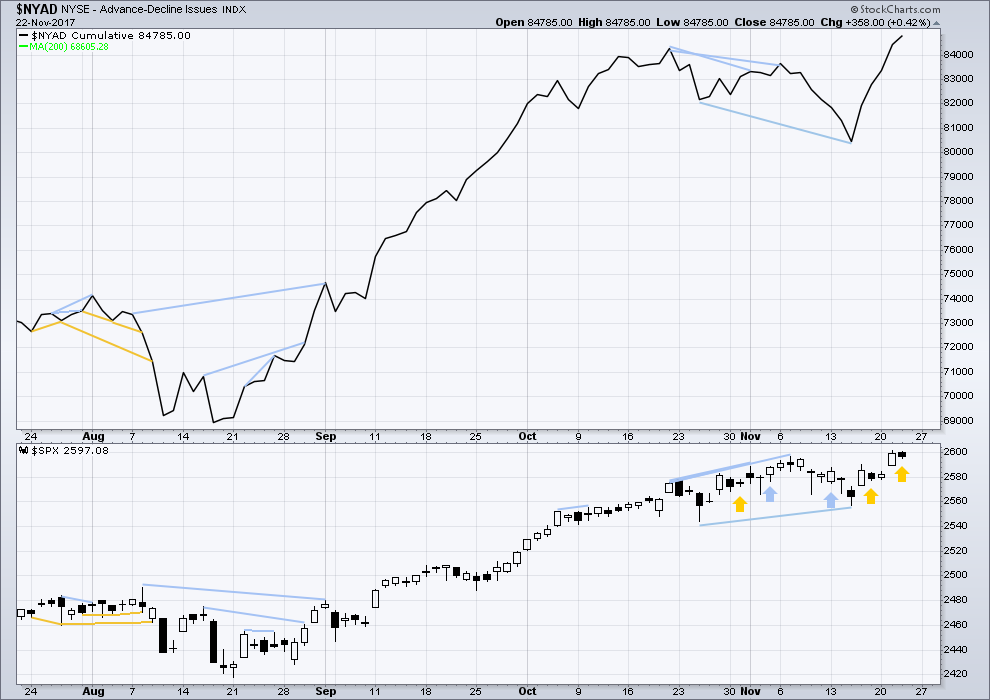
Click chart to enlarge. Chart courtesy of StockCharts.com.
There is normally 4-6 months divergence between price and market breadth prior to a full fledged bear market. This has been so for all major bear markets within the last 90 odd years. With no longer term divergence yet at this point, any decline in price should be expected to be a pullback within an ongoing bull market and not necessarily the start of a bear market.
Mid and large caps last week moved lower, but small caps moved up to make a high above the prior week. Small caps are strongest and may be leading the market at this time.
The AD line has moved higher today to make another new high, but price has not. As the AD line should be read as a leading indicator, this is bullish for price; it looks like price may move higher tomorrow. This supports the main hourly Elliott wave count.
DOW THEORY
Only Nasdaq has made a new all time high this week. The S&P500, DJIA and DJT have not yet made new all time highs.
Failure to confirm an ongoing bull market should absolutely not be read as the end of a bull market. For that, Dow Theory would have to confirm new lows.
The following lows need to be exceeded for Dow Theory to confirm the end of the bull market and a change to a bear market:
DJIA: 17,883.56.
DJT: 7,029.41.
S&P500: 2,083.79.
Nasdaq: 5,034.41.
Charts showing each prior major swing low used for Dow Theory are here.
Published @ 10:33 p.m. EST.

Yikes! I just saw that spike down in VIX before I posted earlier. For some reason, when I started posting I thought today was Thursday and had to edit my post…lol! 🙂
A new 52 week low is YUGE…!
Zero Hedge reporting some rumblings in the Chinese bond market. Bonds represent the arena in which I have long contended the trouble will begin. The banksters can play all kinds of games in the equities markets. When it comes to bonds, they are like a 7 foot row boat in a Cat. 5 hurricane. The trouble will probably begin overseas, and so we will see the red flag in futures. I have a sneaking suspicion that just as we have seen VIX and markets fall in tandem recently, the opposite will happen just before all hell breaks loose, with VIX shooting higher even before the market breaks as the smart money gets positioned early. Nothing new under the sun. All the complacent, clueless, and sleepy market participants will soon be learning a very important lesson -the emotion far more powerful than greed…is FEAR…!
I am sure Lara will continue to keep us ahead of the crowd with her world class analysis! 🙂
http://www.zerohedge.com/news/2017-11-23/china-deleveraging-shifts-corporate-bonds-cascade-effect-begins
Cheers Verne 🙂
I watch Chris Ciovacco’s videos occasionally (really I should watch them all, as I often learn something new each time) and I find it kinda grounds me within solid technical analysis.
Taking his simple logical approach in conjunction with Lowry’s, this market remains pretty bullish.
But now some indicators are quite extreme and exhibiting some weakness. I think intermediate (4) is approaching.
My job, which I’m closely focussed on for the next wee while, is to figure out when it’s arrived. I’ll use EW and alternates, as many as I can see, to find the price points which may tell us convincingly when intermediate (4) is here.
I’ll not be able to pick the high for intermediate (3), but my target may get close.
Pound the table buy on VIX!
At 9.77 … 12:17PM ET
Bgt Jan 16 strike 10 calls. We’ll see…but seems like a reasonably +EV bet with an intermediate 4 looming right around the corner.
Maybe but best to wait for next week as sales numbers from this weekend are going to be out and the markets will lead us to the path that will unfold in the short term.
Report, less people shopping on black Friday! Volume down!
No surprise there. The consumer is tapped out. I have been curious about all the talk regarding consume optimism as indicated my the Michigan Sentiment Index. What good is optimism if your credit cards are all maxed out? To be honest, I thought they would fudge the sales numbers in an attempt to keep a smile on the face of consumers. The data already predicted what this year’s sales outcome would look like.
I am not sure if the traditional shopping numbers are as critical as cyber shopping given the shopping trend changed to online buying. I hardly go to stores these days as most of my shopping is online. I am waiting for now as premium on VIX and UVXY decays too fast for my taste and risk appetite.
Yep. Give yourself at least 30 days out if buying calls as we could see one final spike lower ahead of an interim top. Outright VXX shares should return some nice coin in the next few weeks. If the pattern continues, today should be a low… 🙂
Happy Holidays US folks; gee, 12 hours later and I’m still STUFFED. My 18 year old (boy) roasted the perfect turkey and gravy and stuffing even with Mom absent, and we ate like Kings!
Looks likes the final little 4 should be starting probably Monday since this is a short session. And this 5->4->5 has to all finish below 2618. I’m in GS for a day trade and added HAL for a positional trade, also in ERX. Took my XIV profit when it sat right at it’s opening price even as SPX shot up; I’ll buy back in on the upcoming 4. Next week just might start us into the significant white water fast approaching that frankly is going to come and go over and over for what, a few years? I think so!! Opportunity and risk, opportunity and risk, oh joy!!
A very happy Thanks Giving to you all in the USA (and those USA folks outside of your country too).
NY is closed today for Thanks Giving, so no new data to analyse.
Next analysis will be tomorrow.
Happy Thanksgiving to all!
Enjoy the time with friends and family!
Two in a row and I’m good to go!
Happy Thanksgiving to all especially my USA friends.
In second place,
With Turkey on my face, Doc!
Happy Thanksgiving All!