The upwards trend continues overall, and classic technical analysis remains very bullish.
Members are advised to go with the trend until price proves it is over.
Summary: The Elliott wave target is at 2,616 and a target from a small pennant pattern is 2,617. The upwards trend has support from very bullish On Balance Volume.
Assume the trend remains the same until proven otherwise. The trend is up.
If price breaks below the green Elliott channel on the hourly charts, then expect a multi day pullback or consolidation is underway.
Pullbacks and consolidations at their conclusions offer opportunities to join the upwards trend.
Always trade with stops and invest only 1-5% of equity on any one trade.
Last monthly and weekly charts are here. Last historic analysis video is here.
MAIN ELLIOTT WAVE COUNT
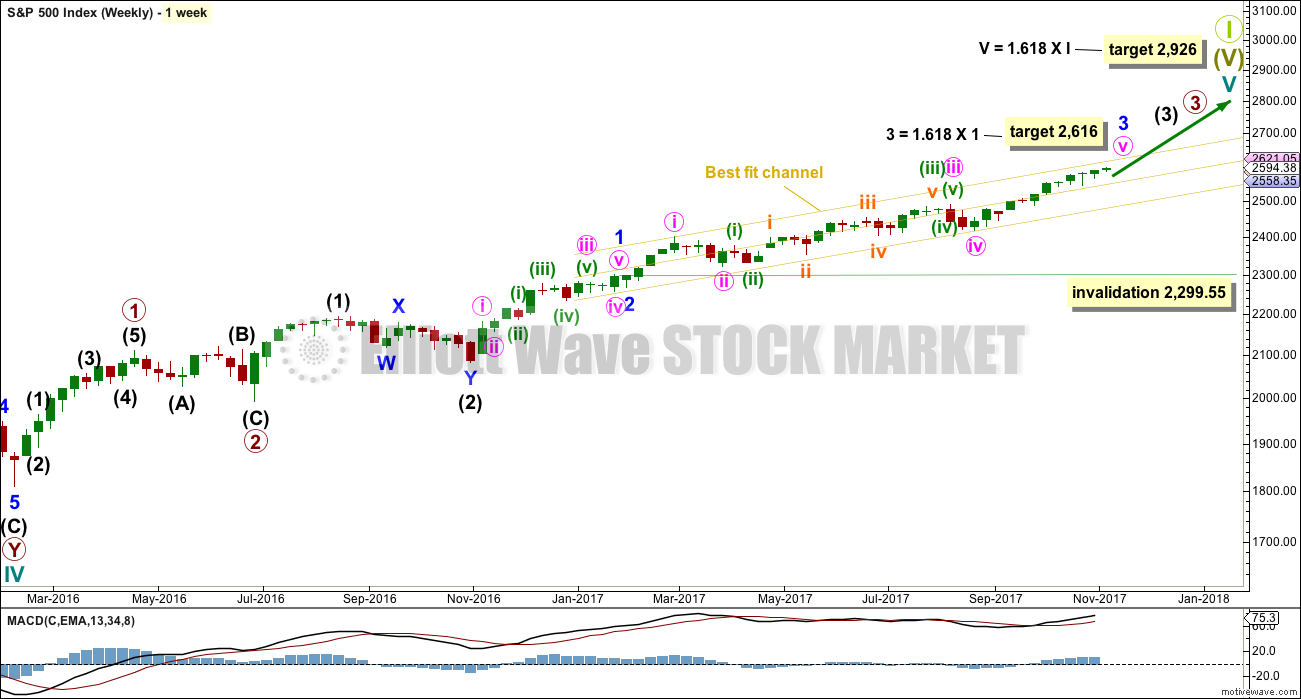
WEEKLY CHART
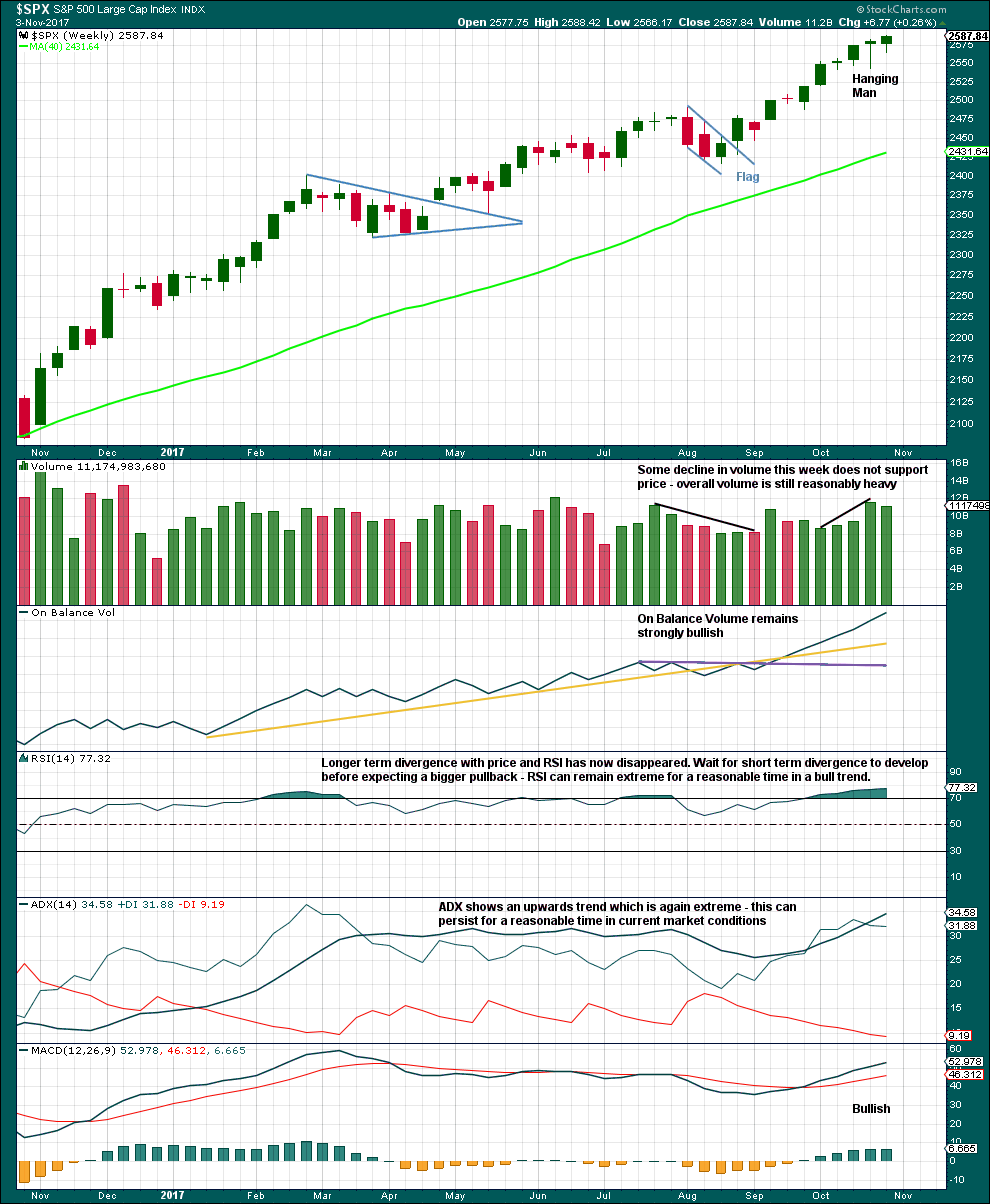
This wave count has strong support from very bullish On Balance Volume at the weekly chart level. While classic analysis is still very bullish for the short term, there will be corrections along the way up. Indicators are extreme and there is considerable risk to the downside still.
As a Grand Super Cycle wave comes to an end, weakness may develop and persist for very long periods of time (up to three years is warned as possible by Lowry’s for the end of a bull market), so weakness in volume may be viewed in that larger context.
When minor wave 3 is complete, then minor wave 4 should find support about the lower edge of the best fit channel. Minor wave 4 may not move into minor wave 1 price territory below 2,299.55.
The next reasonable correction should be for intermediate wave (4). When it arrives, it should last over two months in duration. The correction may be relatively shallow, a choppy overlapping consolidation, at the weekly chart level.
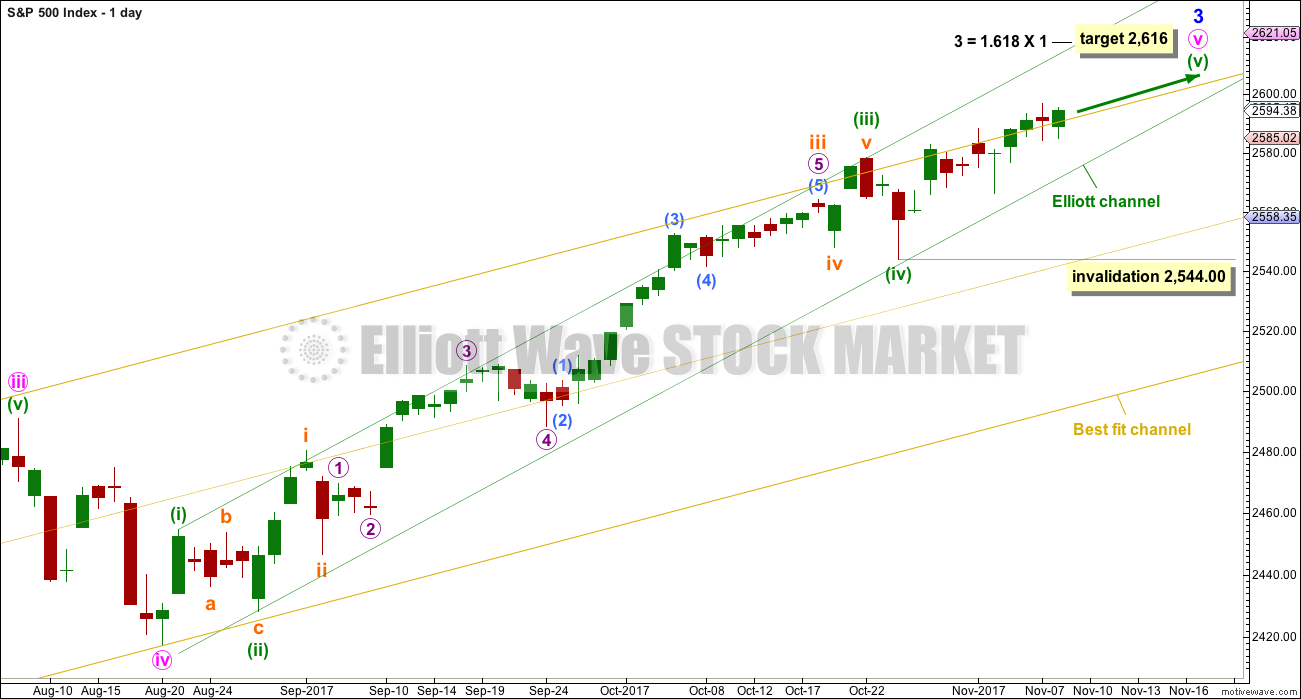
DAILY CHART
Minute wave v is completing as an impulse. The final fifth wave of minuette wave (v) is underway.
The target for minor wave 3 expects to see the most common Fibonacci ratio to minor wave 1.
Within minuette wave (v), no second wave correction may move beyond the start of the first wave below 2,544.00.
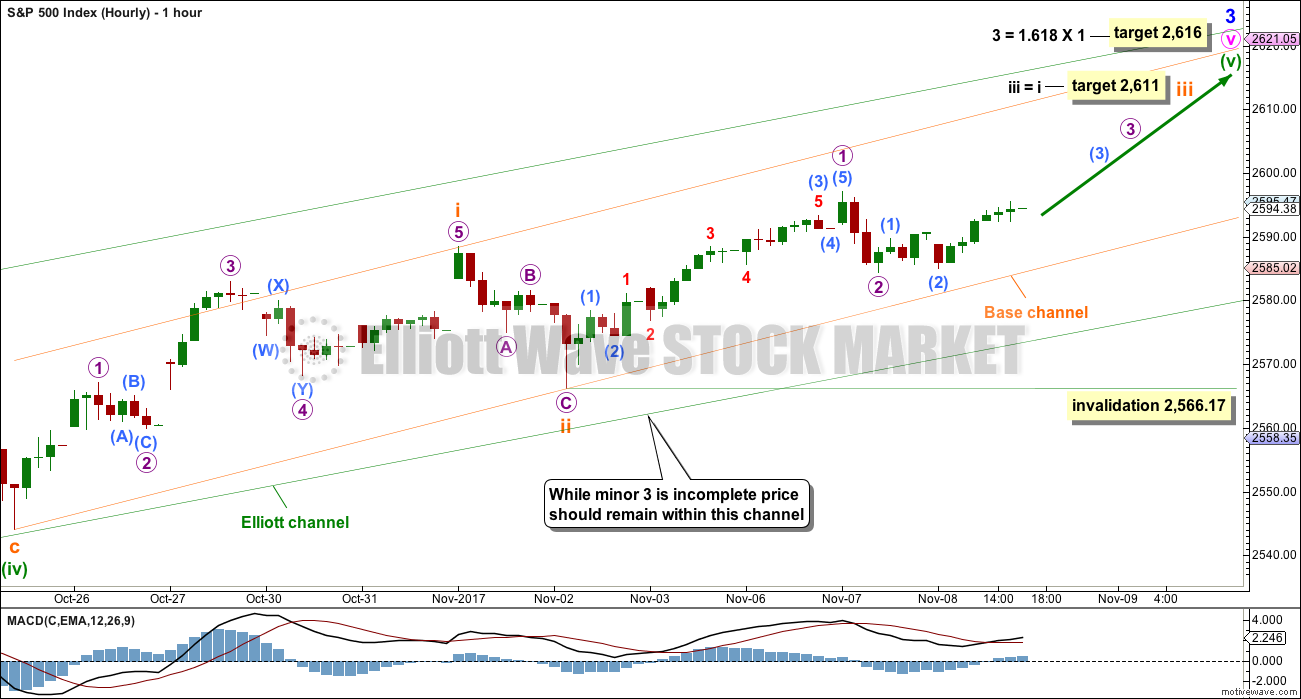
HOURLY CHART
Assume the trend remains the same until proven otherwise. Assume the trend remains up while price remains within the green channel and above 2,566.17.
Minuette wave (v) must subdivide as a five wave structure. It may be an impulse with subminuette waves i and ii complete.
This wave count expects to see a further increase in upwards momentum as a small third wave up unfolds.
Within the impulse of subminuette wave iii, micro wave 1 may now be complete. Micro wave 2 may be complete. If it were to move lower now, it would have to break below the lower edge of the orange base channel. If this wave count is correct, and if the base channel behaves as base channels most commonly do, then that should not happen. Price should find strong support at the orange trend line. It may not move beyond the start of micro wave 1 below 2,566.17.
A breach of the green channel by downwards movement would be the earliest indication that this first wave count may not be correct. If that happens, then seriously consider the alternate hourly wave count below.
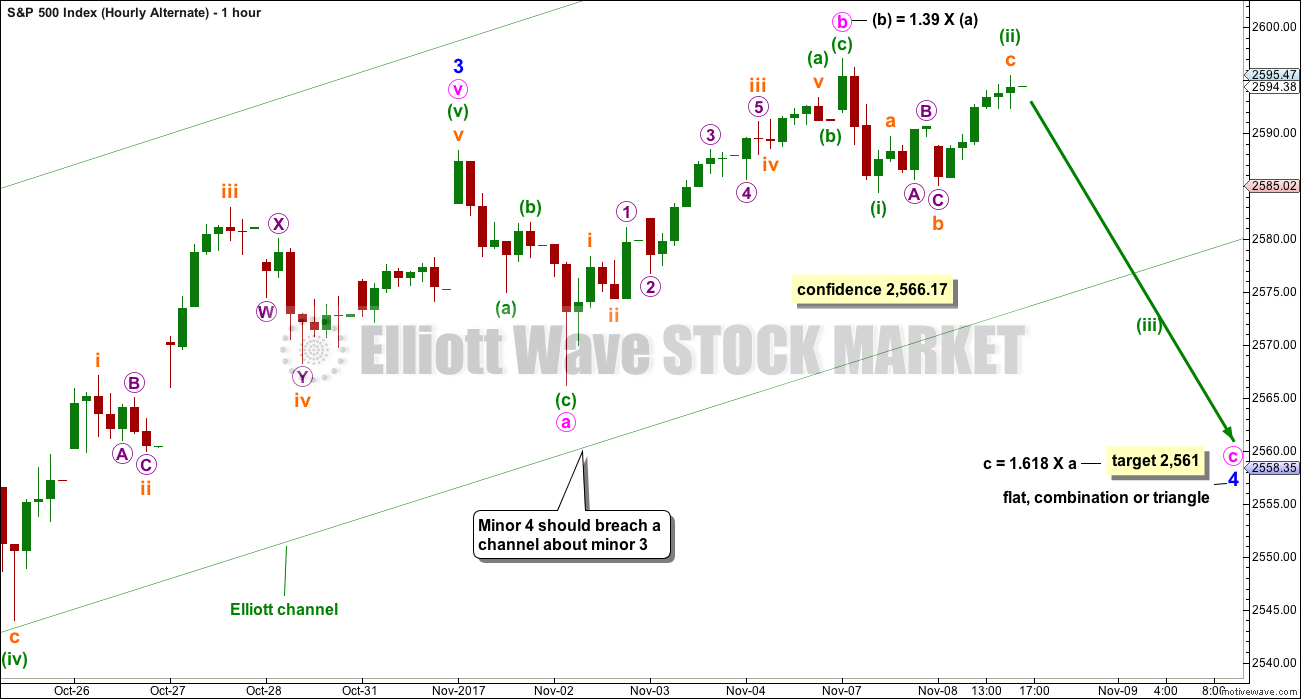
ALTERNATE HOURLY CHART
This alternate simply moves the degree of labelling within the last five up all up one degree. It is possible again that minor wave 3 could be over.
Minor wave 2 was a quick shallow 0.16 zigzag lasting just three days. Minor wave 4 should also show up at the daily chart level. It may be a sideways consolidation, subdividing as a flat, combination or triangle, to exhibit alternation with the zigzag of minor wave 2. These structures are often more time consuming than zigzags. So far minor wave 4 may have lasted eight days and the structure would be incomplete. It may end in a total Fibonacci thirteen days.
A new correction at minor degree should begin with a five down at the hourly chart level. This has not happened, a three down only is complete. The probability of this wave count is reduced.
Considering the duration of this possible correction, the degree of labelling is moved up one degree today. Minor wave 4 may be closer to completion. It may still be a flat, combination or triangle although it is labelled here as the most common of these structures, an expanded flat.
There is reasonable support from volume for recent upwards movement. This reduces the probability of this wave count substantially; B waves should exhibit weakness and not strength.
This alternate is an unlikely scenario; it is only published to consider all possibilities.
TECHNICAL ANALYSIS
WEEKLY CHART
Click chart to enlarge. Chart courtesy of StockCharts.com.
The Hanging Man candlestick requires bearish confirmation because the long lower wick has a strong bullish implication. Last week has not given bearish confirmation, so the Hanging Man candlestick should not be read as a reversal signal.
Indicators are now extreme, but at this stage there is not enough weakness in price to indicate an end to the upward trend here. Extreme conditions for ADX and RSI may persist for several weeks while price continues higher.
DAILY CHART
Click chart to enlarge. Chart courtesy of StockCharts.com.
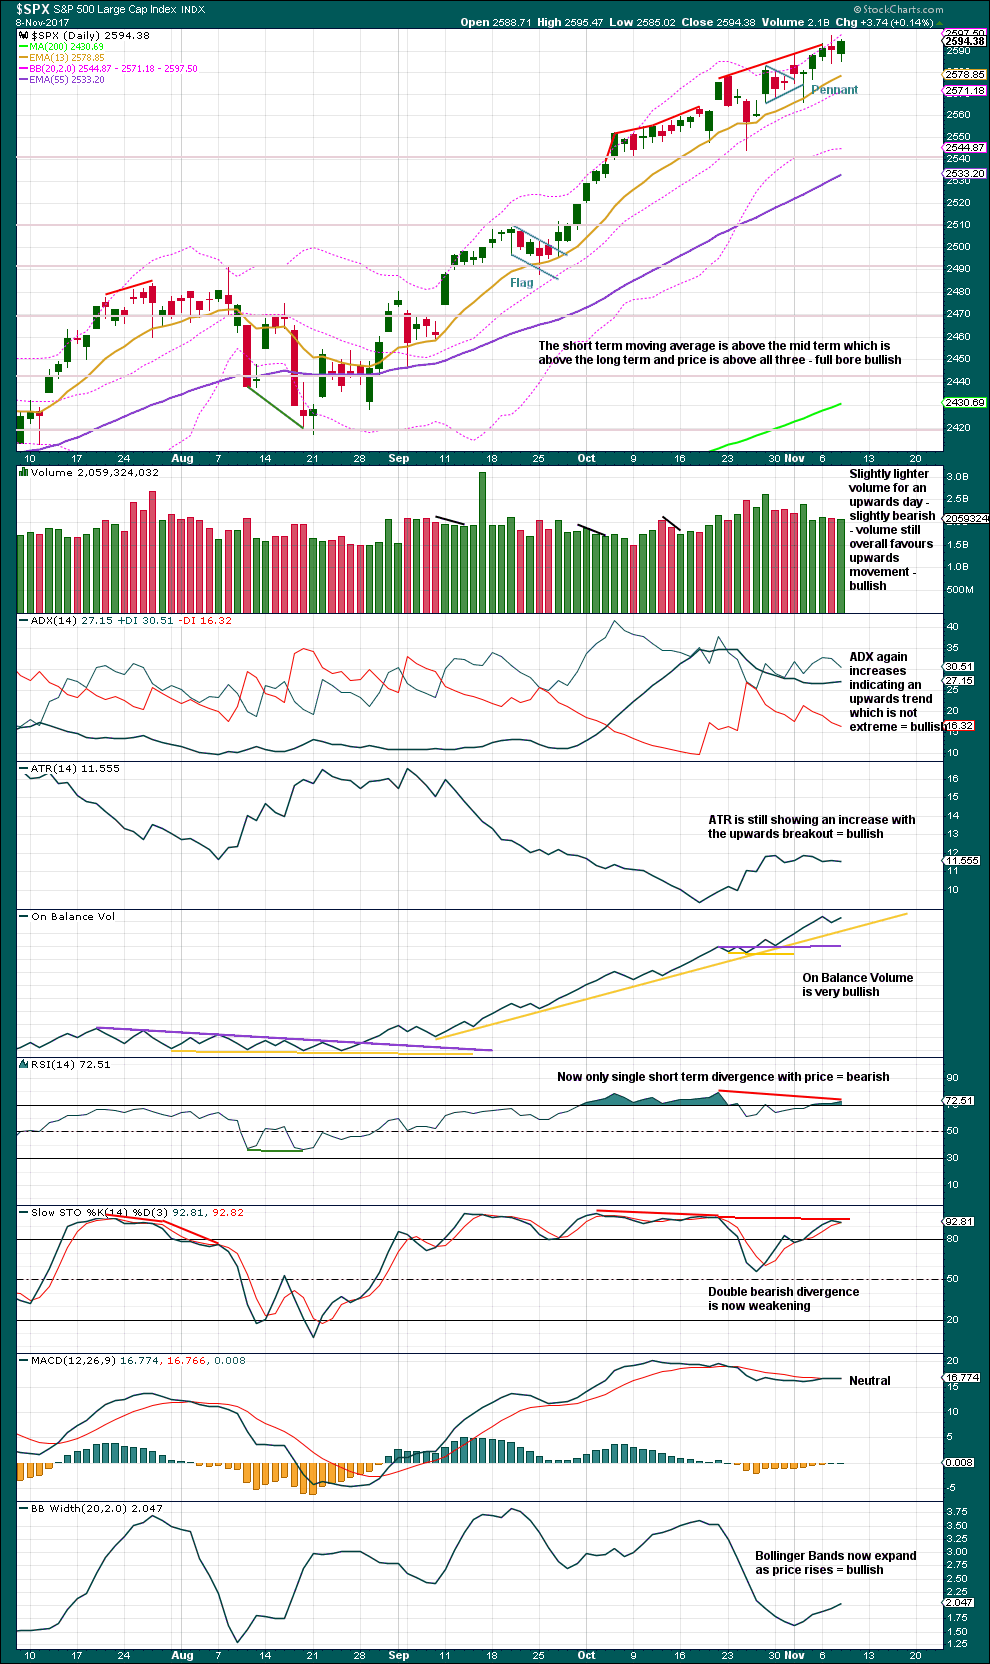
Pennants are one of the most reliable continuation patterns. The measured rule calculates a target about 2,617. Because this is only one point off the Elliott wave target, this area may offer strong resistance.
The trend is clearly up. Go with the trend. But risk management is essential, as always: with RSI and Stochastics both extreme, there is risk here of a pullback to resolve these conditions.
Strongest volume of recent days is still for the two upwards days of the 27th of October and the 2nd of November.
VOLATILITY – INVERTED VIX CHART
Click chart to enlarge. Chart courtesy of StockCharts.com.
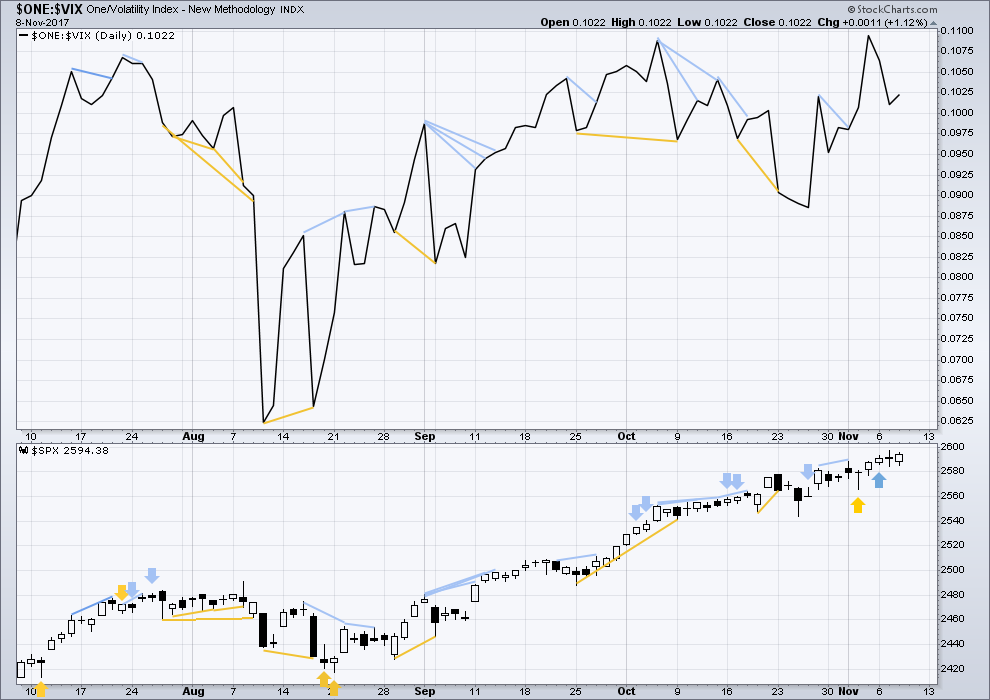
Normally, volatility should decline as price moves higher and increase as price moves lower. This means that normally inverted VIX should move in the same direction as price.
Bearish divergence noted in last analysis has been followed by an outside day with the balance of volume downwards. This divergence may now be resolved, or it may need another clearer downwards day to resolve it.
BREADTH – AD LINE
Click chart to enlarge. Chart courtesy of StockCharts.com.
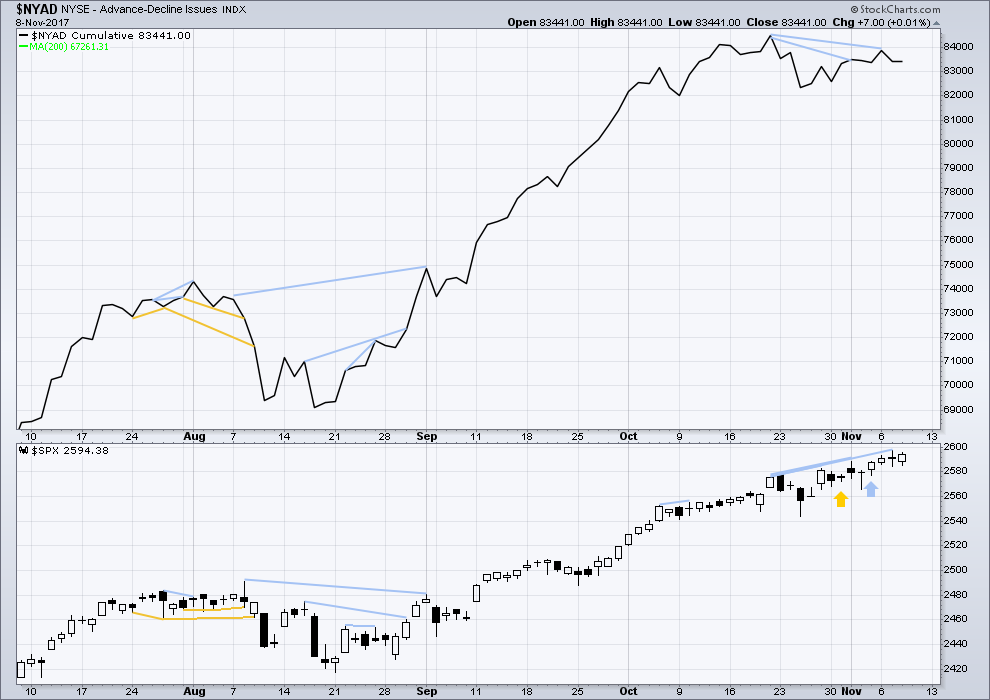
There is normally 4-6 months divergence between price and market breadth prior to a full fledged bear market. This has been so for all major bear markets within the last 90 odd years. With no longer term divergence yet at this point, any decline in price should be expected to be a pullback within an ongoing bull market and not necessarily the start of a bear market.
There is still some mid term divergence back to the 20th of October. As minor wave 3 comes to an end, this should be expected.
Short / mid term divergence with breadth and price will be noted today. This is bearish, and it may be indicating the end of minor wave 3 (main hourly Elliott wave count) to come in a few days, or it may be indicating the alternate hourly Elliott wave count is correct and price is ready to move strongly lower for a few days right here.
Small caps have moved lower during last week failing to make new all time highs. Mid caps made their last all time high on Wednesday and have failed to make a new all time high for Friday. There is some very short term weakness within this market developing.
DOW THEORY
At the end of last week, only DJT failed to make a new all time high. The S&P500, DJIA and Nasdaq have made new all time highs. DJT has failed so far to confirm an ongoing bull market.
Failure to confirm an ongoing bull market should absolutely not be read as the end of a bull market. For that, Dow Theory would have to confirm new lows.
The following lows need to be exceeded for Dow Theory to confirm the end of the bull market and a change to a bear market:
DJIA: 17,883.56.
DJT: 7,029.41.
S&P500: 2,083.79.
Nasdaq: 5,034.41.
Charts showing each prior major swing low used for Dow Theory are here.
Published @ 06:45 p.m. EST.

I’m trying to see if for the first hourly count, subminuette wave i could have been over at the last high. And it just won’t work.
What does work nicely today is the alternate hourly wave count.
The VIX battle around the 10.50 pivot was won by the short sellers at the last engagement. Let’s see how things turn out today as price has retreated to that general area once again…
SPX wave 4, as per alternate hourly count, just went into wave 1 territory.
Once again, we could be looking at a short-lived correction to the downside. Long lower wicks have been reliably bullish of late- plain and simple. Looks like we are going higher folks…
It could be a second wave but I doubt it. When these kinds of impulses are arrested and reversed its is bullish. Corrections at the start of larger impulses down are swift and generally complete intra-day…not happening here…
Agree. Suspect low of day was a deep Subminuette 2 to 2566.33 as it did not take out previous low of 2566.17. Wish I went long using that as a stop loss. Would have been a low risk , high reward trade. High today may have been end of micro 1.
Don’t feel badly. So far we have no confirmation of what Mr. Market is up to. There will be plenty of opportunity to jump on board, whatever his ultimate direction….
Price has crossed back into the range of the 1…(barely, but definitely).
I know 🙁 That count will now expect another first and second wave…. and it will still be the alternate.
Until price can make a new low below 2,566.17 it just has to be.
Although the 10.50 pivot held into the close, there is a mini head and shoulders pattern in the chart. I would not at all be surprised if we get a new 52 week low in VIX in a final wave up. We should have some idea from the action in futures overnight. Have a great evening everyone!
FWIW, we do have a bearish engulfing candle in ES and a beautiful impulse down, so at least in ES, we could be looking at a second wave ahead of….well, I’ll leave it to your imagination…! 🙂
In SPX I see a corrective a-b-c down, and now an impulse pushing up. At the daily level, we’ve got a hanging man candle but it’s not in right position to be called such (need to be a top). Not a bearish engulfing (at this point, the day isn’t over). The situation now is back to the main count, and bullish, in my view. Similar to 10/25. And 9/5.
Just saw Lara’s note…I’ve aggressively closed out most long equity positions. It’s that generic problem once again: when is it an ABC down following by the start of a 5 wave impulse up, versus a 1-2-3 down followed by a 4 up? I’m going to go with the experts opinion (I’ve learned!).
I’m looking at data now the session is closed, and it’s just so unclear.
Short / mid term breadth is bearish. Volume and price today are bearish. RSI and Stochastics are bearish.
But the long lower wick on todays candlestick is bullish and On Balance Volume remains bullish.
I’d like to sit on the fence until On Balance Volume gives us a signal. Then I’ll shift.
We will swing our legs together while we wait…! 🙂
As expected, the volatility short squad has stepped in and smashed VIX below 11 again. I am still wary since the action since the August low looks suspiciously like a 5-up with Tuesday being the top.
I am going to hedge with some short GLD put spreads. A failure with the tax bill should drive the dollar to new lows.
How do you smash the vix? Given how it’s computed, doesn’t that mean convincing all the option sellers to adjust their prices? Why do they adjust their prices at all; what drives their pricing? I believe it is historical behavior of the market, with limited forward discounting (no more than 30 days; all the options used in the calculation expire within 30 as I understand it). So…what would it really take for a “squad” to smash the vix? I view the vix very simply: it’s a function of SPX action, period. It’s derived, and is extremely non-speculative. VIX futures…that’s a different market with more future discounting, by definition. VIX etfs: they are derived from vix futures, so also more speculative. But the VIX itself…it’s just reflects SPX price action and the implied potential re: move size. I could be wrong.
That’s pretty much how I see it too, Kevin. I like the VIX etfs because they are so liquid and often seem to move in a slightly more oderly manner than SPX – to my eye, at least. But they don’t seem to make good Elliott Waves, as far as I can discern.
Expected by whom, may I ask? 🙂
I believe the expectation is driven by straightforward math, driven by historical price action (price volatility). I.e., “The overall value of an option is actually determined by six factors: strike price, current market price of underlying stock, dividend yield, prime interest rate, proximity to expiration date, and the volatility of the stock prices over the course of the option.” The last one is key, and is determined by historical volatility, using math. As I understand it.
Take a look at the VIX 5 minute chart. There is still a lot of INSANITY going on. There is a massive spike down to 9.79 in the middle of the sea of red this morning. Now that is I what I call NUTS!! They are going to fight this decline folk..get used to it…. 🙂
Whoever pulled that stunt had their head promptly handed to them…as you can plainly see!
Bizarre. Almost looks like a data error to me. Given that vix is a figure derived from SPX option prices…did the price of SPX options REALLY do that move? I doubt it.
Don’t believe everything you hear…! 🙂
Can the bears punch through the consolidation shelf?
SPX broke through Lara’s Elliott Channel on the Daily chart. Came within pennies of invalidating the main hourly chart.
What’s the meaning of this??
The alternate could be correct?
Until I can find a better count… that’s what I’m gonna have to go with today.
I have always had a fondness for that alternate…! But Y’all knew that….! 🙂
Indices all finding initial support at 21 day EMA. If re-tracement starts today and gaps remain open, I think we are going to see a blood-bath in the futures market. Batten down the hatches people….
If the gaps are closed, I will be expecting an early Santa Claus Rally and trading price accordingly….let’s see what Mr. Market has in mind……
Selling another 1/4 VIX 10.00 strike calls for 2.20. Will let the remainder ride until we clear upper B band with a long upper wick…
Holding long and mid term volatility trades.
We are looking at some potentially once in a generation trades in this market imho….
I think we are on 7 times in a row!!! Just tagged half, Keeping half….Had to tag SVXY puts up 83% but I know it’s getting cut in half at some point soon.
…And that is just a START…! 🙂
Verne, can you share what you hold that you consider “long” and “intermediate” term? 6 months and 2 months? 2 months and one week? I’m just curious, having dabbled recently with VIX calls.
Intermediate is for me three to six months out and long anything beyond a six month window. Those time frames are based on my own comfort levels with theta decay as I trade a lot of options…
Making a speculative trade on options expiring tomorrow. Even if we are at the forefront of a more protracted decline, I am expecting to see us put in some kind of interim bottom tomorrow with a furious upward re-tracement to follow.
Buying the DIA 234 strike puts for 0.90, small batch of 50 contracts.
Opening STC order to exit at 1.50 bid OR contingent to exit with a half point DIA trailing stop whichever comes first…why not have a little fun with the cartel??!! 🙂
SPX is now looking rather bearish short term. Looks like a bear flag on the 5 minute. On the bull side…could be some kind of flat as a C down? I dunno. It’s close to “decision time” for the market between the main and alternate counts.
Major Candlestick Pattern failure on the 15 min Chart
That CS Pattern failure now in all major indexes NDX, COMP, SPX, $DJI, RUT
5 Day Low now taken out in $DJI and RUT. SPX, NDX, COMP will follow!
Kevin,
Don’t see wheels coming of the car just yet and expecting the market to put short term bottom between now and tomorrow. After that we should get some more up days . I am personally looking for a short term bottom between 2,564 – 2,567 today/tomorrow.
Markets will sell off in serious way into the new year and until then we just take what it gives to us.
My short term take as well, particularly with this “all markets” bounce and a clean bounce off the 100% retrace. Bgt some upro…
A bit conflicted about TZA as B bands are not expanding to contain price. Sold another 1/4…will hold position with house money…
For any stock trend traders out there…SLCA has clearly established an uptrend, and as historical prices demonstrate, there’s some serious upside potential. Just FYI. (I am long.) Here’s a chart that shows what I’m talking about: weekly, daily, hourly, 5 minute around the clock starting upper left.
Also sold remaining. IYT 172 strike puts for nice double plus. Awhile back I mentioned its tendency to hug the lower B band and that seems to still be the case. A bounce may be ahead…
TICK
I detected just a whiff of fear today as my 10.00 strike calls sold for 2.00 even, ABOVE the 1.95 ask; that is a rare event indeed! 🙂
Here’s hoping for another reload opportunity, thanks to you-know-who! 🙂
SPX: If today’s low is in, today’s opening could be submicro-C to complete micro-2, a very tidy .618 retracement of micro-1.
If today falls lower, then maybe the alt hourly is in play.
On the 5 minute chart I can count five waves down from yesterday’s afternoon high. That would fit with the submicro-C scenario. If the gap down gets filled, it would be a sign of continued grinding upwards movement.
However, the move up off of today’s low, is also retracement back to the underside of the upward sloping wedge’s lower trend line (see chart)
Agreed! Under normal circumstances the wedge underside should prove formidable resistance and if the pattern was an ED, it will. HOWEVER….we have seen the cartel forcibly reverse so many bearish signals we cannot take anything for granted and must await price confirmation. I think they are running out of options.
The upward action at 11:00 am EST does look like it’s a corrective zigzag. Need a sharp downward move to confirm. I would see that as Lara’s alternate, not an ending diagonal.
An ending diagonal would begin after a down move, labeled (iv) on Lara’s chart (10/25), not at the end of an up move (10/23), i.e. the first wave of an ending diagonal would be up in this case, not down. But I agree, it is kind of wedge-shaped, struggling upward.
I look forward to Lara’s take on this move.
Chris thank you for pointing out JO (coffee ETF) to me a few weeks ago. Entered yesterday, moving up nicely today.
Welcome Kevin, it appeared to be forming a very nice base.
Both JO and WEAT in my long term accounts. The coming cooling cycle means MUCH higher food prices…
One question about JO (and WEAT): are prices based on a blend of futures prices, and hence suffer slow price declines (nominally) due to contango in those markets? It appears visually looking at the chart that this is the case, but I haven’t confirmed it. I do hate trading with a negative edge “built in” to the ETF (but will when conditions are ideal).
The biggest positions in these commodities are SPECULATIVE, and NOT for price hedging purposes. Your advantage in this trade is you know what is coming. Trend followers don’t know and frankly don’t care…
Yes they both suffer from that
If you are trading VIX, I suggest staying disciplined and taking profits on half your position at the open. Do not underestmate the cartel… 🙂
It looks like the open is going to strongly support the alternate hourly count. Lets see how low we can go today. The long awaited pullback / correction that I have been waiting for to go long may just be materializing. I am glad I did not take any long positions yet. I am watching the $NYMO as a key to the end of this current pullback / correction. My best guess right now is somewhere around 2525, perhaps 2550. I hope the lower number materializes.
Verne, congrats on your long volatility play. I admire your ability to stick to your guns, so to speak, especially in the face of significant nay-Sayers. Yet you are kind enough to advise those long volatility, to be wise and take some profits off the table. Good call. Good form my friend.
🙂
By the way, over the past few weeks, you and I have often been noticing what we call upward sloping wedges. Some say our sight needs to be adjusted. However, today the SPX will break an upward sloping wedge that began on the 23rd of October. Hmm. Could it be an ending diagonal?
Yep! 😉
THe critical level in my book is 2673.6, because it’s the 76.4% retrace of the Nov 2-7 up move. Beyond that, and price “should” be moving yet lower. A solid turn above that, and possibly all we have here is a strong micro 2 as some kind of WXY (or similar) down. It’s much too early to think this is anything other than that, IMO. That all said…THANK VERNE for pointing me towards TZA late yesterday! Definitely in the black there…
I am guessing you meant 2573.6 not 2673.6.
We are approaching 2573. Just 6 points away at 9:48 AM.
Yea, moving fast, lots of trade set ups!!! It appears for the moment to be holding at 2578 area, the 61.8% retrace level. Obviously that’s the most likely turn point, if it is going to turn. I’ve started timidly taking some longs with very tight stops. Getting in on the pullbacks is always a bit hairy!!
Most welcome my man! I figured since I had already borne the underwater pain for a bit I might as well spread the joy… 😉
I managed to cash at the top today, too, sweet. Now if JPM and GS would just start running up…
Does anyone think we are in a 5 wave of some sort?
I have seen a few counts that put us in a terminal fifth wave. As I mentioned, EWI has called a top but I do not trust them. I am assuming that Lara’s short term target of 2616 is correct and that the trend remains up. The upside potential is however less than 2% and I think the context in which we consider the trend is important. We have multiple HOs on the books (including four in the last two weeks) so there is a statistical 31% chance of a better than 10% decline , a 43 % chance of a better than 8% decline, and a 57% chance of a better than 5% decline, all in the next 30-90 days. As an options trader ( I know that is not everyone’s style), the great calculus for me is an accurate assessment of risk/reward ratio. Being bearish does not mean denying the current trend, or even being unwilling to take advantage (which I have in the form of bull put spreads). It simply looks at what the market is telling me about where price is likely to go in the future, and getting positioned for the best risk/reward scenario. I am certainly not trying to tell anyone HOW to trade. We are all here because we trust Lara’s analysis and hopefully to help one another. Let me suggest rather than find fault with other people’s point of view, post a few of your own trades that you think others might benefit from and explain your reasoning. If I think it a good call, even a bearish trader like me might take a stab at it! 🙂
Good call, Verne. You’ll be able to harvest some nice profits this AM!
Me… I was in XIV yesterday afternoon with a tight stop when the sudden whip down in the last half hour took me out. I was disappointed then. Really happy now!
🙂
SPX is in MULTIPLE 5’s (three, I believe), at different time frames. Study the weekly chart.
Just some random musings…! 🙂
It’s getting close; high yield broke down and spreads are blowing out globally
My long standing thesis. The bond market is the big kid on the block, less amenable to the typical shenanigans of the banking cartel clearly at work in equities markets. The yield curve is now the flattest it has been in ten years at around 69 basis points, probably on its way to inversion; almost certain with continued rate hikes. The pricing of risk in the bond market is another thing, like volatility in equities markets, that simply boggles the mind. Reality may indeed be starting to set in. I took a look at the charts of HYG and JNK today and sat bolt upright. They have both now breached the 200 day SMA; that event may be a sound of distant thunder…
You continue to be bearish when we are hitting ATHs every day. Look at Nikkei, up another 2% and 4,000 points in 8 weeks (the last 1000 points in just 5 days!) This ship may eventually sink but trying to time it is futile.
well, Jimmy, maybe you could help the rest of us out with some recommenfations of winning trades you are putting where your opinions are… 🙂
The problem I have noticed is that indicators, including volume and On Balance Volume, are often VERY bullish up to and just after a high of a reasonable magnitude.
There will be a substantial consolidation or pullback… and it is difficult to tell exactly where and when that will begin. EW targets can try and help, EW invalidation points can add a little more information… trend lines can add even more.
Which is why I advise to follow the trend… keep following the trend… until price tells us it is wrong. You’ll be right on every trade (if your stops allow room for the market to move) until the last one or two.
Are you talking about this? I know you are probably not a trader with a lot of experience but I hope this picture is worth a thousand words Jimmy…