A new all time high to begin the new trading week continues the upwards trend, which is what the last Elliott wave and volume analysis expected.
Summary: There is bearish divergence today with price and the AD line, RSI, Stochastics and volatility.
While the trend remains up, look out for at least a short term pullback to begin tomorrow. Look for one to a few red daily candlesticks here. The first target is about 2,548 minimum. If price makes a new swing low below 2,541.60, then the target is at 2,531.
This pullback may be used as an opportunity to enter the upwards trend. Only the most experienced of traders should consider trading it short.
Always trade with stops and invest only 1-5% of equity on any one trade. If trading a correction against the larger trend, then reduce risk to 1-3% of equity.
Last monthly and weekly charts are here. Last historic analysis video is here.
MAIN ELLIOTT WAVE COUNT
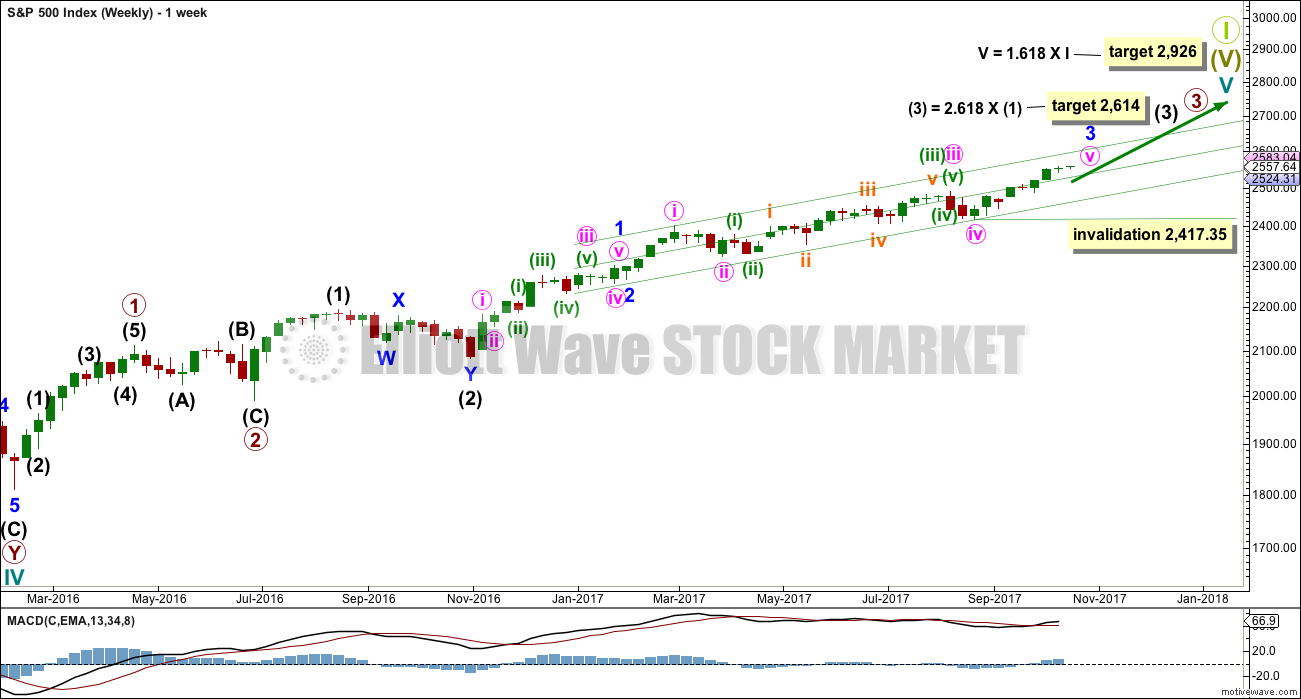
WEEKLY CHART
This wave count has strong support from another bullish signal from On Balance Volume at the weekly chart level. While classic analysis is still very bullish for the short term, there will be corrections along the way up. Indicators are extreme and there is considerable risk to the downside still.
As a Grand Super Cycle wave comes to an end, weakness may develop and persist for very long periods of time (up to three years is warned as possible by Lowry’s for the end of a bull market), so weakness in volume may be viewed in that larger context.
Within minute wave v, no second wave correction may move beyond the start of its first wave below 2,417.35.
The next reasonable correction should be for intermediate wave (4). When it arrives, it should last over two months in duration, and it may find support about the lower edge of this best fit channel. The correction may be relatively shallow, a choppy overlapping consolidation, at the weekly chart level.
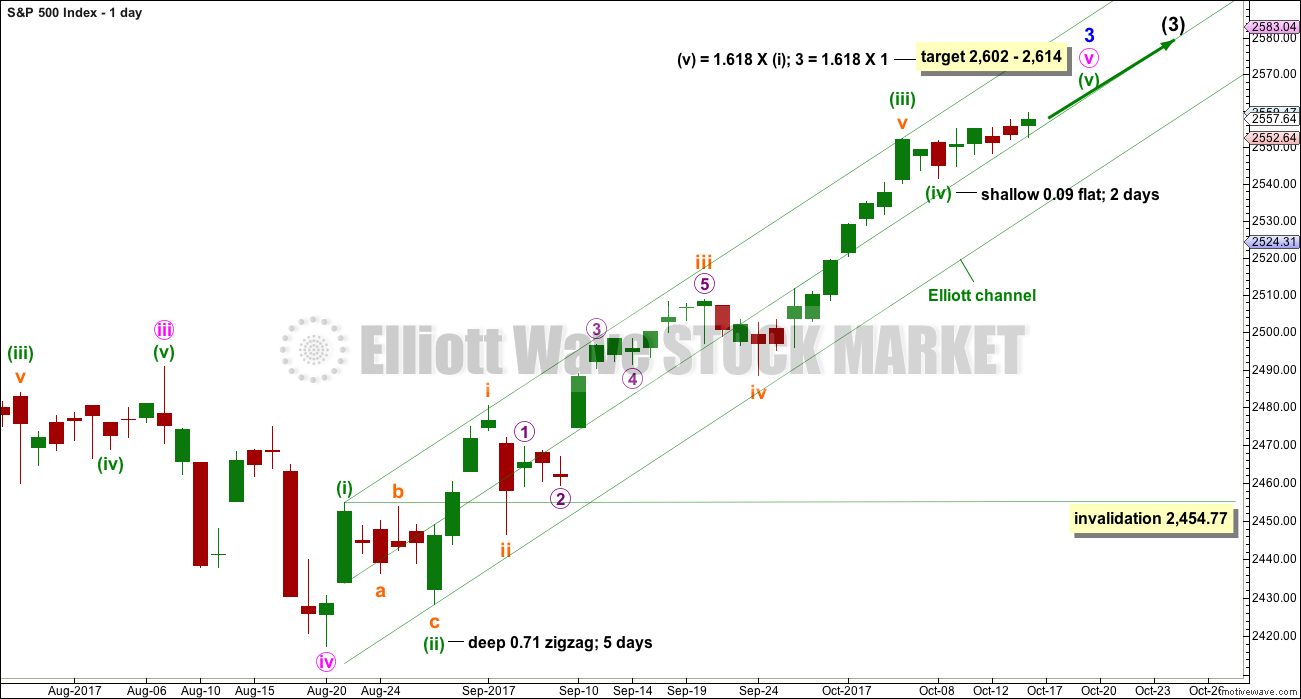
DAILY CHART
To see details of the whole of primary wave 3 so far see the analysis here.
Minute wave v to complete minor wave 3 must subdivide as a five wave structure. It looks like an incomplete impulse. It looks like minuette waves (i) through to (iv) may now be complete despite minuette wave (iv) lasting only two sessions. The problem of proportion may be accepted if bullishness in classic analysis correctly predicts more upwards movement.
If it continues any further then minuette wave (iv) may not move back down into minuette wave (i) price territory below 2,454.77. If it continues further, then minuette wave (iv) may end to total a Fibonacci eight sessions and have good proportion with minuette wave (ii).
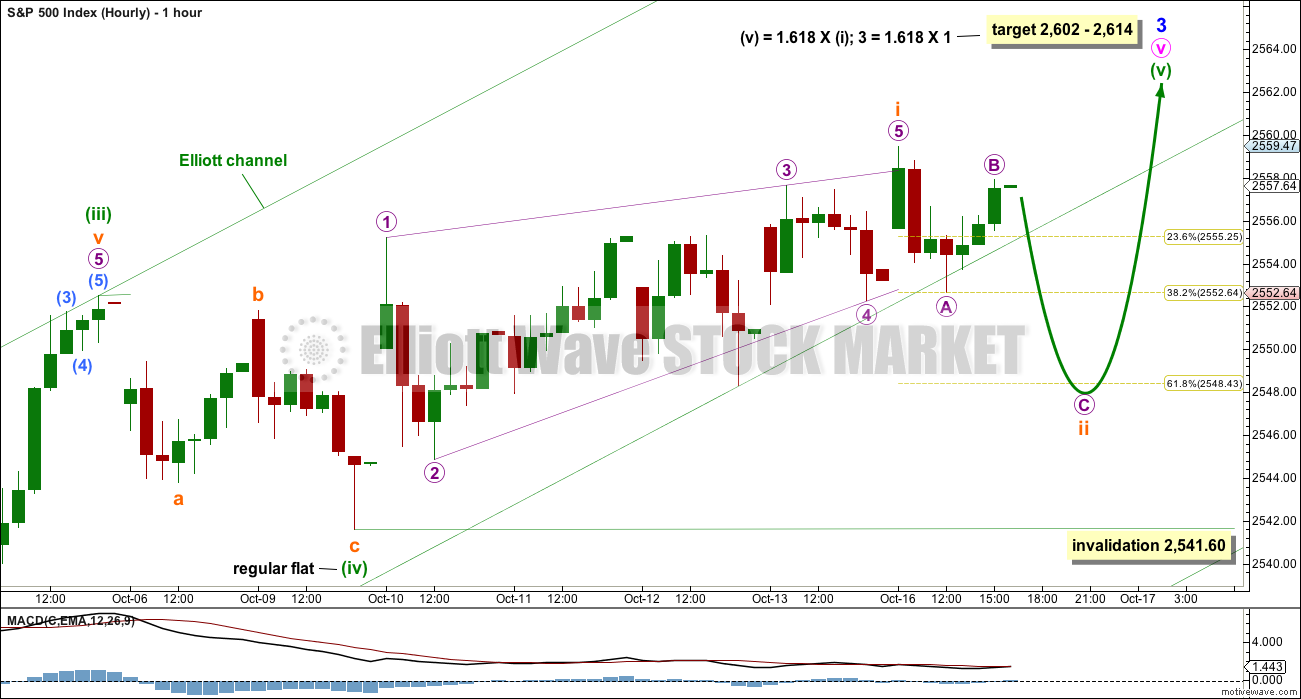
MAIN HOURLY CHART
It is possible that minuette wave (iv) may have been a flat correction. The downwards wave labelled subminuette wave a will subdivide as either a three or a five on the five minute chart. This wave count looks at it as a three which would give alternation for minuette wave (iv) as a flat correction to the zigzag of minuette wave (ii).
The target may now be calculated at two wave degrees, so it is widened to a rather large zone. When subminuette waves i through to iv are complete, then it can be calculated at a third degree. At that stage the zone may be narrowed.
Upwards movement from the end of minuette wave (iv) is today relabelled. A leading contracting diagonal may have just ended at Monday’s high, and this may be subminuette wave i within minuette wave (v). The only problem with this leading diagonal is the overshoot of the lower 2-4 trend line; this does not look typical. The structure does meet all Elliott wave rules.
Second wave corrections following first wave leading diagonals are most commonly very deep. If the 0.618 Fibonacci ratio as a target is wrong, it may not be low enough for subminuette wave ii.
Subminuette wave ii may not move beyond the start of subminuette wave i below 2,541.60.
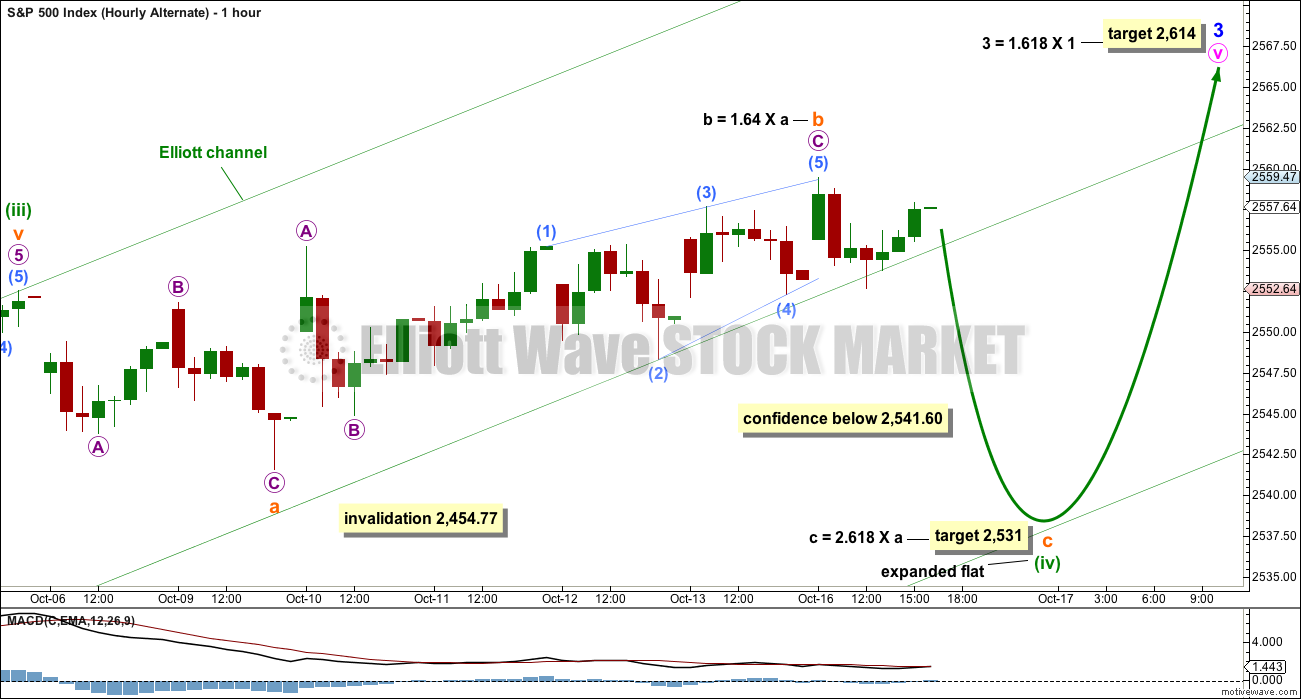
ALTERNATE HOURLY CHART
If minuette wave (iv) is not over, then it may continue for another one day to total a Fibonacci eight. However, this now looks to be too quick an expectation. The next Fibonacci number in the sequence is 13, which would see minuette wave (iv) continue now for six more days.
There are still multiple structural options for minuette wave (iv). Today, it is labelled as the most common option, an expanded flat. But it may still morph into a combination or complete as a running triangle.
An expanded flat may see minuette wave (iv) come lower to test support at the lower edge of the green Elliott channel. The target calculated may still be a little too low if this channel offers strong support.
The structure within subminuette wave b upwards is relabelled today. Seeing this upwards wave as a zigzag has a better fit than trying to see it as a five for the main hourly wave count.
This alternate wave count would see minuette wave (iv) still exhibit good proportion with minuette wave (ii), and they would have perfect alternation. At the daily chart level, this wave count would give the structure of minute wave v a better look.
TECHNICAL ANALYSIS
WEEKLY CHART
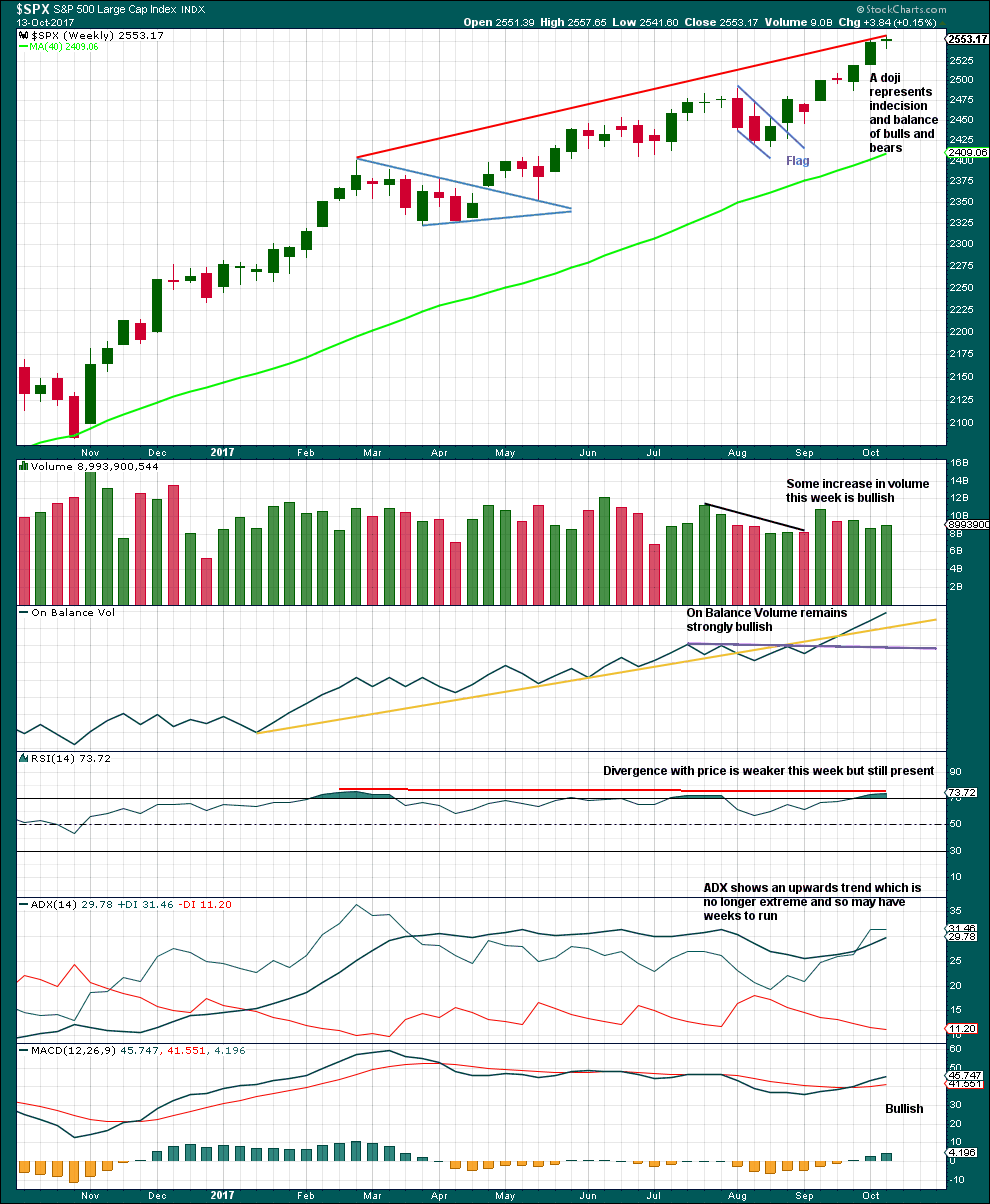
Click chart to enlarge. Chart courtesy of StockCharts.com.
Again, this week this chart remains very bullish. A doji on its own is not a reversal signal, and doji may appear as small pauses within upwards trends.
RSI is overbought and exhibits longer term divergence with price, but not short term. If short term divergence develops, then a pullback would be more likely. RSI may move higher to further overbought and may remain there for a reasonable period of time during a strong bull trend in the S&P500. On its own, it does not mean a pullback must happen here and now; it is just a warning at this stage for traders to be cautious and manage risk. Overbought conditions mean the risk of a pullback is increasing.
DAILY CHART
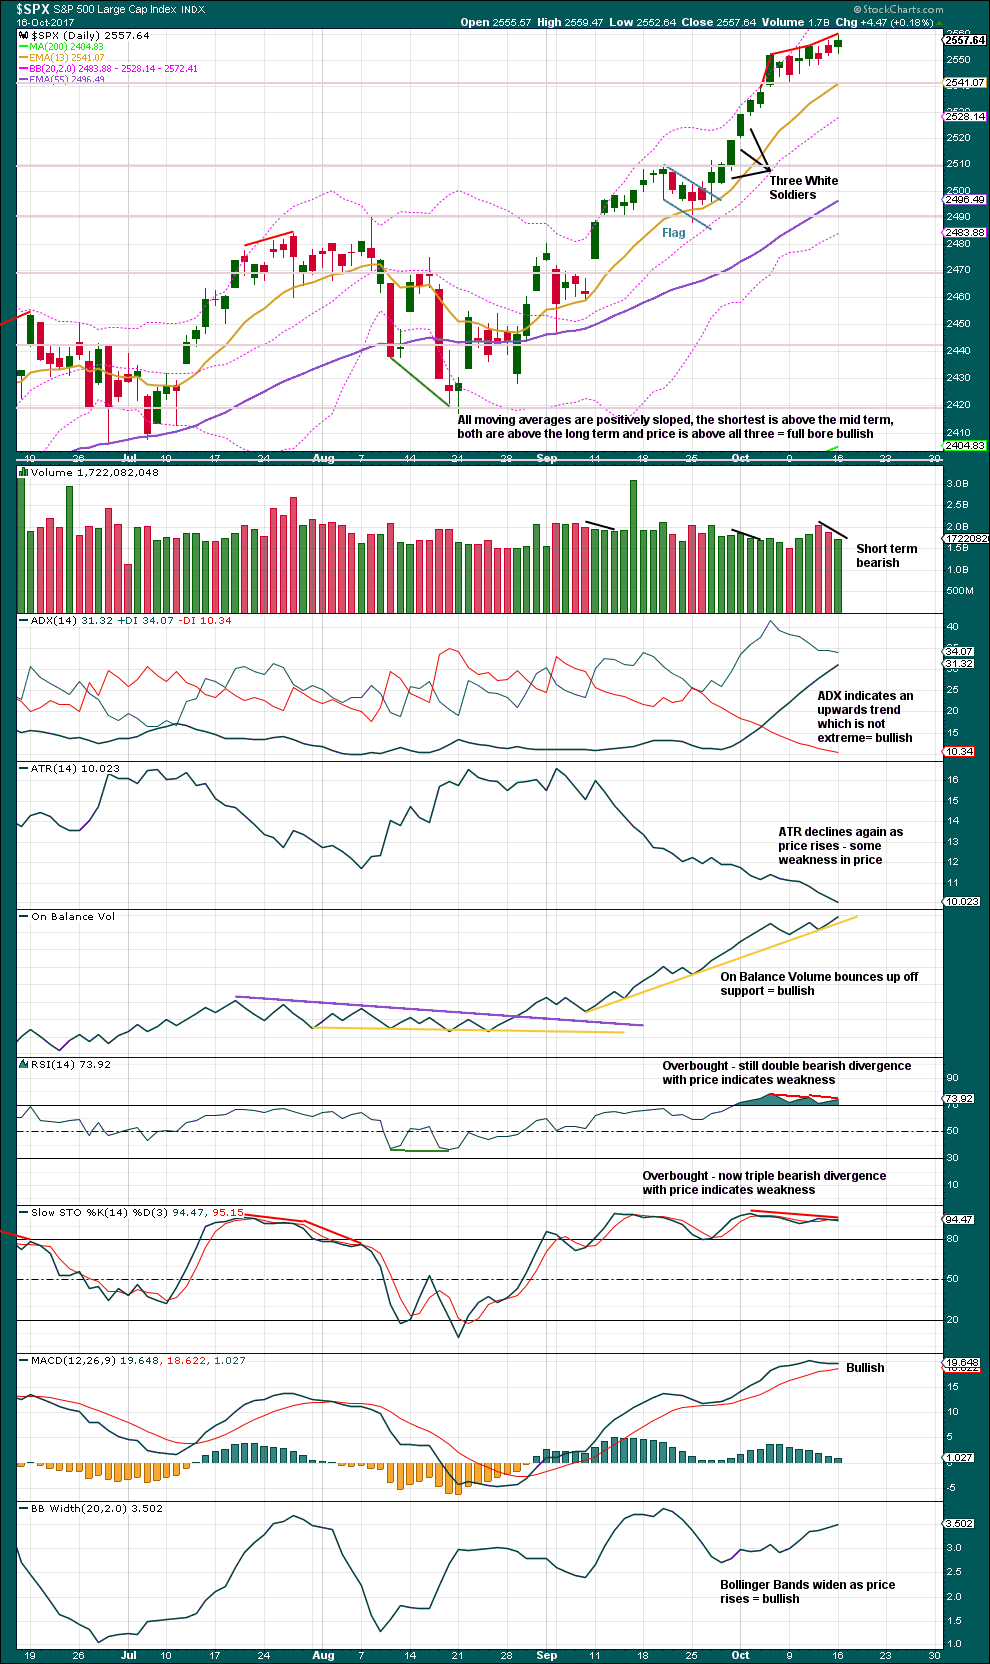
Click chart to enlarge. Chart courtesy of StockCharts.com.
Volume declining for two days in a row as price moves higher, double divergence with RSI, and now triple divergence with Stochastics, all indicate an extreme upwards movement which is highly susceptible to a pullback or consolidation about here.
Only On Balance Volume remains very bullish.
VOLATILITY – INVERTED VIX CHART
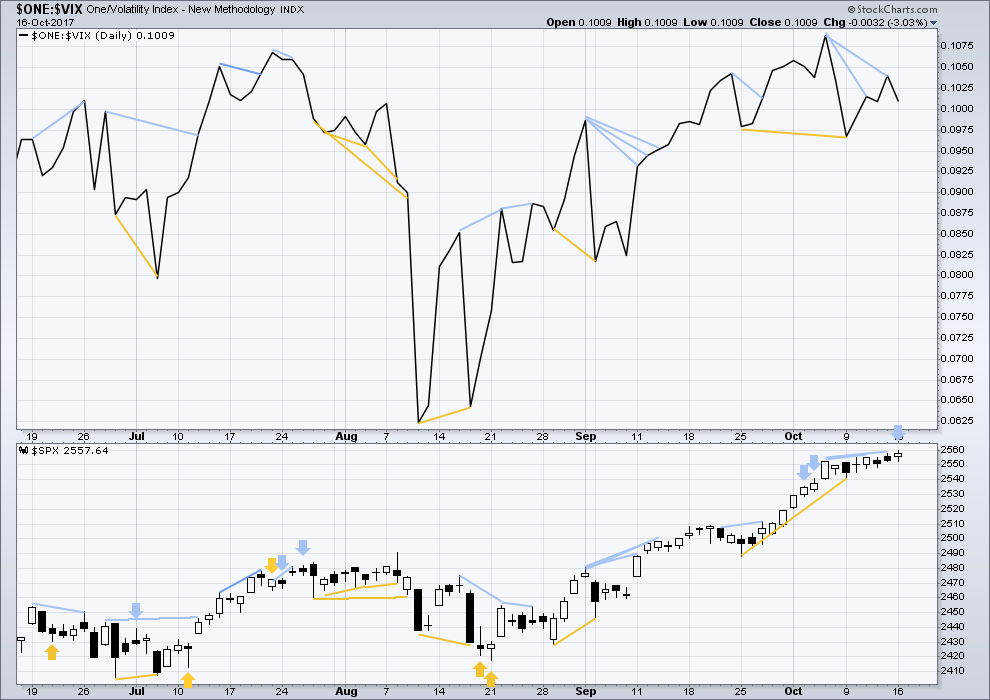
Click chart to enlarge. Chart courtesy of StockCharts.com.
Normally, volatility should decline as price moves higher and increase as price moves lower. This means that normally inverted VIX should move in the same direction as price.
Price moved higher today with a higher high and a higher low and a green daily candlestick. However, volatility did not show a normal decline and increased as inverted VIX moved lower. This single day divergence indicates weakness today within price and is bearish.
BREADTH – AD LINE
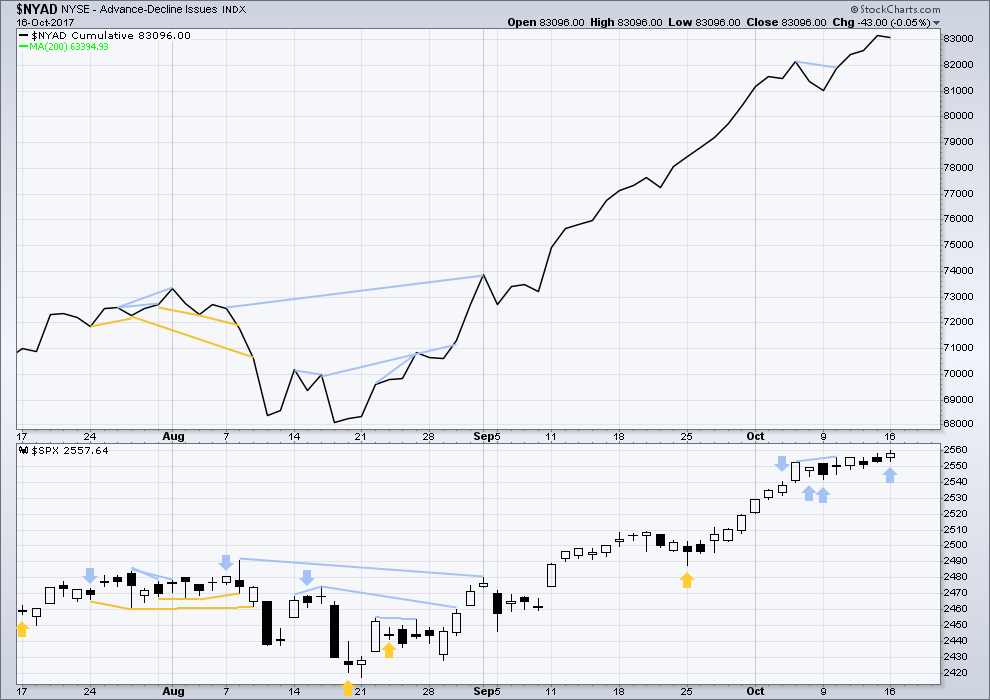
Click chart to enlarge. Chart courtesy of StockCharts.com.
With the last all time high for price, the AD line also made a new all time high. Up to the last high for price there was support from rising market breadth.
There is normally 4-6 months divergence between price and market breadth prior to a full fledged bear market. This has been so for all major bear markets within the last 90 odd years. With no divergence yet at this point, any decline in price should be expected to be a pullback within an ongoing bull market and not necessarily the start of a bear market.
While price has made a new all time high for Monday, it does not have support from market breadth. The AD line can be a leading indicator. The decline today in market breadth is bearish and supports the hourly Elliott wave counts which expect a pullback or consolidation to begin here.
Small, mid and large caps have all made new all time highs. The rise in price is supported in all sectors of the market.
Go with the trend. Manage risk.
DOW THEORY
All the indices are making new all time highs. The continuation of the bull market is confirmed.
The following lows need to be exceeded for Dow Theory to confirm the end of the bull market and a change to a bear market:
DJIA: 17,883.56.
DJT: 7,029.41.
S&P500: 2,083.79.
Nasdaq: 5,034.41.
Charts showing each prior major swing low used for Dow Theory are here.
Published @ 08:48 p.m. EST.

Well…. a small inside day wasn’t what I expected. That divergence between VIX, breadth, RSI and Stochastics all taken together looked like we’d see a red candlestick today.
The technical indicators say “turn”. The EW says “2 correction due”. The market action looks anything BUT impulsive, and strongly overweight and ready to fall.
Very tempting to take a pilot short…but the market keeps surprising to the upside! I’m going to wait for downside action than attempt to predict it. Let’s see what develops here….
Yes indeed. The deep pockets are also looking at those indicators and saying:
“Oh no you don’t! ”
He! He!
They are going to keep buying for as long as they possibly can. 🙂
I just noticed that we do have a doji on SVXY today but I doubt it means much. It would have been more impressive if it came above the upper B band so I expect we continue the grind higher for now with another sub ten VIX foray.
Price starting to look like the all-too-familiar consolidation event ahead of a run higher. It may be that the other indices will top as DJT put in some kind of second wave up but I think we are not done with upside action quite yet. I am expecting us to tag SPX 2560 at the very least.
President Trump is expected to announce his decision for next Fed Chair in the next 2 weeks, before he leaves for his Asian trip on November 3.
The whole Fed Res Board will be replaced.
Bid on IYT 175 strike puts up to 2.20. That’s more like it!
I plan on bailing at 2.50
Rinse and repeat.
As long as VIX stays below 13, scalping the chop worth the trading in and out costs methinks.
RUT has absolutely flat-lined. Very strange! Consolidation…or prelude to a plunge?!
Once again taking some profits on my considerable sized long VIX portfolio.
Would you delightful short sellers please send it back below 10.00 just one more time?
Thank you! 😀
If VIX clears 12.50 today…Forgetaboutit!
The money flows are fascinating. The banksters are buying, and they are buying big time.
We are seeing impulsive moves down and rising wedges up. I am starting to think we are not going to get a turn until we see a monster gap down that fills a few open gaps to signal the banksters have been overpowered. Fascinating!
DJT has clearly turned, but the other indices are squeezing the very last drop out of this rising wedge. I do not think we have a top. It looks like price is going to go to the very absolutest point of the wedge prior to a turn. Amazing!
FYI: I wrote this note about 30 min ago but had to take a call…
I am going to stick my neck out here…
DJIA to hit and test 23000… but that will not hold. Correction of a large magnitude will occur soon after.
What that will lead to in terms of EW… we will have to wait and see what count will then materialize.
I am doubling down betting the farm on this around 23000! Don’t follow me blindly, use your own personal risk management.
That’s okay if you don’t believe me. But orders were placed.
A few analysts I know (Robert McHugh and Peter Temple) are very bearish and think the market is close to an important top. Another one, Martin Armstrong, is uber bullish and think markets are going to double from here before they are done. What I find interesting, and McHugh is reporting this as well, is how vituperative bullish traders can be when others express a bearish viewpoint. They seem to take particular delight in derisively pointing out how bears have been wrong the last eight years, which of course is true. I guess it implies that they are going to be wrong for the next eight years as well, lol! McHugh says some of the e-mail he is getting is positively hostile! What’s up with that?
Reminds me of how things were just about ten years ago….. 🙂
The market makers are dragging their feet on my IYT 175 strike puts. What is this crap about a 1.95 bid on those puts??!! Don’t they see what VIX is doing?! I am not going anywhere.. He! He!
Concentrate on reading indicators and studies with countermoves of price in great detail whether in small time frames or large ones is absolutely necessary. It’s a great lesson to know what the AD Line is indicating. Preparation does pay off but as I cross examine my charts I’m actually missing the breadth of the market. My Advance/Decline Line is a different tool. Chart’s for $NYAD shows nothing for some reason.
Can anyone present how to get the Breadth – AD Line chart?
Indicators can be be misleading I am afraid….
Misleading at times but leading at other times, thats sounds like a 50/50 ratio. I use these indicators to just predict the markets direction and analyze a number of company’s health. When I started I’d assumed I’d run into a dozen or so specialized indicators and I think they are all valuable and interesting. Unless lessoning to lectures on housing, health insurance, tax policies, economic development and municipal politics over the years serves well.
I like to prepare relentlessly and its always good to know when the market or a company reaches its climax. On occasion there’s no substitute for gathering information.
If anyone is interested in data collection regularly and reliable – preferably on a daily basis at a set time I noticed the AD Line $NYAD can be found at stockcharts.com. I’m no longer blinding of injections of BIG MONEY being moved around, Its now clearer to diagnose, lol.
VIX readings are becoming curioser and curioser as per Mr. Dodgson’s wonderland world.
I mentioned yesterday the failure of VIX to trade at a new 52 week low despite DJI being a thousand points higher than when it last did so. The ready and easy retort would of course be that folk are less bullish now but that clearly would be a contradiction of what VIX is supposed to indicate. Now the CBOE is “officially” reporting that the put call ratio is now at the highest level since March of this year!
How is that even possible with VIX trading below 10???!!
I have seen some feeble attempts to explain it away by citing greatly reduced premium values because of the persistent low volatility but that is totally irrelevant. VIX is supposed to be simply a ratio of absolute numbers and premiums have nothing to do with it. While it is true the ratio determines premiums, the reverse is not the case. For some of us who have long been suspicious that they are not telling us everything there you have more evidence that this could well be the case. Either the number is bogus, or there is some other fungible variable not being reported. I have no clue what is really going on. 🙂
verne,
I keep nibbling at SVXY and TQQQ as realignment will happen (agree we would like it sooner but Mr. Market has its own agenda and timeline). This is reminding of the .COM days when everyone you talk to would advise you on stocks to buy and how markets wil continue to go higher ONLY.
I am just waiting and reading lot of good technical analysis (Lara’s included) and all point to Momentum crowd running the markets higher with no participation from smart money..we all know how that will end.
Yep. I know we have become so accustomed to the ramp higher on low volume that we are probably starting to think that ultimately it does not matter. Acutally, it does. If you look closely, it will also be evident that lately volume rises on declines and declines on rises – not sustainable indefinitely!
I too am sitting on a boatload of SVXY puts. I plan on rolling ’em as long as I can do so profitable…. 🙂
Firstest? No, secondest… drat!
Eehhh…!