Upwards movement was expected for Tuesday’s session.
A higher high and a higher low fits the definition of upwards movement, but the candlestick has closed red.
Summary: On Balance Volume and the AD line remain very bullish, supporting the main Elliott wave count. The next target is now at 2,521 to 2,526, but now it does not look like it may be met in another two sessions and may take longer than that.
Stay nimble and keep stops tight. This trend is extreme and over stretched. There is reasonable downside risk.
Always trade with stops and invest only 1-5% of equity on any one trade.
Last monthly and weekly charts are here. Last historic analysis video is here.
Due to strong support for a bullish wave count from On Balance Volume and the AD line, the wave counts are now labeled “main” and “alternate” and have been swapped over.
MAIN ELLIOTT WAVE COUNT
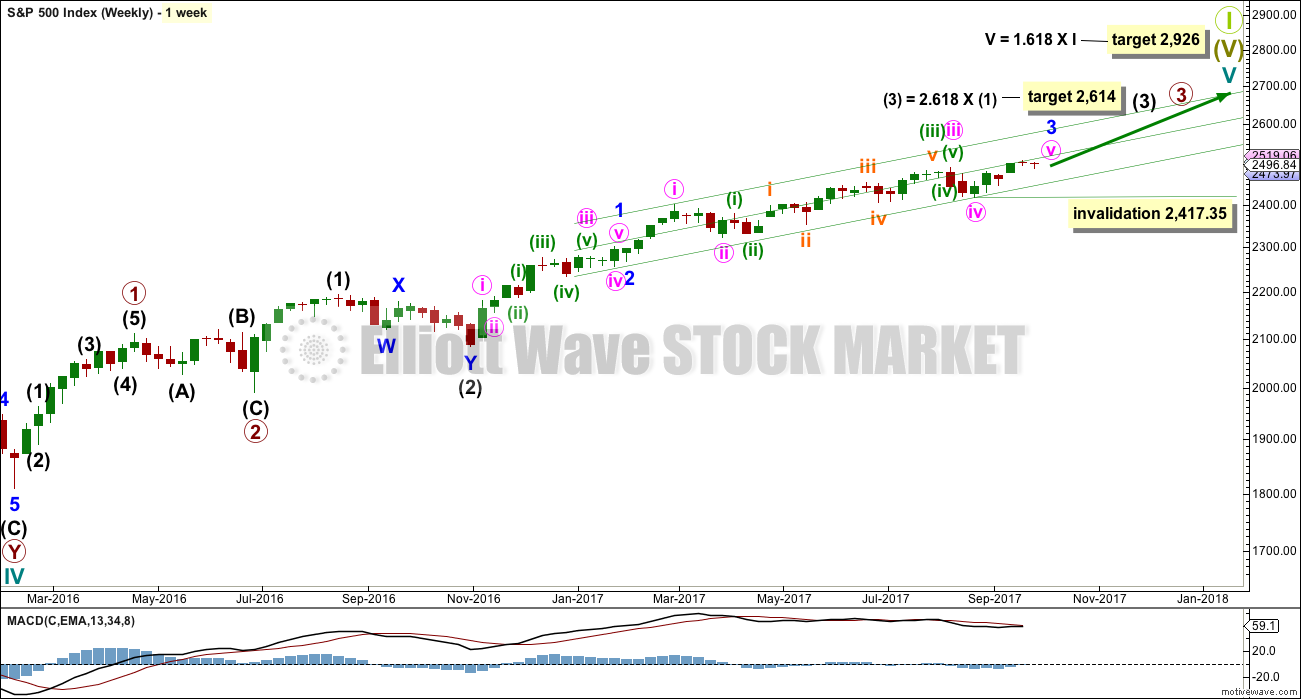
WEEKLY CHART
This wave count has strong support from a clear and strong bullish signal from On Balance Volume. While classic analysis is still very bullish for the short term, there will be corrections along the way up. Indicators are extreme and there is considerable risk to the downside still.
If primary wave 3 isn’t over, then how would the subdivisions fit? Would it fit with MACD? What would be the invalidation point and would the Fibonacci ratios be adequate?
Of several ideas I have tried, this one has the best fit in terms of subdivisions and meets all Elliott wave rules.
Despite this wave count appearing forced and manufactured, and despite persistent weakness in volume and momentum for this third wave, On Balance Volume does now strongly favour it. It may be that as a Grand Super Cycle wave comes to an end, that weakness may develop and persist for very long periods of time (up to three years is warned as possible by Lowry’s for the end of a bull market), so this weakness may be viewed in that larger context.
Within minute wave v, no second wave correction may move beyond the start of its first wave below 2,417.35.
The next reasonable correction should be for intermediate wave (4). When it arrives, it should last over two months in duration, and it may find support about the lower edge of this best fit channel. The correction may be relatively shallow, a choppy overlapping consolidation, at the weekly chart level.
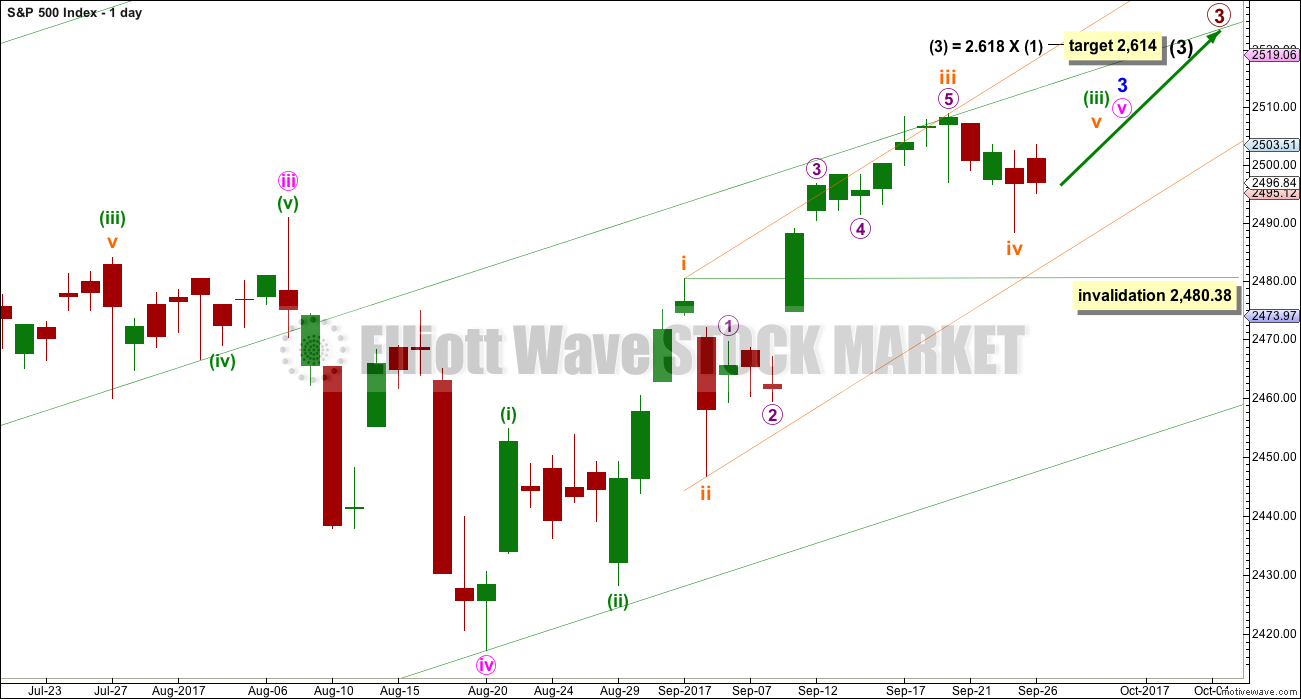
DAILY CHART
To see details of the whole of primary wave 3 so far and compare and contrast with the alternate wave count, see the analysis here.
Minute wave v to complete minor wave 3 must subdivide as a five wave structure. It looks like an incomplete impulse. Within the impulse, subminuette wave iv may not move into subminuette wave i price territory below 2,480.38.
Subminuette wave iv has now lasted three sessions to one session for subminuette wave ii, the structure still has a reasonably normal look at the daily chart level.
So far minuette wave (iii) has lasted 19 sessions. If it exhibits a Fibonacci duration, then the next number in the sequence is 21; this duration would see it end in another 2 sessions. At this stage, that duration is now looking too brief. Minuette wave (iii) may not exhibit a Fibonacci duration.
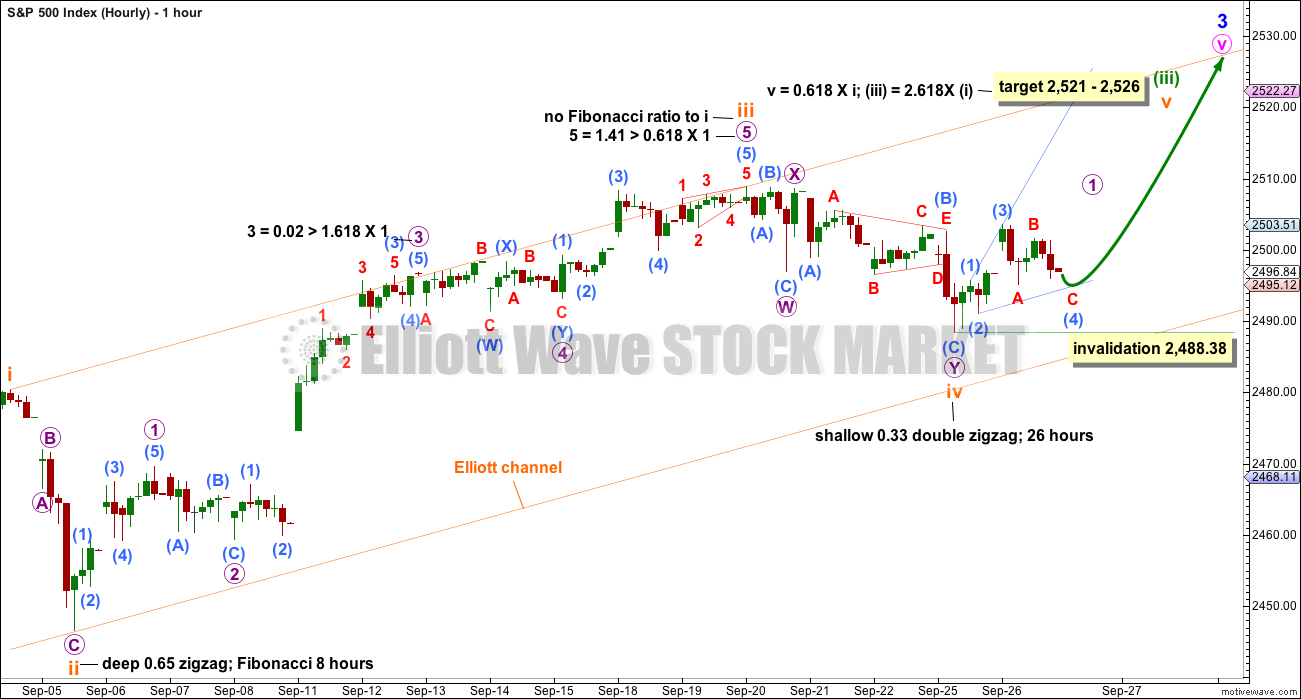
HOURLY CHART
Subminuette wave iv will fit as a completed double zigzag structure (all subdivisions fit on the five minute chart). There is still some alternation between the single zigzag of subminuette wave ii. There is good alternation in depth.
The target is recalculated and is now a 5 point zone.
If subminuette wave iv is over and subminuette wave v has now begun, then micro wave 2 may not move beyond the start of micro wave 1 below 2,488.38.
Micro wave 1 may be a leading expanding diagonal. Second wave corrections following first wave leading diagonals are usually very deep. Look for micro wave 2 to be very deep, deeper than the 0.618 Fibonacci ratio of micro wave 1.
ALTERNATE WAVE COUNT
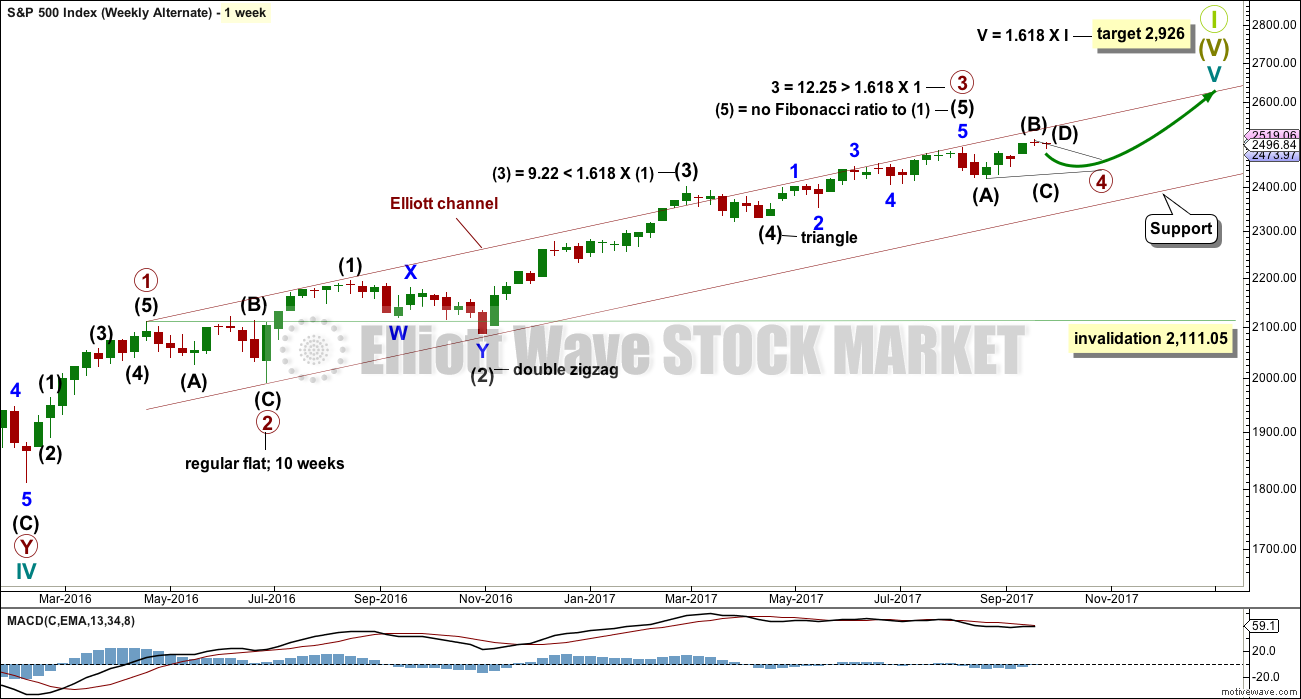
WEEKLY CHART
Primary wave 3 may be complete. Confidence may be had if price makes a new low below 2,480.38 now. That would invalidate the main wave count at the daily chart level. Fibonacci ratios are calculated at primary and intermediate degree. If primary wave 3 is complete, then it still exhibits the most common Fibonacci ratio to primary wave 1.
Primary wave 4 may not move into primary wave 1 price territory below 2,111.05.
Primary wave 4 should last about 8 weeks minimum for it to have reasonable proportion with primary wave 2. It is the proportion between corrective waves which give a wave count the right look. Primary wave 4 may last 13 or even 21 weeks if it is a triangle or combination. So far it may have completed its sixth week.
If primary wave 4 unfolds as a single or double zigzag, then it may find support about the lower edge of the maroon Elliott channel. If it is a triangle or combination, it may be more shallow, ending about mid way within the channel. At this stage, a single zigzag has been invalidated and a double zigzag is discarded based upon a very low probability. It looks like primary wave 4 is to be a very shallow sideways consolidation rather than a deeper pullback.
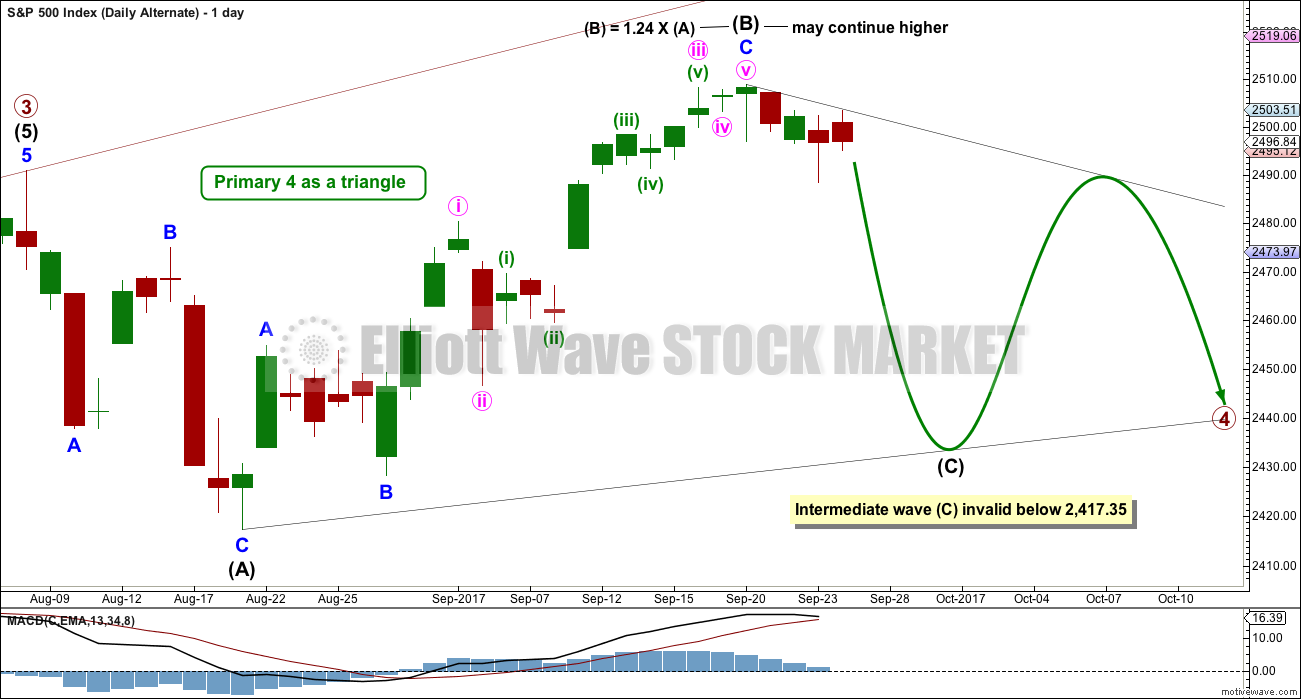
Only two daily charts are now published for primary wave 4: a triangle and a combination. It is impossible still for me to tell you with any confidence which of these two structures it may be. The labelling within each idea may still change as the structure unfolds.
The daily charts are presented below in order of probability based upon my judgement.
The final target for Grand Super Cycle wave I to end is at 2,926 where cycle wave V would reach 1.618 the length of cycle wave I.
DAILY CHART – TRIANGLE
This first daily chart will illustrate how price might move if primary wave 4 unfolds as a triangle.
Intermediate wave (B) may be a singlezigzag. One of the five sub-waves of a triangle should be a more complicated multiple; most commonly that is wave C. If intermediate wave (B) is correctly labelled as a single zigzag, then intermediate wave (C) may be a longer lasting and more complicated double zigzag.
The triangle may last a total of a Fibonacci 13 or 21 weeks.
Both intermediate waves (A) and (B) look like three wave structures.
Intermediate wave (C) may not move beyond the end of intermediate wave (A).
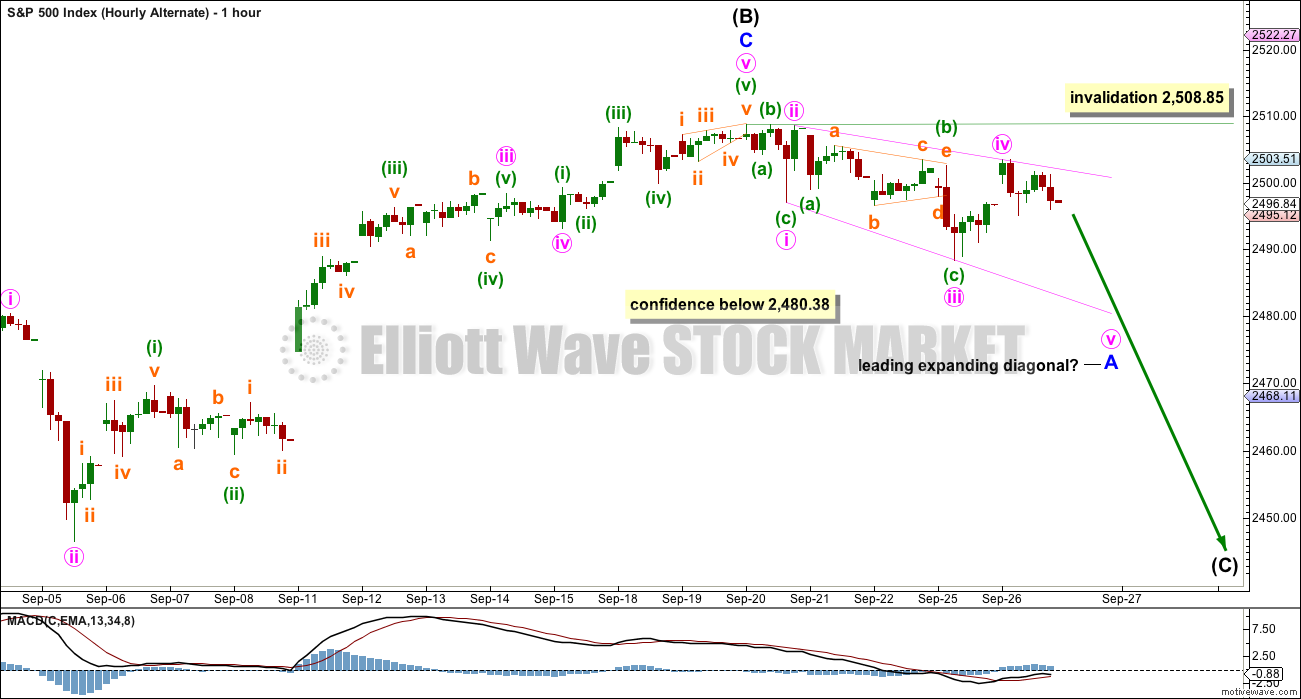
HOURLY CHART
If intermediate wave (B) is over, then a five down should develop at the hourly chart level. This has not yet happened.
With all the overlapping in downwards movement, over the last few days, an impulse no longer looks right. A leading diagonal is considered. This must slightly reduce the probability of this wave count because leading diagonals are not as common as impulses.
If minute wave iv of the diagonal is over, then minute wave v must reach beyond equality with minute wave iii. Minute wave v must end below 2,483.30.
When minor wave A is complete, then minor wave B may not move beyond its start above 2,508.85.
A new all time high may see this wave count entirely discarded if it is supported by volume.
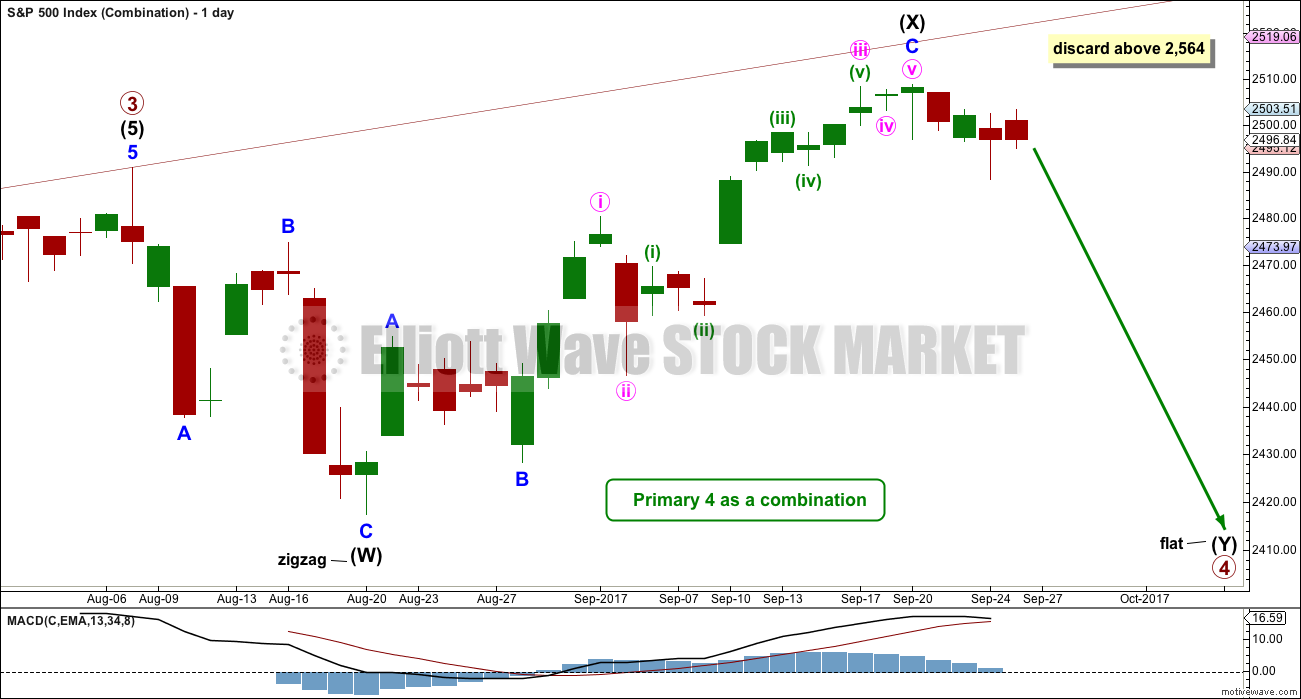
DAILY CHART – COMBINATION
A combination for primary wave 4 would still offer some alternation with the regular flat of primary wave 2. Whenever a triangle is considered, always consider a combination alongside it. Very often what looks like a triangle may be unfolding or may even look complete, only for the correction to morph into a combination.
There may only be one zigzag within W, Y and Z of a combination (otherwise the structure is a double or triple zigzag, which is very different and is now discarded). At this stage, that would be intermediate wave (W), which is complete.
Combinations are big sideways movements. To achieve a sideways look their X waves are usually deep (and often also time consuming) and the Y wave ends close to the same level as wave W.
This wave count sees upwards movement continuing as intermediate wave (X). Unfortunately, there is no Elliott wave rule regarding the length of X waves, so they may make new price extremes. I am applying the convention within Elliott wave regarding B waves within flats here to this X wave within a combination: When it reaches more than twice the length of intermediate wave (W), then the idea of a combination continuing should be discarded based upon a very low probability.
With intermediate wave (W) a zigzag, intermediate wave (Y) would most likely be a flat correction but may also be a triangle. Because a triangle for intermediate wave (Y) would essentially be the same wave count as the triangle for the whole of primary wave 4, only a flat correction will be considered.
But first, an indication would be needed that the upwards wave of intermediate wave (X) is over. As yet there is no evidence of this.
TECHNICAL ANALYSIS
WEEKLY CHART
Click chart to enlarge. Chart courtesy of StockCharts.com.
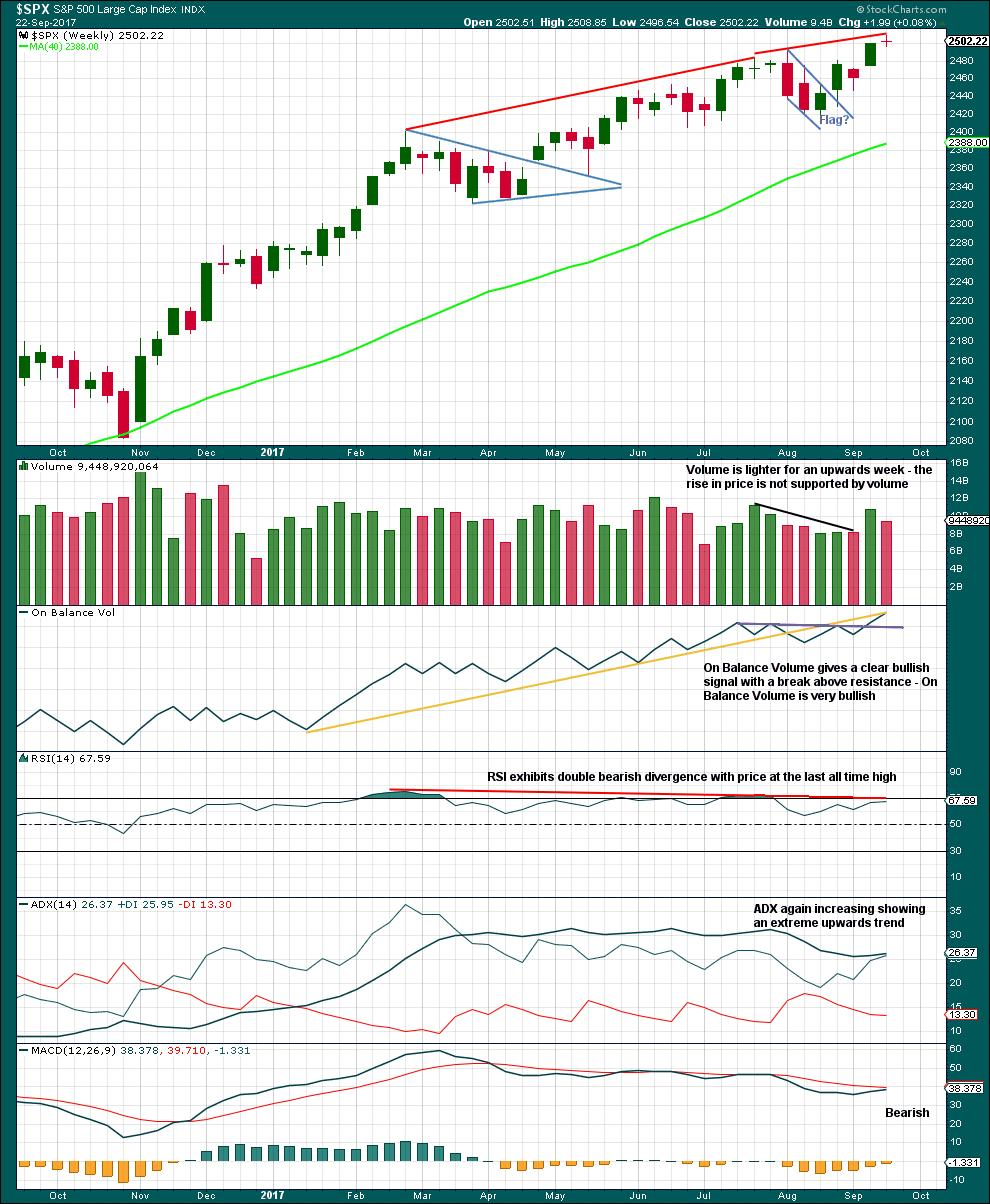
A strong weekly candlestick gaps higher and has support from volume. This looks like a classic upwards breakout after a small consolidation, and there may have been a small flag pattern in it. This supports the main Elliott wave count.
If the flag pole is taken from 2,405.70 to 2,490.87, then a target for the next wave up may be about 2,527.
The bullish signal from On Balance Volume is clear. It should be given reasonable weight. This supports the main Elliott wave count.
ADX is still just extreme. If the black ADX line crosses above the +DX line, then the upwards trend would no longer be considered extreme. RSI still exhibits double bearish divergence. This trend is extreme; beware that the alternate wave count may still be correct.
DAILY CHART
Click chart to enlarge. Chart courtesy of StockCharts.com.
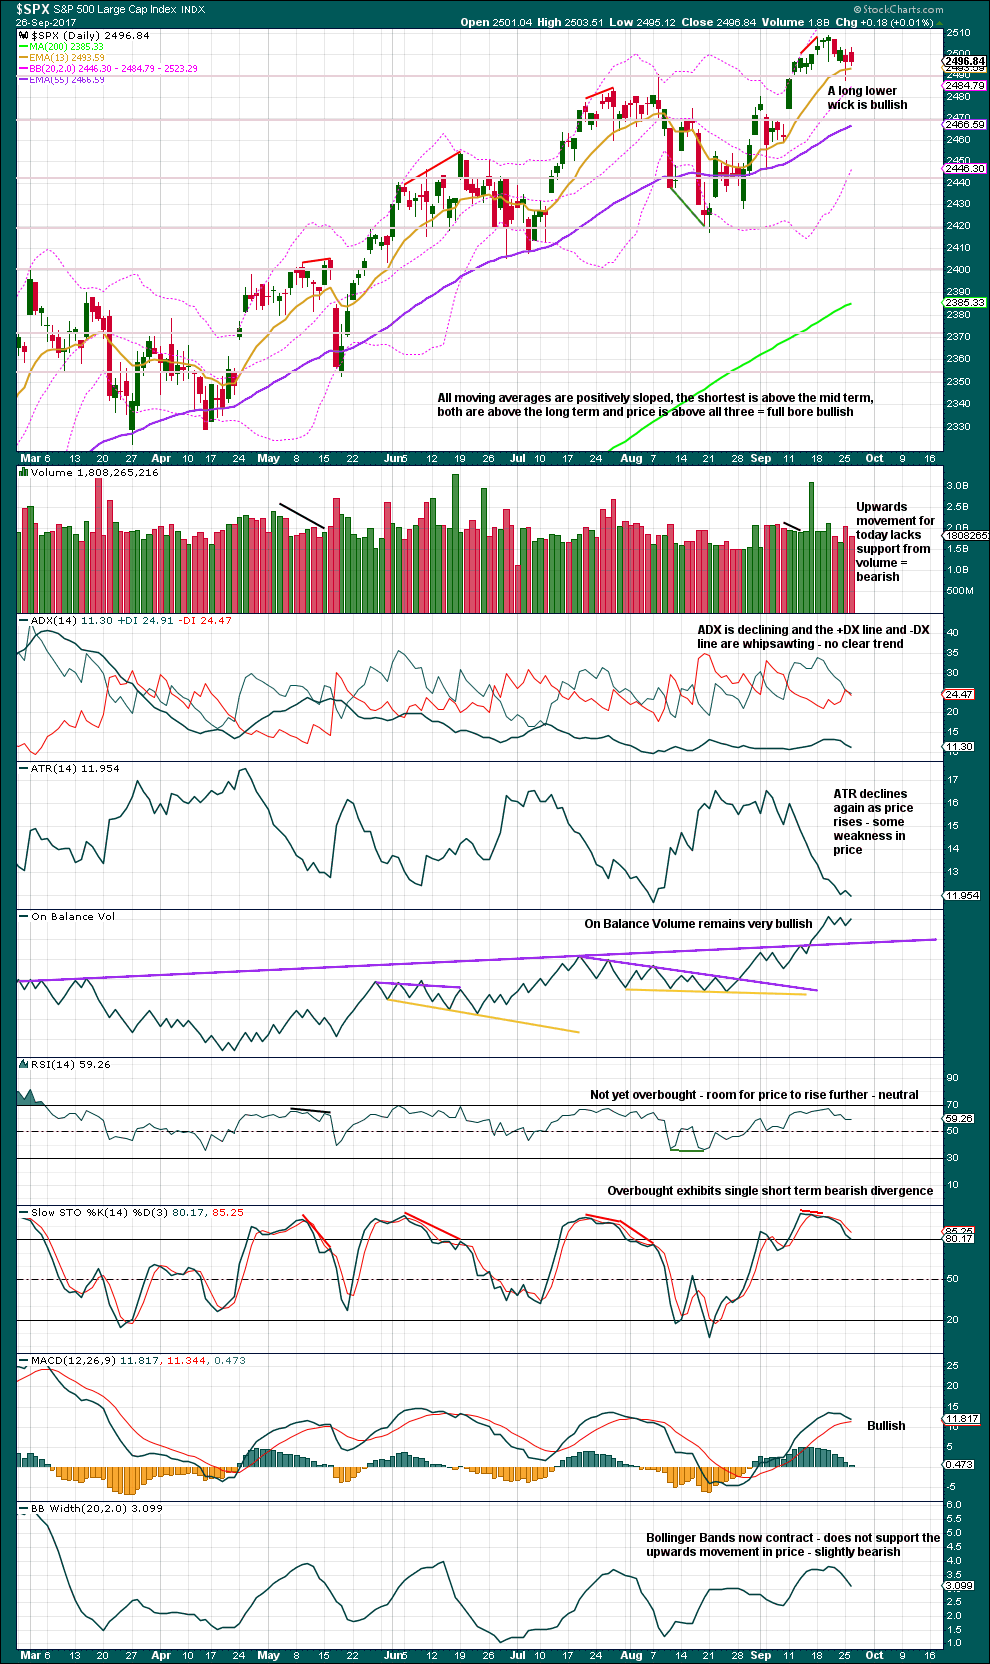
Yesterday’s long lower wick is now followed by an upwards day. Although today’s candlestick closes red, the balance of volume is upwards, in line with price. But lighter volume today did not support the rise in price during the session.
This chart is very mixed. It would be my judgement that On Balance Volume should be given weight here, so overall my judgement would be more bullish.
VOLATILITY – INVERTED VIX CHART
Click chart to enlarge. Chart courtesy of StockCharts.com.
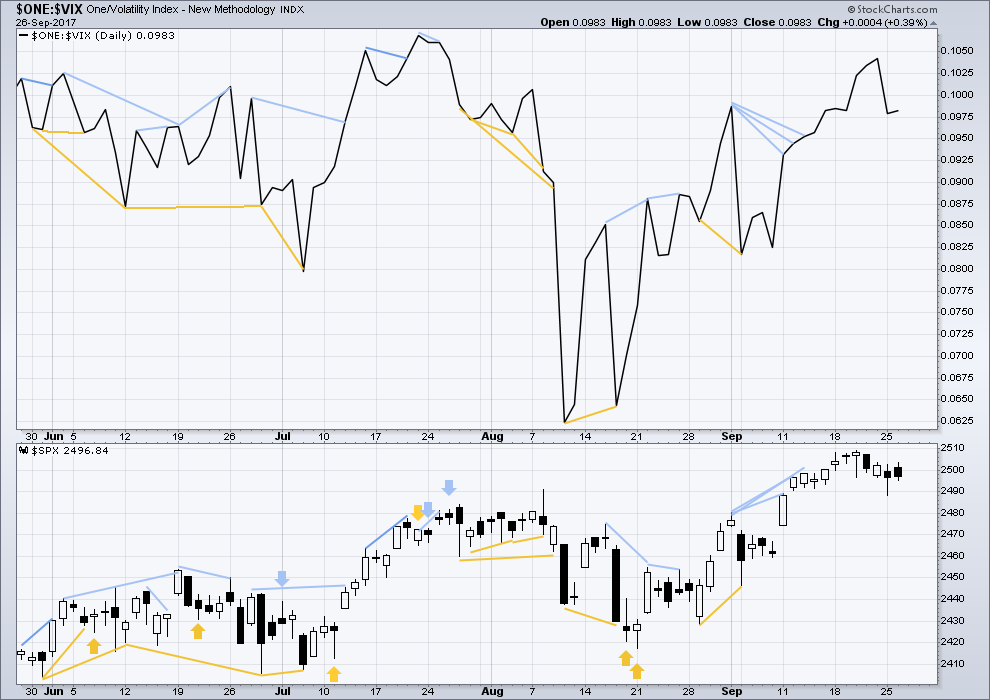
Normally, volatility should decline as price moves higher and increase as price moves lower. This means that normally inverted VIX should move in the same direction as price.
There is still mid and longer term bearish divergence, but it has been noted in the past that divergence over a longer term does not seem to work as well for VIX. Short term bearish divergence has disappeared.
There is no new short term divergence with price and inverted VIX.
BREADTH – AD LINE
Click chart to enlarge. Chart courtesy of StockCharts.com.
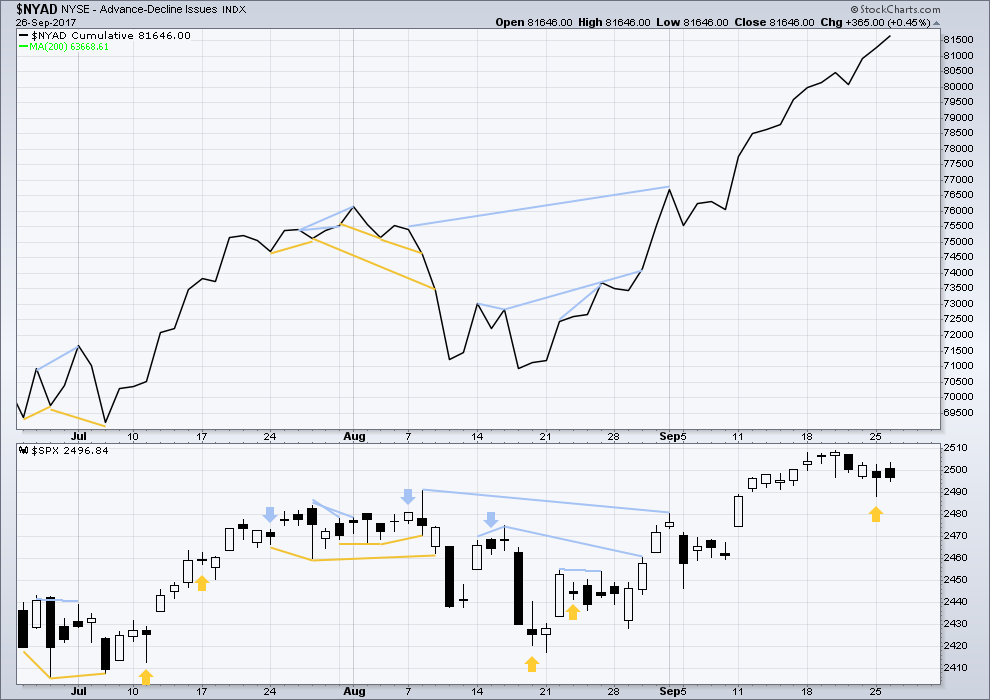
With the last all time high for price, the AD line also made a new all time high. Up to the last high for price there was support from rising market breadth.
There is normally 4-6 months divergence between price and market breadth prior to a full fledged bear market. This has been so for all major bear markets within the last 90 odd years. With no divergence yet at this point, any decline in price should be expected to be a pullback within an ongoing bull market and not necessarily the start of a bear market.
Another new all time high for market breadth today will be interpreted in line with Lowry’s analysis as bullish. The AD line can be a leading indicator; it may be used a similar way to On Balance Volume. This bullishness in market breadth supports the main Elliott wave count today.
DOW THEORY
The S&P’s new all time high last week is confirmed by DJIA and Nasdaq also making new all time highs. However, DJT has not yet made a new all time high, so the continuation of the bull market at this stage lacks confirmation.
The following lows need to be exceeded for Dow Theory to confirm the end of the bull market and a change to a bear market:
DJIA: 17,883.56.
DJT: 7,029.41.
S&P500: 2,083.79.
Nasdaq: 5,034.41.
Charts showing each prior major swing low used for Dow Theory are here.
Published @ 05:30 p.m. EST.

Note to Elliott Wave Stock Market Members: 27SEP17 @ 10:25 EST: Lara is on a plane to Hong Kong. In-flight wifi access was meant to be provided, but it appears wifi access is unavailable because I have not received any messages from Lara yet. Therefore, the probability she will be able to publish any analysis today is low. If the status changes, I will update this message. Thank you for your understanding. Cesar
Note to Elliott Wave Stock Market Members: 28SEP17 @ 06:07 EST: Lara is in Hong Kong. She is now preparing the analysis to publish before New York session opens. Thank you for your understanding. Cesar
It sure is looking like we have an analog of the price action from July 25 to August 8. If this turns out to be the case we will not get a turn until the session closes on Monday.
I’m about to board my flight to Hong Kong 🙂
I should have an internet connection, but if by chance it is not good enough to allow me to connect to data or upload charts to the website then there is a possibility that I may not be able to publish your analysis today.
I will make every effort to do so. I will after all have 14 hours to fill…
Have a great time in Hong Kong Lara!
An absolutely beautiful city, both the people and the surroundings!
Great place to buy Gold as premiums are low!
Also an easy place to open a second bank account without too much hassle and a ton of cash. 🙂
The idea generally I think, is to spend the cash in HK… 🙂 🙂 🙂
That works as well! 🙂
Updated hourly chart:
I’m not entirely happy with the diagonal, the overshoot of the 2-4 trend line within the fifth wave doesn’t look quite right. I need to spend some time on the 5 minute chart to check subdivisions, it may be an impulse?
Anyhoo… the trend looks to be up, and the end of this session looks like a fairly decent small third wave so far. So far so good.
TICK…TICK…TICK…
Just 2 Trading Days left until October 1st and that Sucking sound of Liquidity being drawn out of markets!
You don’t think the impacts of that are already properly priced in? The market is an awfully effective discounter of the near future.
Nope! Nobody believes that this will have an effect, “it’s too small to have an effect… they say,” and nobody believes the Fed will follow through.
So NOPE!… not priced in.
Tim Knight is opining that a lot of the giddiness today is being spurred by all that talk about tax reform, re-patriated profits, lots of new jobs etc. etc.
Have these optimistic folk been observing the same Congress that I have??!!
Never under estimate the gullibility of the herd…. 🙂
Selling half my SPY 249.50 calls expiring on Friday. VIX bouncing smartly off new low printed on the last cash dump. I would not be surprised to see it clamber back above 10 prior to the close…
My current take on the situation. If you have an alternative I’d like to see it! I like it when the wave structure plays out so perfectly per Hoyle (or should I say, per Lara?!). If correct, we’ve got a small 4 and 5 coming, then a larger 4, etc…
Boy they sure thrashing around aren’t they??!! 🙂
Has Yellen already announced QE5??!!
The endless bankster meddling is resulting in the EW waves unfolding in a very protracted manner. This can make it extremely difficult to be confident about what is going on as the pace is so maddeningly slow. If we are about to see some sort of third wave down, VIX absolutely has to clear at least 11.50 by the close or that theory bites the dust…big time!! 🙂
Heads up, Q is in a killer uptrend for a few years on the weekly, and is well pulled back on the weekly and daily. Just getting some steam now back up, out of a squeeze on the daily and hourly. Also, a >50% of average volume spike on the current hourly bar.
FSLR also strong on the weekly, bouncing off the lower bollinger on the daily, and in a squeeze on both the daily and the 5 minute. ALGN, generally similar story, bouncing on the daily off the 21 EMA. The weekly is virtually straight up, meaning, eventually a precipitous fall, but meanwhile…
ADI as well (waiting for a pullback to enter that one). Hey, we be getting some 3 of a 5 of a 1 action now!!!! Awwwwwesome. (Did I say I’m long??)
You did indeed!
I must say I STILL smell a rat.
Don’t get me wrong. I am still holding SPY calls ahead of a fall of 2470 but it all looks just a bit too cute!! 🙂
Five down, three up…!
I think the bears are gong to temporarily smash the 2500 pivot and the bulls will make another stand just about around 2470….
Many opinions make a market. My outlook is bullish, based on the weekly, Lara’s technical analysis, the scent of tax cuts, and the continued “correct” playing out of the wave count on the hourly main today. But things could change fast I suppose, particularly if the US launches a strike on NK, which may be the only way Trump can try to preserve his presidency in the face of the criminal investigations. He’ll do it in a heartbeat if he thinks the ratings will be good. I’m thinking of just holding a moderate short “all the time” because it will happen in non-market hours, and the market will open down several hundred points. It’s not a bad insurance play (hedge, of the black swan variety), perhaps. Your thoughts on that, and what means might be best for said “insurance”?
My thoughts would be the stop would have to be just above the last ATH. And you’d have to be ready to take a loss every day.
Manage the loss, only 1% or less of equity on each short, would be my advice.
I agree. While the wave count is bullish, we simply cannot afford to completely ignore some very extreme readings in the market. It has also always been my opinion that we would not see a real turn during the regular session but in overnight futures and that is exactly the way I have been trading it – strictly short scalps on both directions. I am still holding a reasonably sized short position and have been regularly taking profits on my long vol trades.
My wife and two daughters are Catalan citizens. That territory has always been culturally distinct (including language) from the rest of Spain and what Rajoy is doing to those folk is like playing with dynamite. The Catalan people are hard-working, independent, and very culturally and nationally conscious of their distinctiveness from the rest of Spain. The Spanish government already went through this idiocy with the Basque people and it would seem as if they have not learned much. Very sad how they are handling this and Trump seems to be totally clueless as regards that region’s history.
Iriarte comes from the Basque region of Spain, apparently. Not my original name though of course.
The only decent thing to do IMO if a people want independence, and they express that desire within a democracy, is to let them have it.
I agree with you in general, and on general principles. Lincoln didn’t agree with you here in the US back in the 1860’s though. I believe that was all about making sure the south would be open to the northern business interests (all the south had at the time was agricultural, profitable because of slavery). (Those who think the civil war was prosecuted to end slavery are sadly uninformed. Lincoln made that clear himself in his writings.) Similarly, if CA wanted to exit the union, it will never be allowed, not just because the US constitution doesn’t allow for it (it doesn’t), but because the profit impacts of a separate nation in charge of the wealth and production and the markets of the state are unacceptable to the real rulers of the US (the US/multi-national corporations).
Per the main hourly, we’ve done a 1 of the 5 up, and now are doing the 2 down. 2496 is the limit or it exceeds the bottom of 4 (and if that happens I’m really scrambling!!). Once the market turns here, should be in a 3 of 5 and we should get renewed upside. Assuming we are in the main hourly. I view that as changeable minute by minute, for example, if war with NK breaks out, it’s off to the alternate weekly real fast I’d guess.
These choppy overlapping waves in the market are definitely not impulsive looking, as least not to me. Very strange price action…very strange indeed. Of course we have seen this kind of behaviour before and choppy does not preclude a continued run higher….
Indeed!! When I look at my 4 timeframe charts of SPX, I see the WEEKLY in an uptrend. The DAILY is neutral. The HOURLY is neutral. The 15 MINUTE is in a downtrend. A state of indecision I’d say, with the preponderance of the evidence (the weekly uptrend) being “uptrend”, overall. However, if that daily goes red…look out below, 2460 or lower. And to my mind, the low today is a critical level, very very close by, that may just give an early signal of the change in the weather. Because as we know, the bull count requires up here. Yup, 2500 continues to be the critical pivot, and it ain’t decided yet!
What is really amazing is how the bears are just sitting there, looking at the bulls and telling ’em…”Go for it!” It is like watching a coiling spring.
This is going to get real interesting if anything, anything at all, spooks this market, or the bears decide to apply a bit of selling pressure….
I believe SPX is in a 3 of a 5 of a 1 (hourly level). Meaning, breaking down here would be utterly “wrong” per the main weekly/daily/hourly. Again, the low today is my critical level. Below that and I will start a short campaign. Meanwhile…I’ve got plenty of longs, and looking to find and add more. The sniff of tax cuts is what is driving this market, IMO, and probably has been the major driver all year long. Now the scent is becoming real.
Well. it seems Google and Amazon are in a bit of a kerfluffle. Amazon stripped out some of Youtubes ad features like channel subscriptions and video recommnedations from Echo and Google had a hissy fit over their loss of control.
I’m watching that Google “forever” trend line. If that’s broken…. I expect it may fall off a cliff. So far it’s holding.
As expected, yet another pathetic display….enough already! 😀
There is something greatly amusing in observing the strenuous market contortions promulgated by banksters trying to nullify the mean reversion principle…I think a big move is coming… ;
Remarkably, they offered up a second shot at sub ten VIX this morning!
There is starting to be an air of desperation about market price action. Sucessive days with gap up opens that go absolutely nowhere, and the bears are not even trying…! Yikes!
Adding to long vol positions on sub 10 VIX courtesy of bankster machinations. 🙂
That 9.67 low on VIX this morning be be the low for quite some time!
It’s such a gift at these levels!!
Surprise, surprise! Frau Yelling now concedes being “puzzled” by chronically low inflation and admits she “may have been wrong”. Oh really now? There goes the December rate hike!
Get ready. Next will be a sheepish walk-back of all that balance sheet reduction talk.
Does anybody else get the feeling that we are being played??!! 🙂
Market manipulators are also market participants. They can’t recind the EW principle. I’m trading the price action that’s in front of me today.
I agree. Trade what you see. I also like to keep in mind what the great Gretsky said about the way he played the puck….!
Also made possible by judicious application of EWP…
Exactly my view too Curtis.
The Balance Sheet Reduction will take place! That is a 100% Certainty!
2 1/2 Trading Days left until October 1st and that Sucking sound of Liquidity being drawn out of markets!
TICK…TICK…TICK…
You may have a point there Joe but I suspect for reasons different from mine.
It could well be tha Frau Yellen’s handlers have instructed her to get out of Dodge while the getting’s still good! 🙂
well ok,, I will take it
I was pretty fast today! Maybe everyone else went off to have a wee rest….