Last analysis offered a warning in the summary that price may move higher, and may make a new all time high. This is what has happened today.
Summary: Again, there is still zero evidence that upwards movement is over. There is still no candlestick reversal pattern nor long upper wick. Price may still move higher before it turns. On Balance Volume is very close to strong resistance. If upwards movement continues, it may not be by much and it may only be for one more day.
This upwards swing is still expected to end here or very soon. The next swing downwards may find support about 2,420.
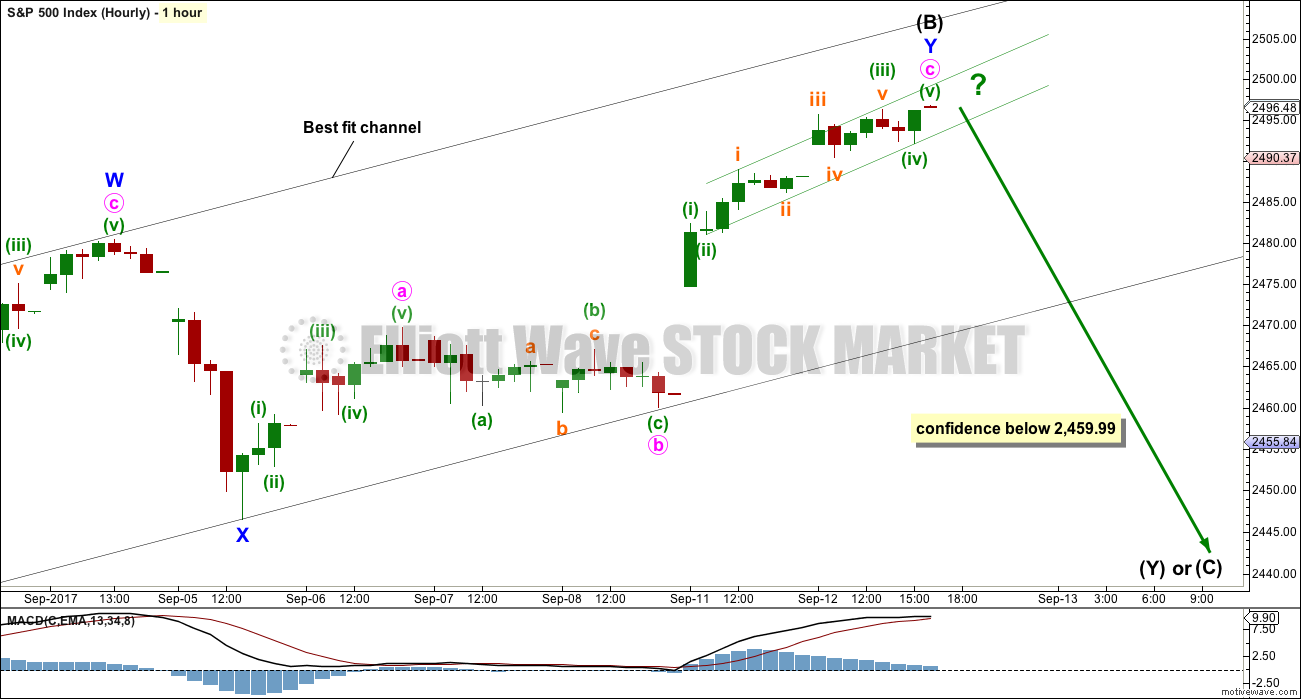
In the short term, a new low below 2,459.99 would add confidence to the view that the upwards swing is indeed over and the next swing downwards has begun.
Last monthly and weekly charts are here. Last historic analysis video is here.
ELLIOTT WAVE COUNT
WEEKLY CHART
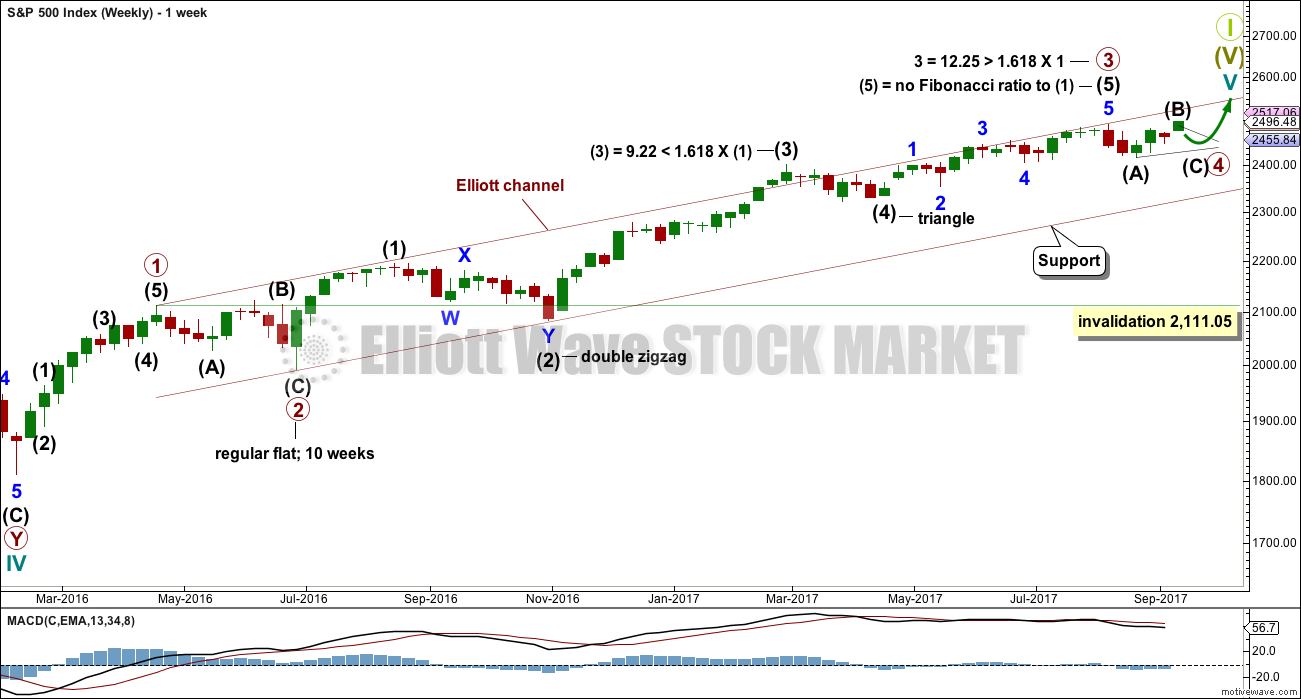
Primary wave 3 now looks complete. Further and substantial confidence may be had if price makes a new low below 2,417.35 now. That would invalidate a new alternate published below. Fibonacci ratios are calculated at primary and intermediate degree. If primary wave 3 is complete, then it still exhibits the most common Fibonacci ratio to primary wave 1.
Primary wave 4 may not move into primary wave 1 price territory below 2,111.05.
Primary wave 4 should last about 8 weeks minimum for it to have reasonable proportion with primary wave 2. It is the proportion between corrective waves which give a wave count the right look. Primary wave 4 may last 13 or even 21 weeks if it is a triangle or combination. So far it may have completed its fourth week.
If primary wave 4 unfolds as a single or double zigzag, then it may find support about the lower edge of the maroon Elliott channel. If it is a triangle or combination, it may be more shallow, ending about mid way within the channel. At this stage, a single zigzag has been invalidated and a double zigzag is discarded based upon a very low probability. It looks like primary wave 4 is to be a very shallow sideways consolidation rather than a deeper pullback.
Only two daily charts are now published for primary wave 4: a triangle and a combination. It is impossible still for me to tell you with any confidence which of these two structures it may be. The labelling within each idea may still change as the structure unfolds.
The daily charts are presented below in order of probability based upon my judgement.
The final target for Grand Super Cycle wave I to end is at 2,500 where cycle wave V would reach equality in length with cycle wave I. If price reaches the target at 2,500 and either the structure is incomplete or price keeps rising, then the next target would be the next Fibonacci ratio in the sequence between cycle waves I and V. At 2,926 cycle wave V would reach 1.618 the length of cycle wave I.
DAILY CHART – DETAIL
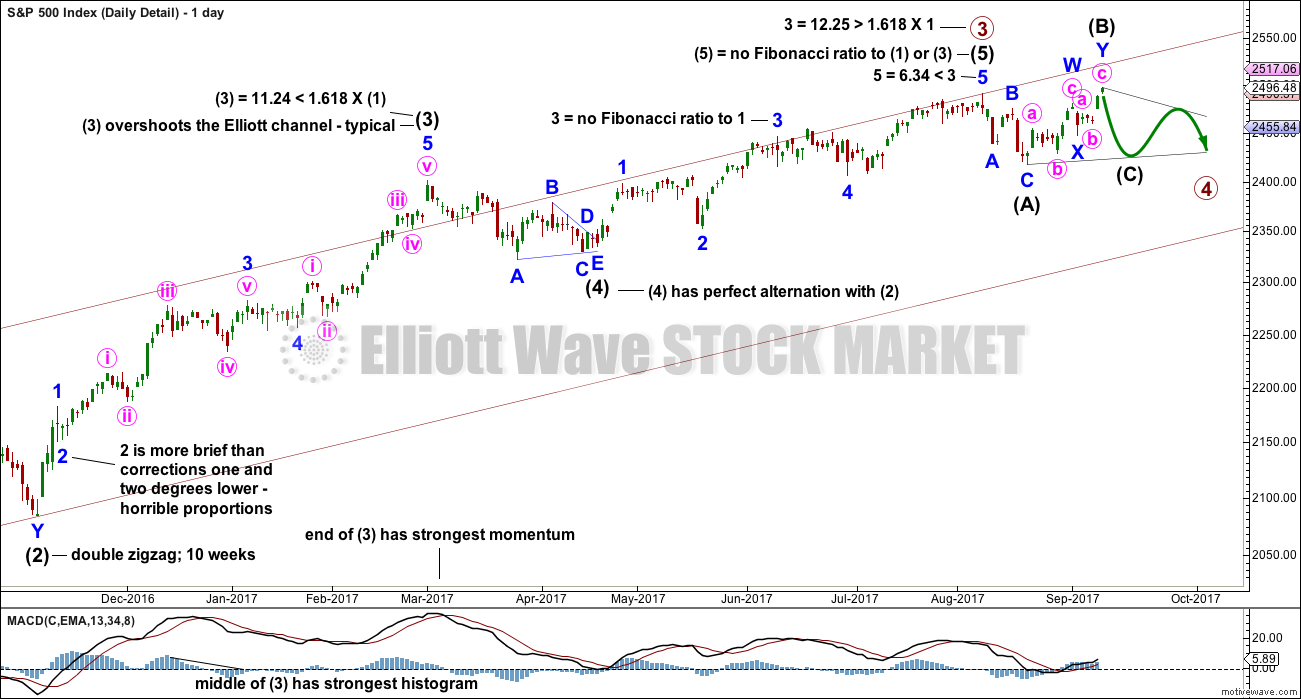
In order for members to compare and contrast this main wave count with the new alternate published below, it is necessary to publish a chart showing all movement from the low labelled intermediate wave (2), which is shown on the weekly chart. I would not want to try and see any alternate which does not have primary waves 1 and 2, and intermediate waves (1) and (2), in any other position than that labelled on the weekly chart. Any variation should be taken from that point.
This wave count fits with MACD. The end of a third wave is very often the strongest portion of MACD, and the middle of the third wave is very often the strongest portion of the histogram on MACD. In this way MACD can be used to assist in labelling an impulse.
It is very common for the S&P to exhibit Fibonacci ratios between only two of its three actionary waves within an impulse . Rarely will it exhibit Fibonacci ratios between all three actionary waves. The lack of a Fibonacci ratio for intermediate wave (5) and for minor wave 3 within it is entirely acceptable.
This wave count also fits neatly with the Elliott channel. It is extremely common for the end of a third wave within an impulse to overshoot the Elliott channel, because it is usually the strongest portion of movement.
This wave count has a neat fit in terms of subdivisions and fits with most common behaviour for this market. For this reason I have confidence in it.
The only problem here is one of proportion for minor wave 2 within intermediate wave (3). But then the S&P does not always exhibit nice proportion between its corrective waves.
DAILY CHART – TRIANGLE
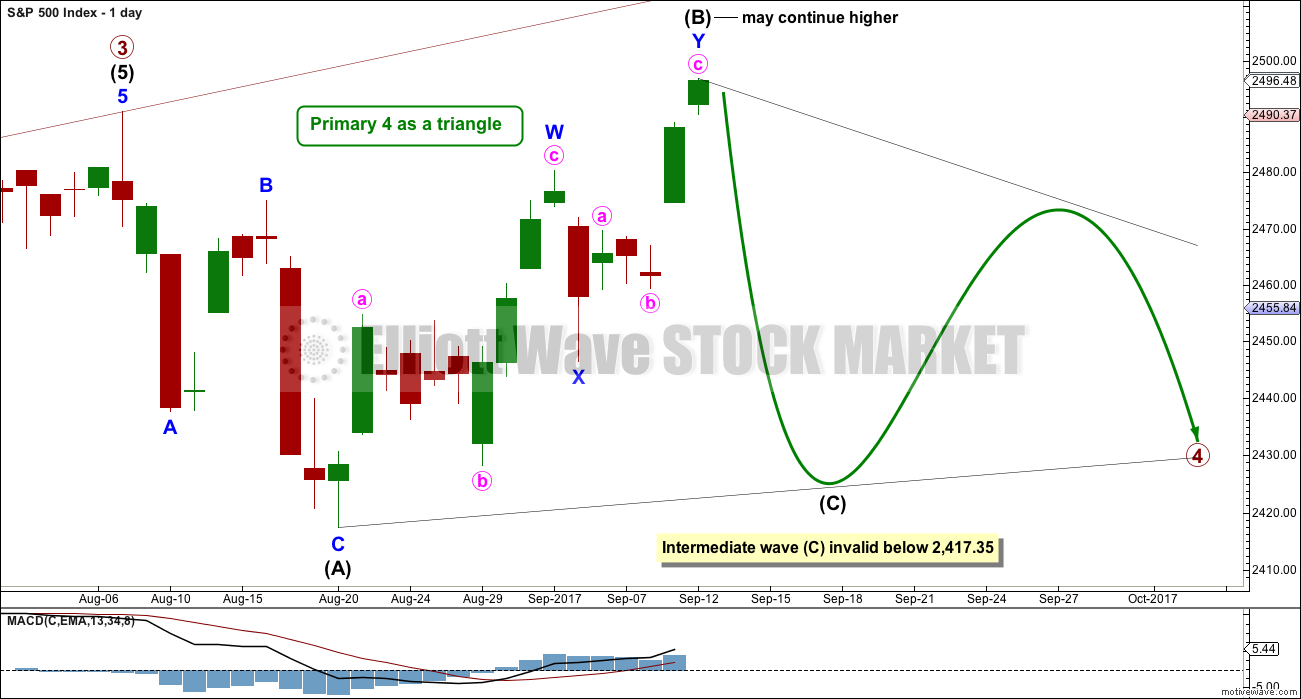
This first daily chart will illustrate how price might move if primary wave 4 unfolds as a triangle.
Intermediate wave (B) may be continuing higher as a double zigzag. One of the five sub-waves of a triangle should be a more complicated multiple; most commonly that is wave C, but it may be any sub-wave. Intermediate wave (B) has made a new all time high, so it may be a running triangle.
The triangle may still last a total of at least eight weeks, and possibly longer. If longer, then a Fibonacci 13 or 21 weeks may be expected.
Both intermediate waves (A) and (B) look like three wave structures.
Intermediate wave (C) may not move beyond the end of intermediate wave (A).
HOURLY CHART – TRIANGLE
A double zigzag may be complete for intermediate wave (B).
Use the best fit channel. If price breaks below the lower edge, then expect the upwards swing is over and the next swing down has begun. While price remains within this channel, then it is entirely possible price may continue higher tomorrow; minute wave c may not be complete.
A smaller channel is drawn about minute wave c using Elliott’s second technique. If price breaks below this channel tomorrow, then it would be the earliest indication possible of a trend change. Expect price to keep rising while it remains within this channel. However, this channel is narrow, steep and not long held. It does not offer good technical significance. A breach of the channel is an early warning but cannot offer any reasonable confidence in a trend change. For that a breach of the wider black channel is required.
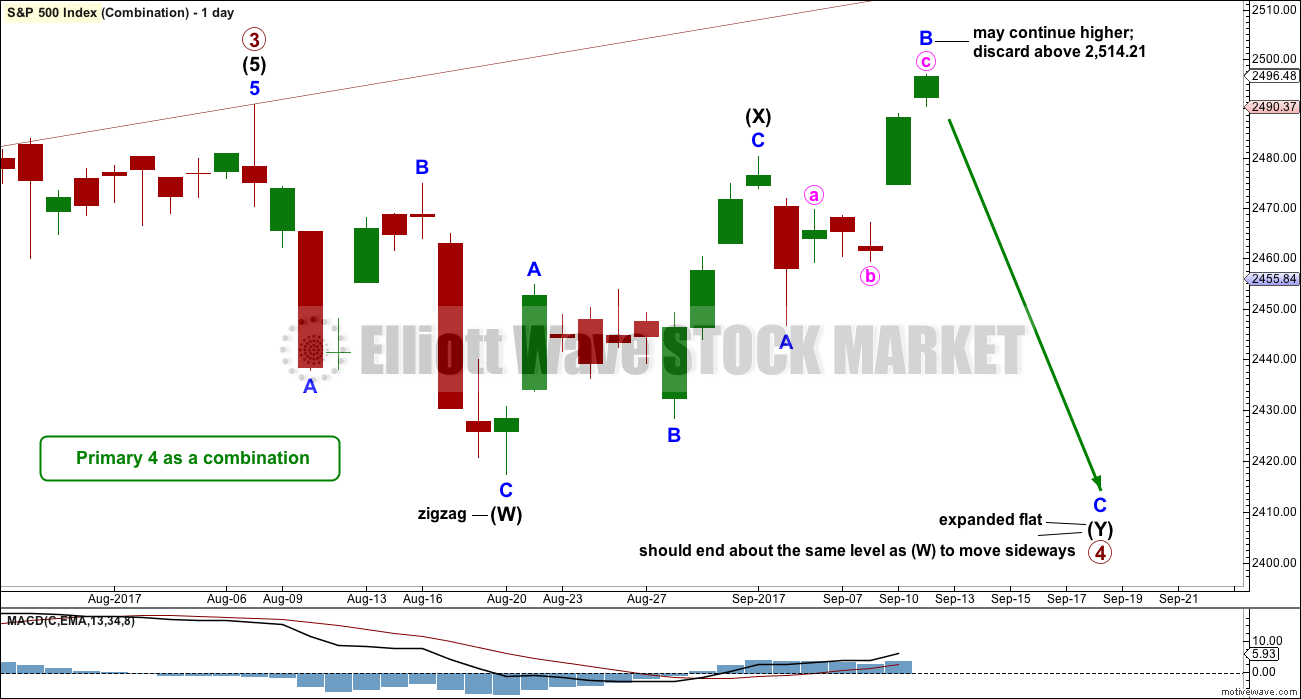
DAILY CHART – COMBINATION
A combination for primary wave 4 would still offer some alternation with the regular flat of primary wave 2. Whenever a triangle is considered, always consider a combination alongside it. Very often what looks like a triangle may be unfolding or may even look complete, only for the correction to morph into a combination.
There may only be one zigzag within W, Y and Z of a combination (otherwise the structure is a double or triple zigzag, which is very different and is now discarded). At this stage, that would be intermediate wave (W), which is complete.
Combinations are big sideways movements. To achieve a sideways look their X waves are usually deep (and often also time consuming) and the Y wave ends close to the same level as wave W.
Here, intermediate wave (X) is very deep.
Intermediate wave (Y) may be a flat correction or a triangle. A flat correction should be expected for intermediate wave (Y).
Intermediate wave (Y) may be unfolding as an expanded flat, the most common variety. So far minor wave B may be a 1.48 length of minor wave A, within the most common range of up to 1.38. If minor wave B reaches twice the length of minor wave A at 2,514.21, then the idea of an expanded flat should be discarded based upon a very low probability.
It is also possible that intermediate wave (X) is continuing higher as a double zigzag, as labelled on the triangle daily chart. While waves W, Y and Z within combinations may only be simple corrections labelled A-B-C (or A-B-C-D-E as in the case of triangles within combinations), the X waves within combinations may be any corrective structure including multiples. However, while this is valid, it is fairly unusual. I am always uncomfortable with labelling X waves as multiples until price proves in hindsight that they were, because of the low probability.
Minor wave C should move below the end of minor wave A. This structure may take another few weeks to complete.
With the new all time high today, the idea of a double zigzag as published up until yesterday will no longer be considered. It remains technically viable, but the depth of the possible X wave now gives it an exceptionally low probability. Double zigzags should have a strong slope and to do that their X waves are almost always brief and shallow.
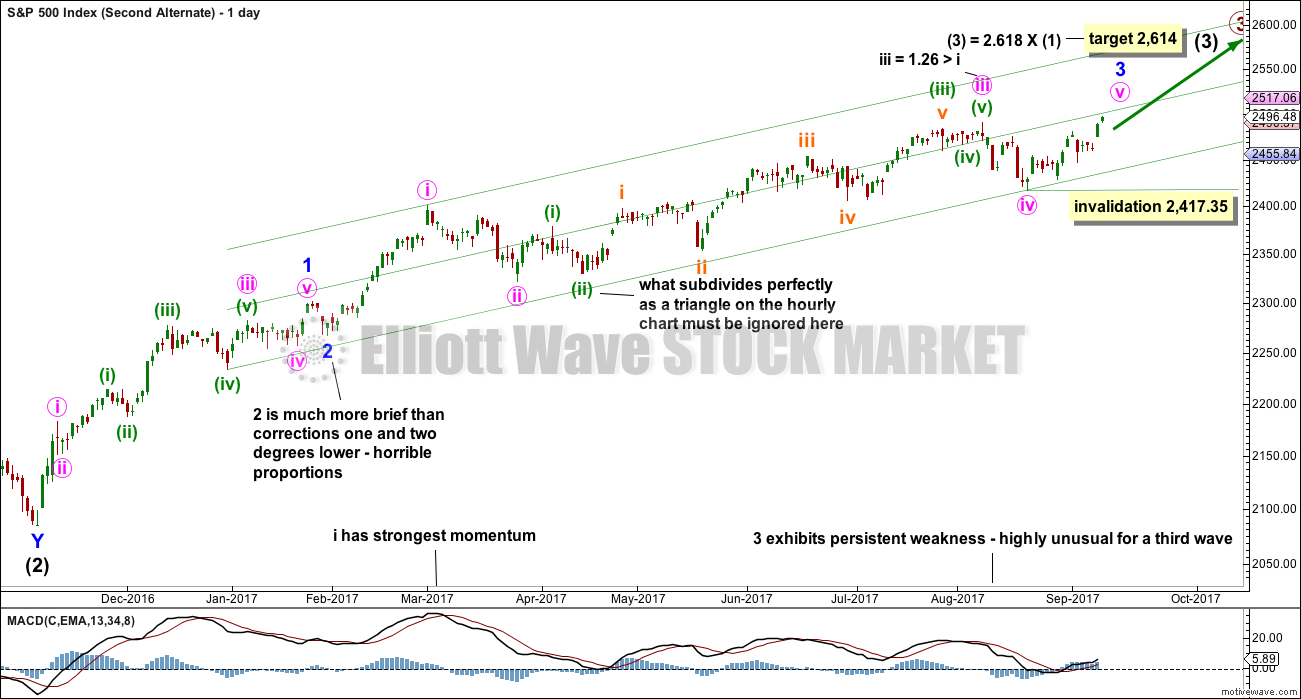
DAILY CHART – ALTERNATE
This alternate is new in response to concerns from members that primary wave 3 may not be over.
If primary wave 3 isn’t over, then how would the subdivisions fit? Would it fit with MACD? What would be the invalidation point and would the Fibonacci ratios be adequate?
Of several ideas I have tried today, this one has the best fit in terms of subdivisions and meets all Elliott wave rules.
However, this wave count is manufactured and forced. It does not fit with MACD. Because this possible third wave, if it is not over, exhibits long term and persistent weakness this wave count must be judged to have a very low probability. It is published primarily to illustrate why confidence is had in the main wave count. This wave count is not supported by the classic technical analysis given below, both at the weekly and daily chart levels, particularly the bearish signals recently given by On Balance Volume.
A target is provided for members who find that this wave count may fit with their own technical analysis, should they wish to attempt to trade an expected upwards movement.
Within minute wave v, no second wave correction may move beyond the start of its first wave below 2,417.35.
TECHNICAL ANALYSIS
WEEKLY CHART
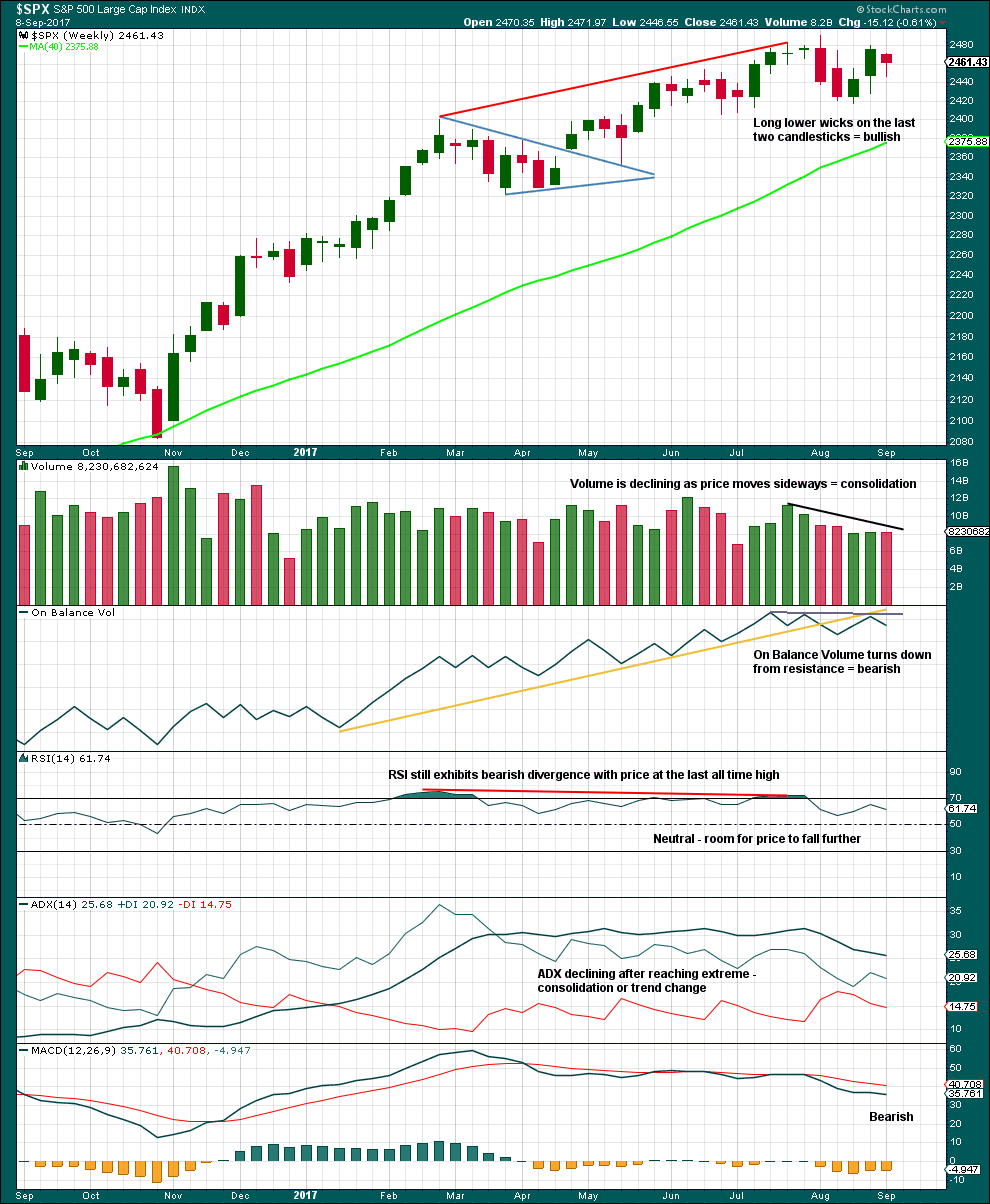
Click chart to enlarge. Chart courtesy of StockCharts.com.
An inside week closes red and the balance of volume was down. Volume shows a slight decline; during the week, the market fell very slightly of its own weight. This will be read as neutral; the slight decline in volume is very small.
Overall, this chart is bearish. Give reasonable weight this week to the bearish signal from On Balance Volume because it supports the Elliott wave counts.
DAILY CHART
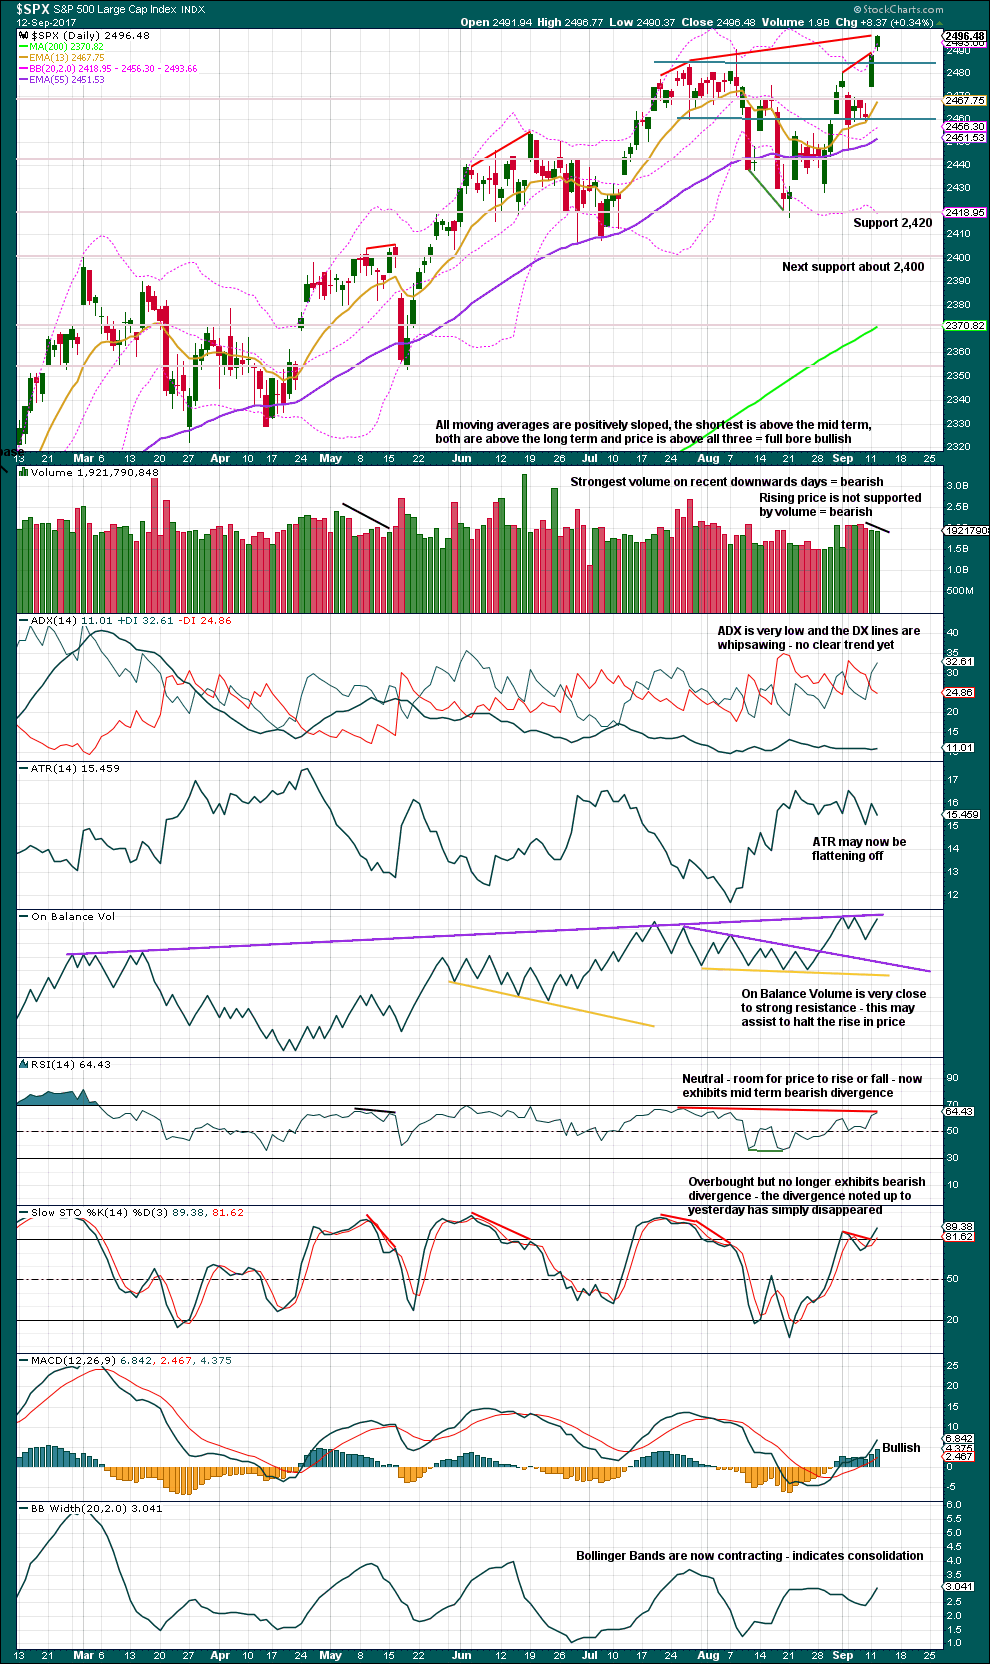
Click chart to enlarge. Chart courtesy of StockCharts.com.
We have an upwards breakout today to a new all time high, but it does not have support from volume. Upwards breakouts that are not supported by volume are suspicious. Be suspicious of this one.
However, it is noted that fairly recently on this chart there is evidence of a sustained upwards bull wave that began with weak and declining volume back on the 18th and 19th of May. Those two daily candlesticks also had long upper wicks suggesting bearishness, yet price continued to drift higher before finally turning into a sideways consolidation 10 sessions later. It is possible that may happen again. At this time, this market is exhibiting some highly unusual characteristics, such as the ability to drift higher on light and declining volume. This does make technical analysis and trading so much more difficult.
On Balance Volume suggests it may not though. I always give reasonable weight to signals from On Balance Volume with trend lines as it tends to work well much more often than it fails (although it can fail, nothing in technical analysis is 100% certain). We may see a slight new high tomorrow. There, On Balance Volume may halt the rise in price and force a turn.
While volume is declining as price rises, volume for the last two upwards days is still stronger than a fair number of recent upwards days.
Mid term bearish divergence with price and RSI, and price and Stochastics, also indicates weakness today.
VOLATILITY – INVERTED VIX CHART
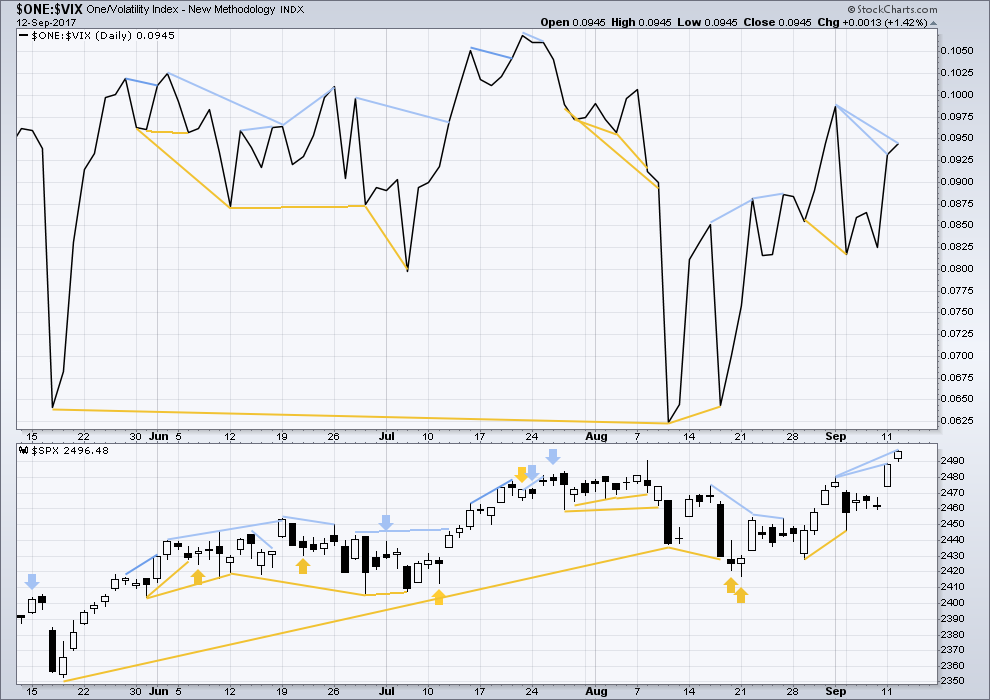
Click chart to enlarge. Chart courtesy of StockCharts.com.
Normally, volatility should decline as price moves higher and increase as price moves lower. This means that normally inverted VIX should move in the same direction as price.
Regular bearish divergence between price and inverted VIX noted yesterday has not been followed by any downwards movement, so it is considered to have failed.
With the new high today from price, there is still regular bearish divergence between price and inverted VIX. The new high in price does not come with a corresponding normal decline in market volatility, so there is weakness within price.
BREADTH – AD LINE
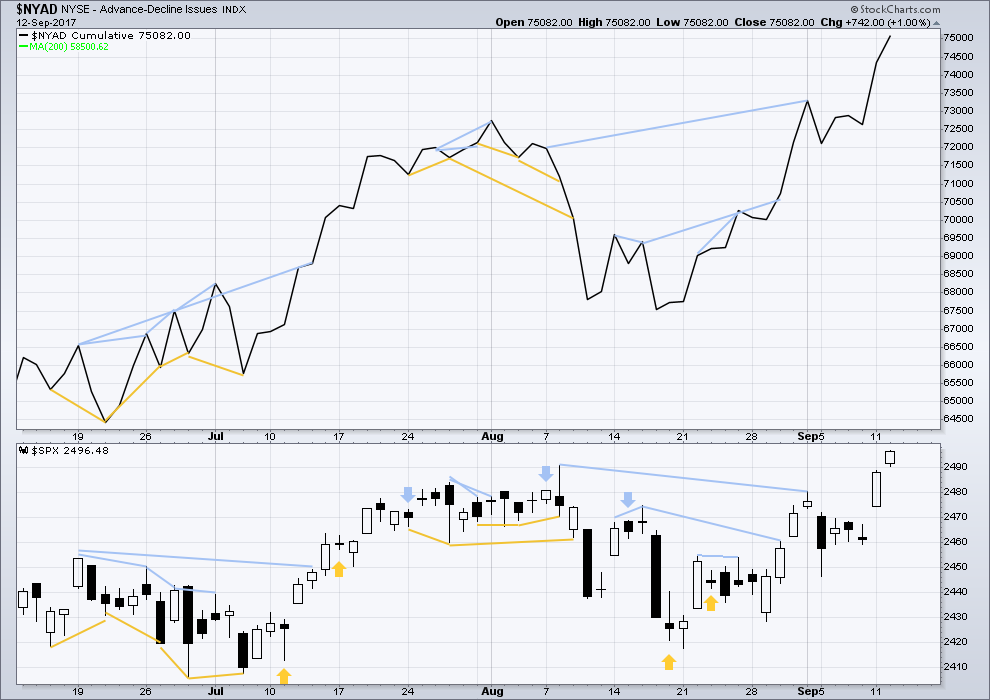
Click chart to enlarge. Chart courtesy of StockCharts.com.
With the last all time high for price, the AD line also made a new all time high. Up to the last high for price there was support from rising market breadth.
There is normally 4-6 months divergence between price and market breadth prior to a full fledged bear market. This has been so for all major bear markets within the last 90 odd years. With no divergence yet at this point, any decline in price should be expected to be a pullback within an ongoing bull market and not necessarily the start of a bear market.
There is no new divergence today between price and the AD line. The new high today for price has support from rising market breadth.
DOW THEORY
The S&P500, DJIA, DJT and Nasdaq have all made new all time highs recently.
Modified Dow Theory (adding in technology as a barometer of our modern economy) sees all indices confirming the ongoing bull market.
The following lows need to be exceeded for Dow Theory to confirm the end of the bull market and a change to a bear market:
DJIA: 17,883.56.
DJT: 7,029.41.
S&P500: 2,083.79.
Nasdaq: 5,034.41.
Charts showing each prior major swing low used for Dow Theory are here.
Published @ 08:30 p.m. EST.

I see you’ve already figured out the possible ending diagonal…
Thanks Olga for the chart 🙂
In the last couple of minutes it looks like subminuette v of that possible diagonal has shot up strongly to slightly overshoot the i-iii trend line. If this is a diagonal then it’s over now.
nope… now the overshoot looks too strong….
Anyway to see that choppy lateral movement as a fourth wave triangle with a 5th Wave left to go
No 🙁 It doesn’t meet the rules for EW triangles, specifically wherever you’d put wave D would be well above wave B. Too much higher for a barrier triangle.
It just won’t work.
Actually… it does work if the end of minuette (iii) is to the right, and it’s structure fits.
So yeah… could be a triangle.
I don’t like the undershoot within micro 3 of that ending diagonal for subminuette v though.
Still… it was quickly reversed and this does meet all EW rules…
AMZN looks like its about to tear the faces off some shorts again here shortly.
and boy did it ever. This could be the start of a scary run for amzn. (check out the 50ma on the daily chart)
Scary for long traders. Tech is in a final wave up. AMZN is going to three hundred and change….
You think Primary 4 was $938 ?
I am actually not paying much attention to the so-called FANG bunch but instead looking at NDX 100, which I think is in an ending diagonal. If that is correct it spells doom for those guys….
Opening “stink bid” to buy September SVXY 85 strike puts for 1.50 or less. If filled, that should be at the very least 5 bagger as SVXY heads back down to around 70 prior to a final wave up.
If anyone likes to range trade on a day like this…Q is getting reasonably set up on the lower keltner channel/bollinger band.
Adding to SPY 248.5 puts to lower cost basis to 0.45 per contract…there is a good chance that these could be cashed in before the close for a quick double….
Strong counter-trend move in oil today making USO September 29 10.50 puts ripe for the pickin’. It could go a bit higher above 49.00 but that’s O.K.
Buying those puts for 0.51 per contract and prepared to be underwater for a day or two.
Wedgie anyone? 😀
I have a similar count, except that the last high is the top of my wave three, with a wave four zig zag down to about 2450 or thereabouts on deck.
Buying SPY 248.50 puts expiring Friday for 0.47 per contract….
This is the end, my only friend, the end.
The Doors.
DJI needs to make a new ATH….we are getting REAL close. An important turn date coming up tomorrow…..
One more high in next hour likely about 2500.
I think it’s time for some head fake up, then sharp move down action, as in July 27, Aug 2, and Aug 8. Topping type action (again), it’s very due. And of course 2500 is the perfect first opportunity to pop and drop. Though I’m highly suspicious the 1.27% extension around 2513 is going to be the ultimate high here.
That’s the way, Uh Huh, Uh Huh! I like it…! 🙂
I’m gonna, I’m gonna, I’m gonna gonna gonna take you HIIIIIIIGHHHERR!!
Well well well! I guess Mr. Market decided to be magnanimous after all. Selling 249.5 calls for 0.65. Thank you berry berry much! 😀
We’ve seen this kind of price action before so many times that I simply again have to conclude it is consolidation against a move higher. It is particularly frustrating when the market does this contrary to what we are expecting from the preferred wave count but at this point we have seen it often enough to know what to expect. I am selling the 248.50 SPY naked puts expiring on Friday for 0.48 per contract to off-set my 249.50 calls expiring today. I am holding 247 puts expiring next week so position is somewhat hedged. Will buy back near term puts with any break of 2470. Nothing much to see here folk. Tada!
Now thinking instead of a flat 4 that was first wave down and previous high was a short 5. X fingers. Need channel break now.
VIX will almost certainly head higher ahead of any market turn down- that just ain’t happening right now I am afraid….
Looking at the overlapping movement raises likelihood of ending contracting diagonal for fifth wave after flat 4 correction. Slow meandering frustrating end to this upward movement. Will look to a VIX turn around during upwards movement to hint at the end.
Low volume fits with ending diagonal. Believe we are finishing third wave up right now.
Yep! It will sprint into the green before the market turns if a top is in….
WOW!!!!!
2.11% Yield with a 2.10% Coupon on a 100 Year Bond! + it was 3X’s oversubscribed!
Think about what that Says about the future!
{“Austria was set to make Eurozone history with the first sale of a 100 year bond direct to public markets, bypassing private syndication. It did that later in the day, when the €3.5 billion offering priced tighter than initially marketed, at RAGB 2/2047 +50, at a price 99.502 to yield a paltry 2.112% and with a negligible 2.1% cash coupon.
What is even more notable is that despite mounting fears of an imminent tapering by the ECB which many have predicted will lead to a new European bond tantrum and blow out in yields, there was tremendous end demand by investors for the offering managed by BofAML, Erste Group, GS (B&D), NatWest and SocGen, mostly fund managers from across the globe, resulting in what ended up being more than €11BN in 208 different bids for the paper, an oversubscription of more than 3x! The breakdown for the final allocation is was follows, courtesy of Bloomberg: “}
http://www.zerohedge.com/news/2017-09-13/3x-oversubscribed-staggering-demand-100-year-austrian-bond-record-duration
I wonder how much of working folks’ hard earned pension fund money is being used to make these insane purchases? I am sure the idiots managing CALPERS were first in line. I am also quite sure that quite a few money market funds, (which are in turn held by many pension funds) which are absolutely prohibited from buying anything that could “break the buck” is participating in this madness due to relaxed rules about what they can invest in. What is really sad about all this is that the general public has no idea what these criminals are doing. They are going to wake up one day and find out exactly what was done to them, but by then it will be too late….
If I were to hazard an opinon, I would wager that we are not going to see a down-turn today absent some exogenous event. VIX way too somnolent. I am afraid it is going to be another day of Zzzzzz…..!!!
I expect this to continue until DJI posts a new ATH…
Was that a truncated fifth on the one minute chart?
If it was the reversal should be sharp and decisive; or maybe Mr. Market is just playing us as ussual. 🙂
Energy the only positive sector (except consumer stuff, very slightly green), all else red this morning so far. SPX looks rather done, but this market has legs.
Would you care for a baseball bat bud? 😀
Naw, you are too far away to smack for suggesting a 5 wave count on a one minute chart. Now buds the size of baseball bats, send ’em on over for inspection!
This is a very strange market indeed. I get the sense that we are soon going to see something truly nutty. From July 26 to August 8 DJI price remained pinned to the upper B band for a period of two weeks before the current move down started. SPX did not tag the upper B band as DJI did but did spike higher and reverse on August 8 before turning down in conjunction with DJI. This in not normal price behavior and we clearly have deep pockets keeping price elevated on diminishing volume as we have been saying ad nauseam. That price action also began with a gap up open and we have seen a similar thing this week- another possible ten days of grinding slowly upwards?! Yeeeech! 🙂
Looks like we just completed a flat fourth wave correction and now final fifth wave which is limited as wave 3 is shorter than 1. Lets get this over with!
It had better not be an extended fifth or I am going to have to take Mr Market out back for a severe spanking…! 🙂
Since we have been seeing three wave moves it should conclude fairly quickly…
Well…my small contingent of SPY 249.50 strike puts have fallen from 0.28 to a 0.16 bid this morning. I am really tempted to attempt a roll to next week but I’ve got a sneaky feeling that we are gong back to test the lower boundary of the wedge around 2450 sometime in the near future. Come on Mr. Market, go ahead and shed a measly 30 points… 🙂
I’ll jump in second!
Nah! Don’t tell me….I’m turd…right?
Excellent. Thank you very much.
well look whos first,, again
You’re on a roll!