The target for upwards movement was not met, but price did move higher towards it. The target is recalculated today.
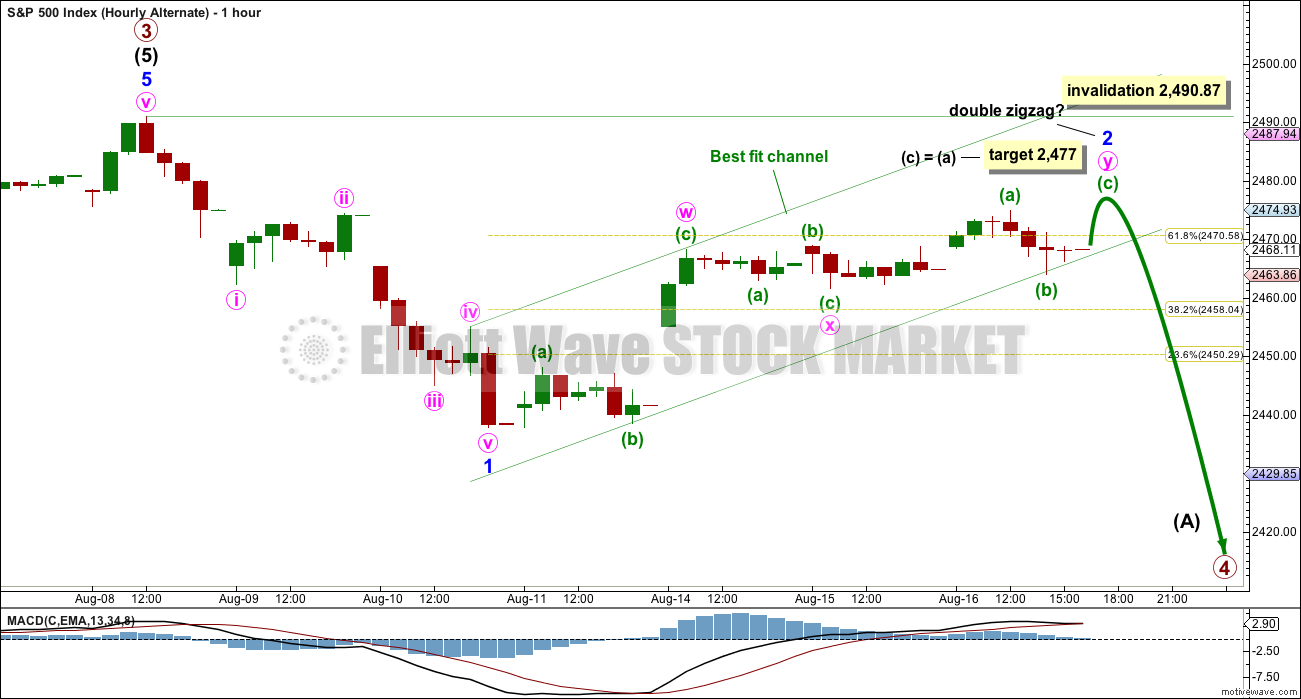
Summary: Allow for the possibility of a little more upwards movement while price remains within the best fit channel, but it should not make a new all time high. The target is at 2,477.
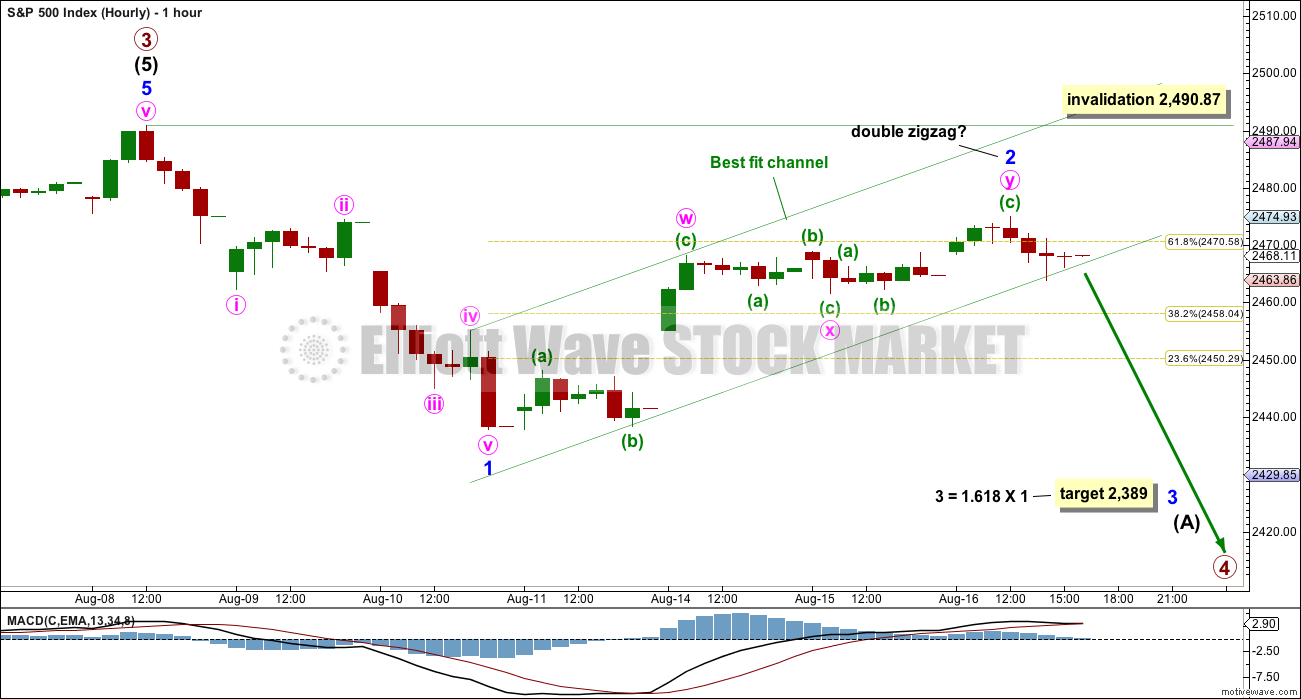
If price breaks below the best fit channel tomorrow, the short term target for a third wave is at 2,389.
In the short term, there is new bearish divergence between price and the AD line to support the main hourly Elliott wave count, or at least the idea of downwards movement ahead soon.
A deeper pullback may be expected to last at least 8 weeks and may end about 2,320.
New updates to this analysis are in bold.
Last monthly and weekly charts are here. Last historic analysis video is here.
ELLIOTT WAVE COUNT
WEEKLY CHART
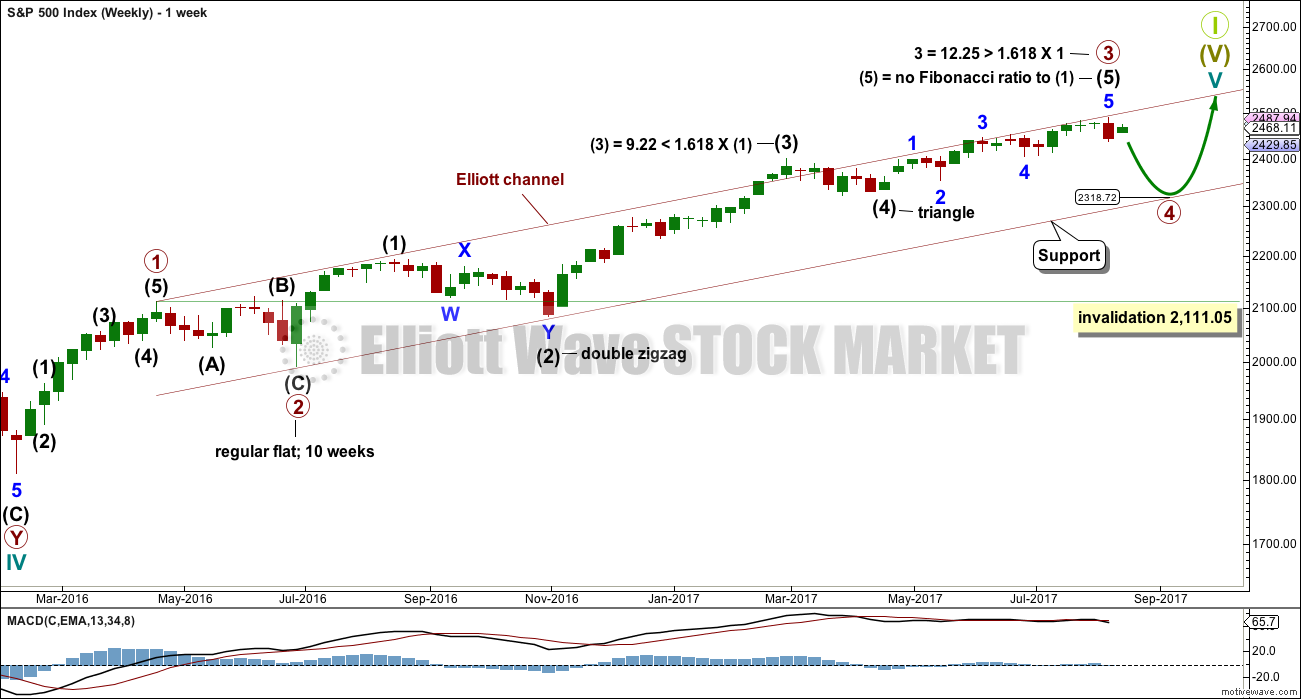
Primary wave 3 now looks complete. Further and substantial confidence may be had if price makes a new low below 2,405.70. Fibonacci ratios are calculated at primary and intermediate degree. If primary wave 3 is complete, then it still exhibits the most common Fibonacci ratio to primary wave 1.
Primary wave 4 may not move into primary wave 1 price territory below 2,111.05.
Primary wave 4 should last about 8 weeks minimum for it to have reasonable proportion with primary wave 2. It is the proportion between corrective waves which give a wave count the right look. Primary wave 4 may last 13 or even 21 weeks if it is a triangle or combination.
If primary wave 4 reaches down to the lower edge of the Elliott channel, it may end about 2,320. This is very close to the lower range of intermediate wave (4); fourth waves often end within the price territory of the fourth wave of one lesser degree, or very close to it.
The final target for Grand Super Cycle wave I to end is at 2,500 where cycle wave V would reach equality in length with cycle wave I. If price reaches the target at 2,500 and either the structure is incomplete or price keeps rising, then the next target would be the next Fibonacci ratio in the sequence between cycle waves I and V. At 2,926 cycle wave V would reach 1.618 the length of cycle wave I.
DAILY CHART
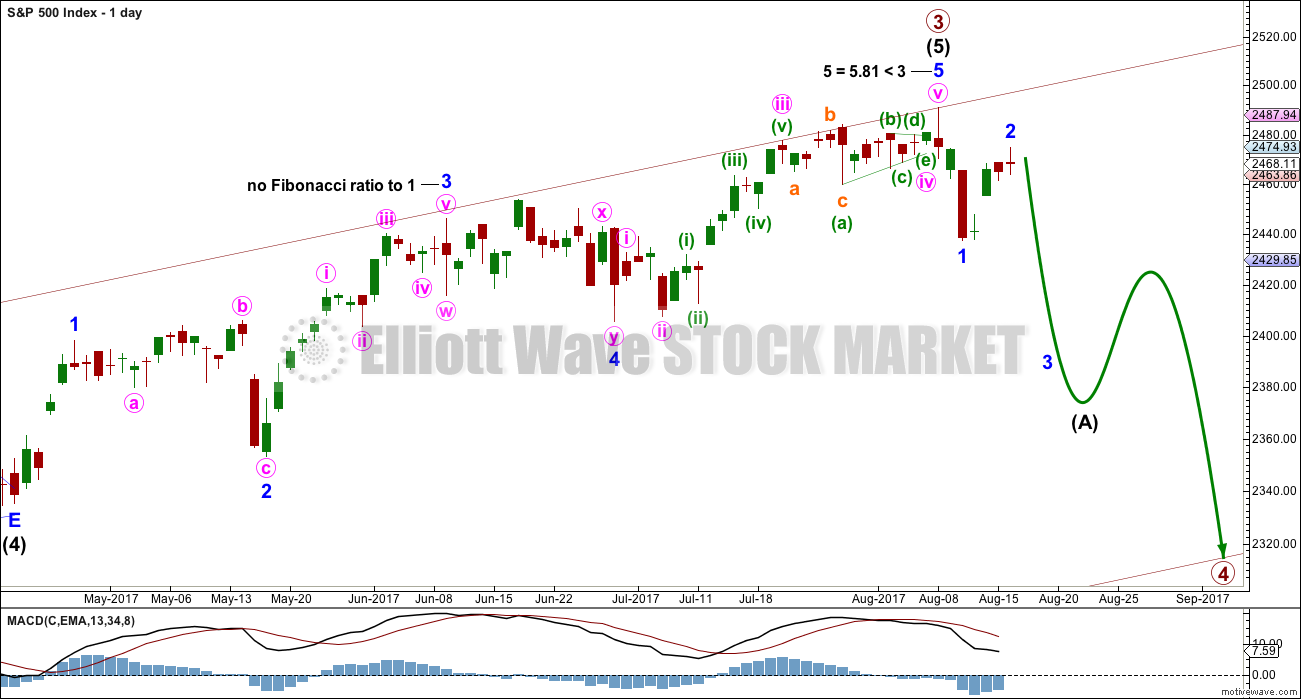
The daily chart shows only the structure of intermediate wave (5); this structure is an impulse.
Primary wave 2 was a regular flat correction lasting 10 weeks. Given the guideline of alternation, primary wave 4 may most likely be a single or double zigzag. Within both of those structures, a five down at the daily chart level should unfold. At this stage, that looks incomplete.
While primary wave 4 would most likely be a single or double zigzag, it does not have to be. It may be a combination or triangle and still exhibit structural alternation with primary wave 2. There are multiple structural options available for primary wave 4, so it is impossible for me to tell you with any confidence which one it will be. It will be essential that flexibility is applied to the wave count while it unfolds. Multiple alternates will be required at times, and members must be ready to switch from bear to bull and back again for short term swings within this correction.
Members with a longer term horizon for their trading may wait for primary wave 4 to be complete to purchase stocks or enter the index long.
HOURLY CHART
Minor wave 1 downwards looks very clear as a five wave structure.
Upwards movement for minor wave 2 may now be a complete double zigzag.
The green best fit channel is showing where price has found support today. When price breaks below the lower edge, that may be an early indication that the bounce is over and minor wave 3 downwards may have begun.
Minor wave 3 should have the power to break below the lower edge of the blue base channel. Once it has done that, upwards movement should find resistance at the lower edge.
Minor wave 2 may not move beyond the start of minor wave 1 above 2,490.87.
ALTERNATE HOURLY CHART
This alternate hourly wave count will remain viable while price remains within the best fit channel.
Within the first zigzag of minute wave w, minuette wave (b) shows up clearly. Within the second zigzag of minuette wave (y), for this wave count minuette wave (b) also shows up clearly. This wave count may have a better overall look than the main hourly wave count.
The channel shows today where price found support, so this channel now looks right.
TECHNICAL ANALYSIS
WEEKLY CHART
Click chart to enlarge. Chart courtesy of StockCharts.com.
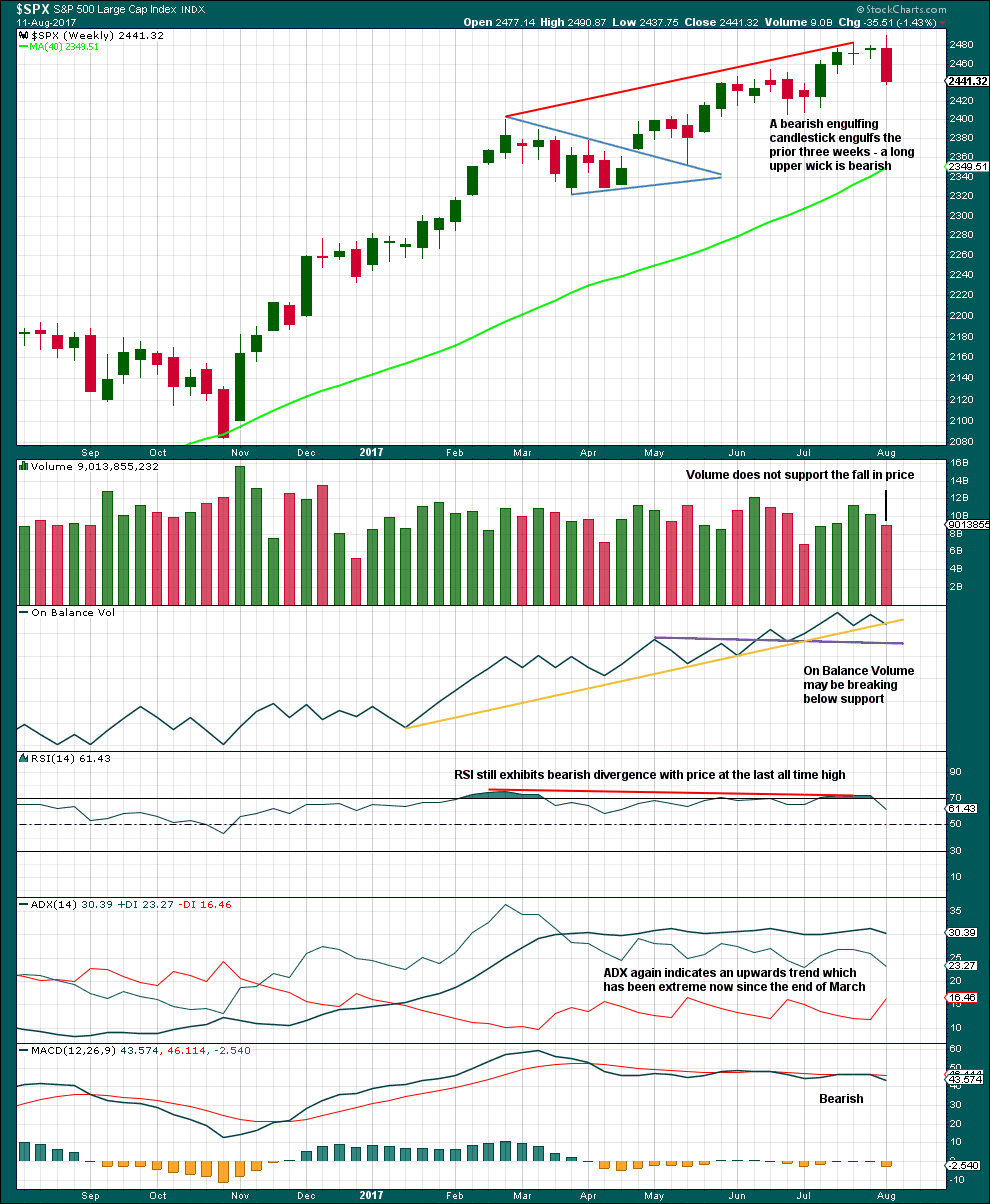
This weekly candlestick is very bearish. A Bearish Engulfing pattern is the strongest reversal pattern.
If this week also moves price lower, then On Balance Volume would give an important bearish signal. For now it may offer some support and assist to initiate a bounce here.
RSI, ADX and MACD all remain bearish.
This weekly chart offers good support to the Elliott wave count.
DAILY CHART
Click chart to enlarge. Chart courtesy of StockCharts.com.
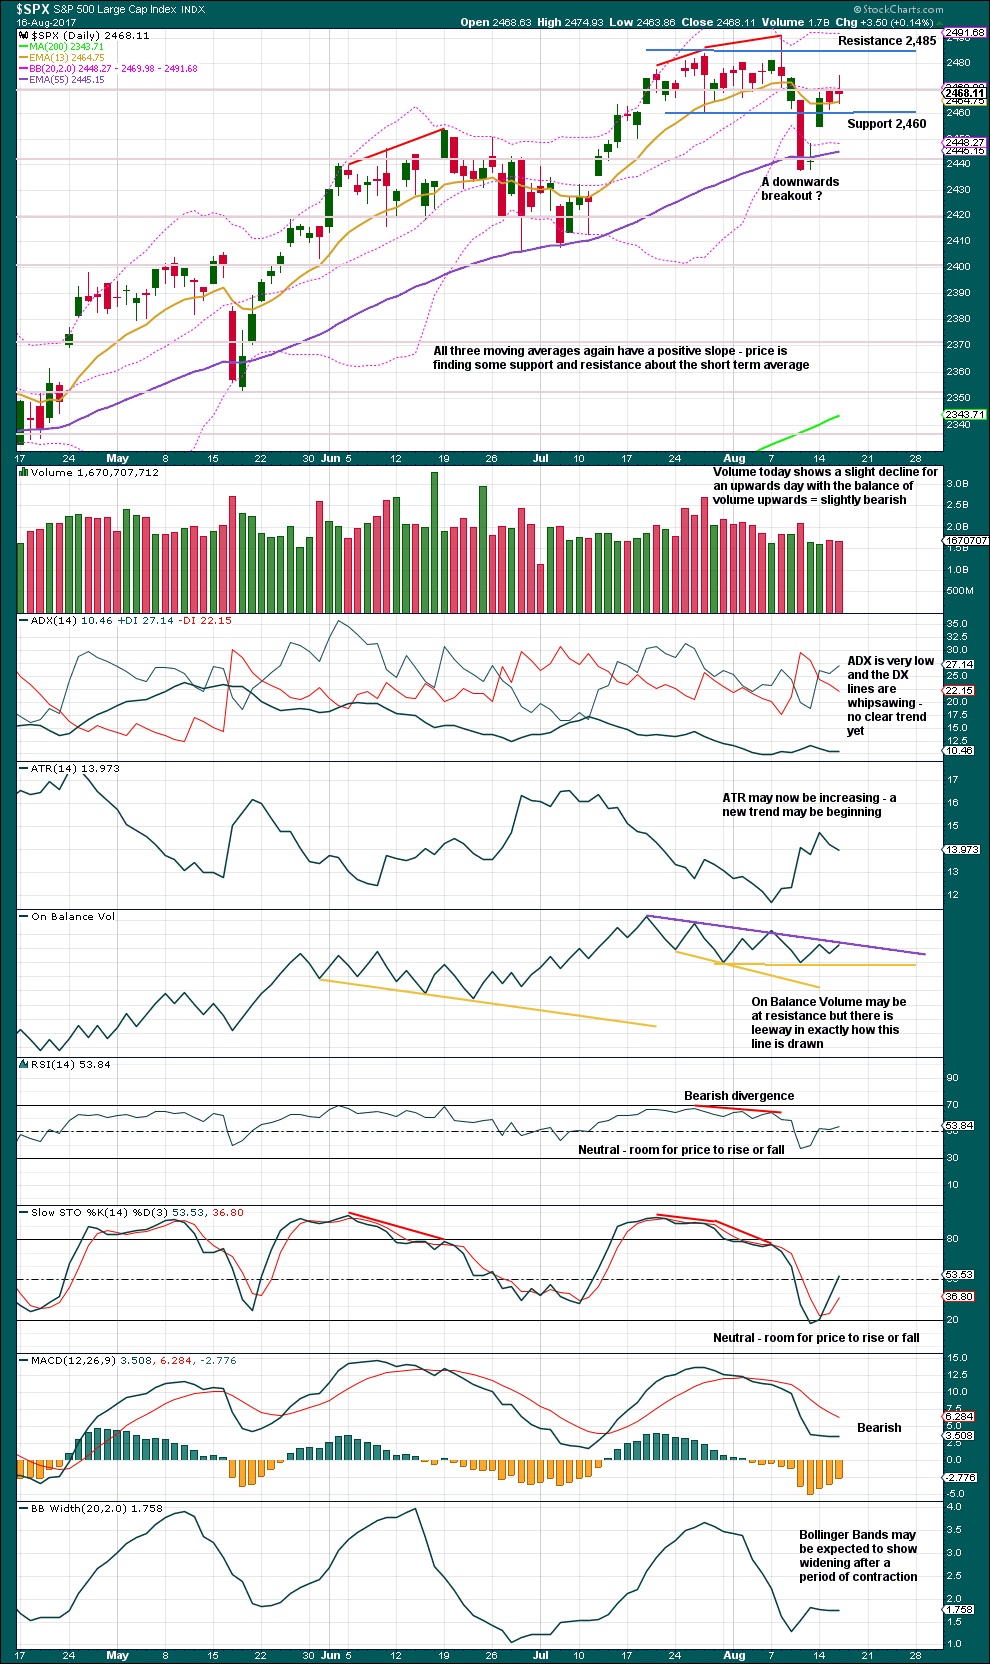
After what looked like a clear downwards breakout, price is now back within the prior consolidation zone. Resistance is at 2,485 and support is at 2,460. During the consolidation, it is a downwards day which still has strongest volume.
The volume profile remains bearish for the very short term.
On Balance Volume may assist here to halt any further rise in price.
The doji candlestick today puts the trend into neutral. Today, there was a balance between bulls and bears.
VOLATILITY – INVERTED VIX CHART
Click chart to enlarge. Chart courtesy of StockCharts.com.
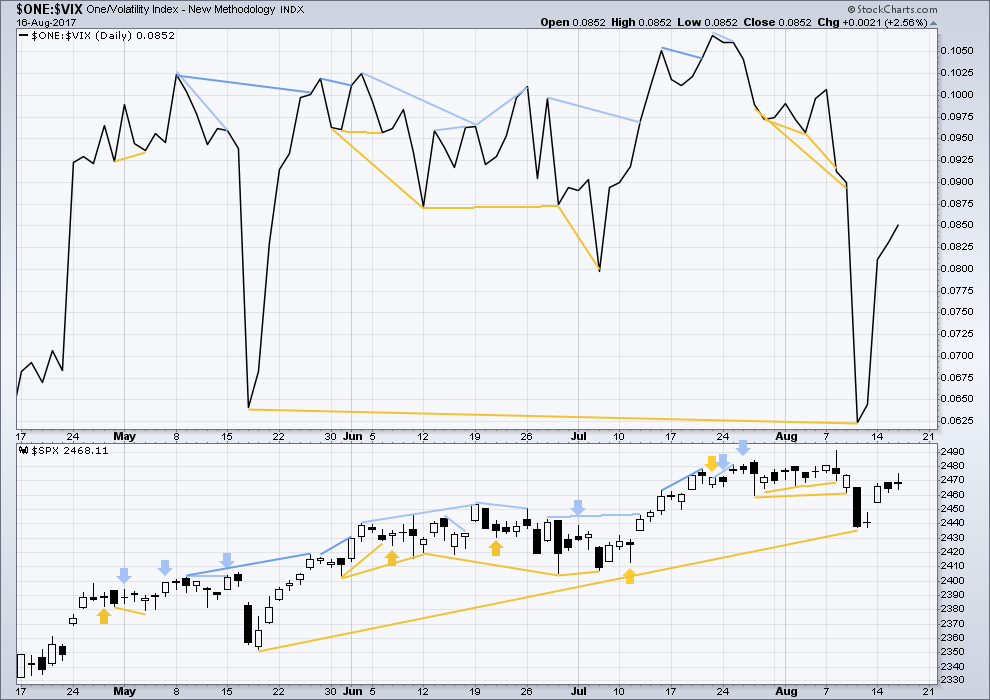
Normally, volatility should decline as price moves higher and increase as price moves lower. This means that normally inverted VIX should move in the same direction as price.
There is longer term divergence between price and inverted VIX, shown in gold lines. However, mid and long term divergence has proven to be reasonably unreliable, so it will be given no weight in this analysis.
There is no divergence today between price and inverted VIX. They both moved higher. The slight rise in price today comes with a normal decline in volatility.
BREADTH – AD LINE
Click chart to enlarge. Chart courtesy of StockCharts.com.
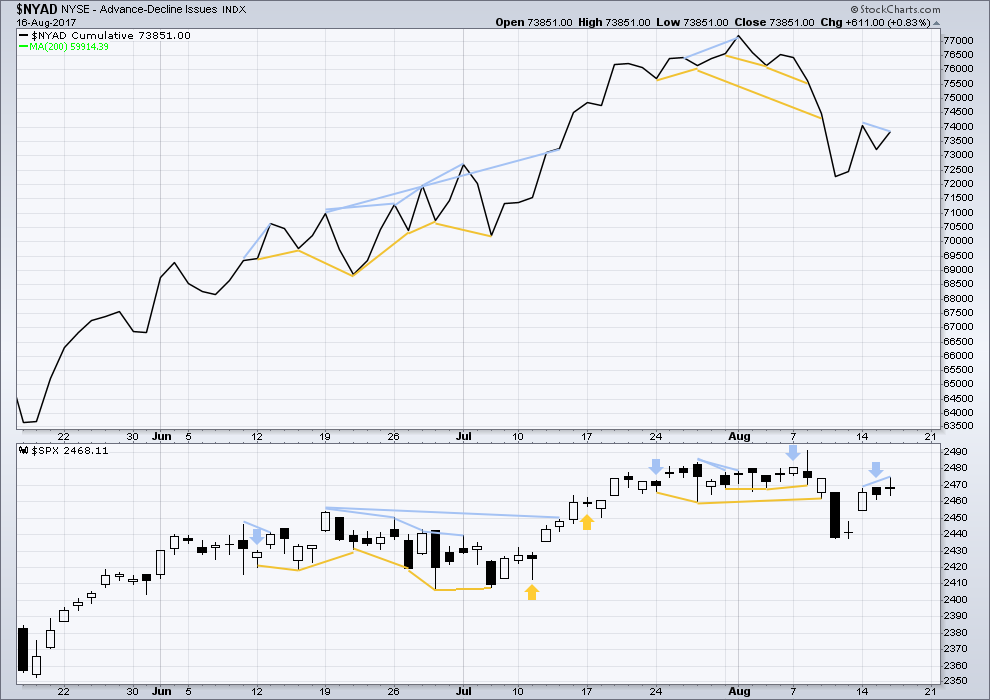
With the last all time high for price, the AD line also made a new all time high. Up to the last high for price there was support from rising market breadth.
There is normally 4-6 months divergence between price and market breadth prior to a full fledged bear market. This has been so for all major bear markets within the last 90 odd years. With no divergence yet at this point, any decline in price should be expected to be a pullback within an ongoing bull market and not necessarily the start of a bear market.
There is new short term bearish divergence today between price and the AD line: price has made a higher high above the high two sessions ago, but the AD line has made a lower high. This indicates weakness within upwards movement from price.
DOW THEORY
The S&P500, DJIA, DJT and Nasdaq have all made new all time highs within the last month.
Modified Dow Theory (adding in technology as a barometer of our modern economy) sees all indices confirming the ongoing bull market.
The following lows need to be exceeded for Dow Theory to confirm the end of the bull market and a change to a bear market:
DJIA: 17,883.56.
DJT: 7,029.41.
S&P500: 2,083.79.
Nasdaq: 5,034.41.
Charts showing each prior major swing low used for Dow Theory are here.
Published @ 07:51 p.m. EST.

Was anybody asking if this was a third wave down today?! He! He!
We should remember that!
It seems to me there was someone concerned about it being a third wave. I can’t place it though. It must have been that dog gone rabbit! Naughty hare.
By the way, RUT/IWM closed below its 200 sma. Will there be any followers?
you mean turd wave down dont you Wabbit? dat red candle kinda looks like a carrot dont it?
Yum! 🙂
Oops! Yer right Doc….turd indeed! 🙂
Well well well. I’m keeping my subscription to Lowry’s for years methinks. They really have assisted me in staying the course on the way up, and now they picked a deeper pullback and looks like they were right. I love the data they generate, solid technical analysis.
Moving the invalidation point down so move stops on short positions down.
I see some members taking profits quickly. That’s a good idea. Be aware here that minor 3 should accelerate further, the middle may be the strongest and it’s not yet passed.
You could try and hold some shorts to the target for minor 3.
The base channel is added: corrections should now find resistance at the upper edge, if they get that high. Look initially for support at the lower edge, then for price to break below and test resistance. If it does that enter short on the back test.
Corrections are more volatile than a bull trend. Price can whipsaw violently, which is why taking profits is a good idea.
It is especially important to manage risk diligently if trading this market during a correction. Always always use a stop. Trading without stops exposes your entire equity to risk and complete loss, it’s how novices wipe out their accounts at least once. It’s how many people give up trading. Don’t be that person. Be smarter.
Not yet passed?! Ooooh! Goody! 🙂
Once minor 3 moves below minor 1 then we should see acceleration.
That’s only just happened in this last hour.
Awesome!
Awesome advice on trading strategies. Awesome Lawry’s. Awesome Lara.
Thanks.
Thanks Rodney 🙂
Eventually when Grand Super Cycle I looks to be over and the S&P might be in a huge bear market, I’ll subscribe to Lowry’s daily analysis.
Their metrics of selling pressure and buying power, and their power rating, will be very useful in identifying the end of downwards swings and where bounces may begin. And we’ll need that on a daily basis.
That and my classic TA should see us take profits at the right time.
I think I’ve found the key to making my analysis more accurate and timely. Another piece of the puzzle. Good one Lowry’s 🙂
The VIX short sellers must be having quite a moment. I suspect this cycle they will capitulate. So far they are not budging, but as wise old Yoda would say, ” Budge, they will! Hmmmnnn!”
Verne, we could see 60 easily
Yes indeed. I expect the B bands to keep stretching….I think a lot of these fellers are planning on trying to sit it through as they have become comfortably accustomed to doing the past year or so. It is going to a hoot to seem ’em all head for the exits at once…lol! 🙂
A final push down to the lows of minor wave 1 down (243.7 or so spy) will complete my 5 wave down count of what is apparently minute 1 of minor wave 3. Or it’s possible the wave minute 1 is complete but everything will be tidy if it finishes at the minor 1 low. I’m expecting a .38 to .62 retrace for a minute 2 pullback tomorrow, and it could kick off before the close today. I’d prefer to be flat soon and trading the minute 2 on the long side.
Not a single 5 minute bar today is fully above the 21 ema. Many touches, no full breaks. A full break over that 21 ema on the 5 min will be a very strong indicator to me that minute 1 down is over and minute 2 is starting up.
Is it legal to have this much fun? lol!
I am already keeping a sharp eye out for the VIX capitulation event. I will post the 10X entry order if anyone else want to take a stab and a pretty awesome (and easy!) trade.
The action from the swing high around 1:35pm onward looks rather ending diagonal-lish.
Getting to that event horizon number of DJI 200 points down. It would pretty much guarantee that gap stays filled and we should see an acceleration of the decline into the close. The best is yet to come…! 🙂
We are now below the 13, 34 and 50 day exponential moving averages on the SPX. Not a good sign for the bulls. Since Nov. 2016 this has happened four times. Each time the downtrend was short lived and SPX moved back above all three moving averages.
Will this time be different? If we are in a Primary level correction, namely a 4th wave, the answer is ‘Yes’ and we should visit the 200 day moving average currently around 2350.
VIX B bands expanding to contain move up. I have taken profits on short trades but I think we have more downside. Let’s see how far this bounce takes us. As long as that gap remains filled the sweet spot could be still ahead.
I guess the bull borgs did not get the message of this move down : “Resistance is Futile!!” 😀
Well, there you have it. Bull chops anyone?! 🙂
A scalping we will go, a scalping we will go…. 🙂
A lot of traders are watching that gap. If it is filled, downside volume will absolutely explode….so will the bulls! 🙂
Below 2450.78 we have five down three up…
Never managed to stand up on a surf board but hope to ride this wave!!
Thank you everyone for the comments 🙂
That wave down could have been corrective – possibly a C wave of a larger abc corrective wave….
I count the move down from the top of y as a 1-2-3, and the 3 is a 1-2-3 with the current action forming what appears to be a triangle 4 of that 3. If I’m right (questionable) we should have a 5 down out of it, then a larger 4, then a larger 5. Or not!!! My counting is highly suspect; anyone got something better?
Not a triangle 4, a flat correction. If my count is right, price should not move above the lows at 246.72 (spy). And any upcoming turn could be a nice place to jump on board or add.
Now I’m thinking this corrective action is an X-Y-Z, and we’ve done the X and are just concluding the Y. Or…a simple A-B-C correction, and the fresh downmove is the 1 of the 5. That’s looking more likely now.
I have to presume this 5 wave down I’m counting is minute i of the minor 3. I think (?) we are due for one more 4, then the final 5 of it, probably closing the gap and getting us close to the Aug 11 low. Then a minute 2 wave to make all the fresh bears run for cover!!
Looking at the 5 minute chart, there are so many little corrections in there…. so many different ways to count it.
I don’t think minor 3 is at it’s middle yet.
Any move below 2448.09 and the bulls are toast!
Or should I say tasty steaks??! 🙂
I recommend taking short side profits quickly folk. The best approach is to scalp these moves down as profits can evaporate quicker than you can say “Wazzat?” 🙂
Closed nice triples on vol!!
Agreed. Mr. Market has picked my pocket several times in the last few days, but thankfully I managed to snag a quick profit in SQQQ this AM. Waiting now to ambush the next swing down (up for SQQQ) if I can.
Well, well. We are now into the top of the open gap that needs to be closed. Downside movement is accelerating. It looks to me like the long position stop loss orders are being filled. If we can break 2437 today or tomorrow, it may be “Look out below!” We shall see.
Took my $$ on the stall. Will reenter first significant (20-90 minute) pullback. That crack and retest of the channel is classic!!
Third waves are unmistakable in their characteristics. They do not take any prisoners. The failure of the move down to take out gap from Monday’s open is a huge problem it seems to me. In fact the top of that gap halted the decline and that is a dead giveaway. I have to conclude this move down is corrective and we have more upside to come.
Thanks for heads up on gap. I took profits on shorts and will reload when gap is filled. Plus 50d sma is at 2450.53
Think its only a matter of time before we take out 2448.
Little battle of bulls and bears right here.
Yep! It is a trader’s market. Let the bulls and bears clobber each other and we will merrily scalp the action mateys! Aaarrrgggh!!! 🙂
I opened an SPX short position at the open of the market today. I also opened a long volatility position. It looks like the main hourly count is playing out as the lower channel line has been breached.
I as well. Too early, I “knew” it was going to at least make an effort to close the gap but my fingers still hit “buy” (spxu). All seems well now though. And look the X wave bottom is getting taken out!! Next is to close that big gap below. Fall mountain…ring my register!!
For a proper breach of the channel, we are looking for an hourly candlestick that is below and not touching the lower channel line. We may get that in the next hour or two. I too would like to see the gap below (2455-2444) filled. That is a long way from the current SPX price at 2460. But it is not unreasonable to expect it to happen tomorrow.
However, Verne’s caution in the above comment is well noted.
Gettin’ the analysis done, and hittin’ those ocean waves, I’m guessing. Go for it, Lara!
I did, thanks Curtis. A quick late afternoon session in freezing cold water. I sure do notice the difference further south here in NZ.
its me,, Doc
What yer think Doc…will it be a turd? (wave that is) 🙂