A little more upwards movement fits both hourly Elliott wave counts.
Summary: We should always assume the trend remains the same until proven otherwise. While it is possible that primary wave 3 may be over, assume that it may continue higher while price remains above 2,430.98. The expected end is now below 2,481.12. If that price point is passed, then the next target would be 2,485.
If price moves strongly lower this week, then the probability that primary wave 4 has arrived will increase. Confidence may be had if price makes a new low below 2,430.98. If that happens, then expect a multi week to multi month pullback to end about 2,320.
Classic technical analysis today still offers reasonable support to the main Elliott wave count, which sees a high now in place for primary wave 3 and the start now of primary wave 4.
New updates to this analysis are in bold.
Last monthly and weekly charts are here. Last historic analysis video is here.
MAIN ELLIOTT WAVE COUNT
WEEKLY CHART
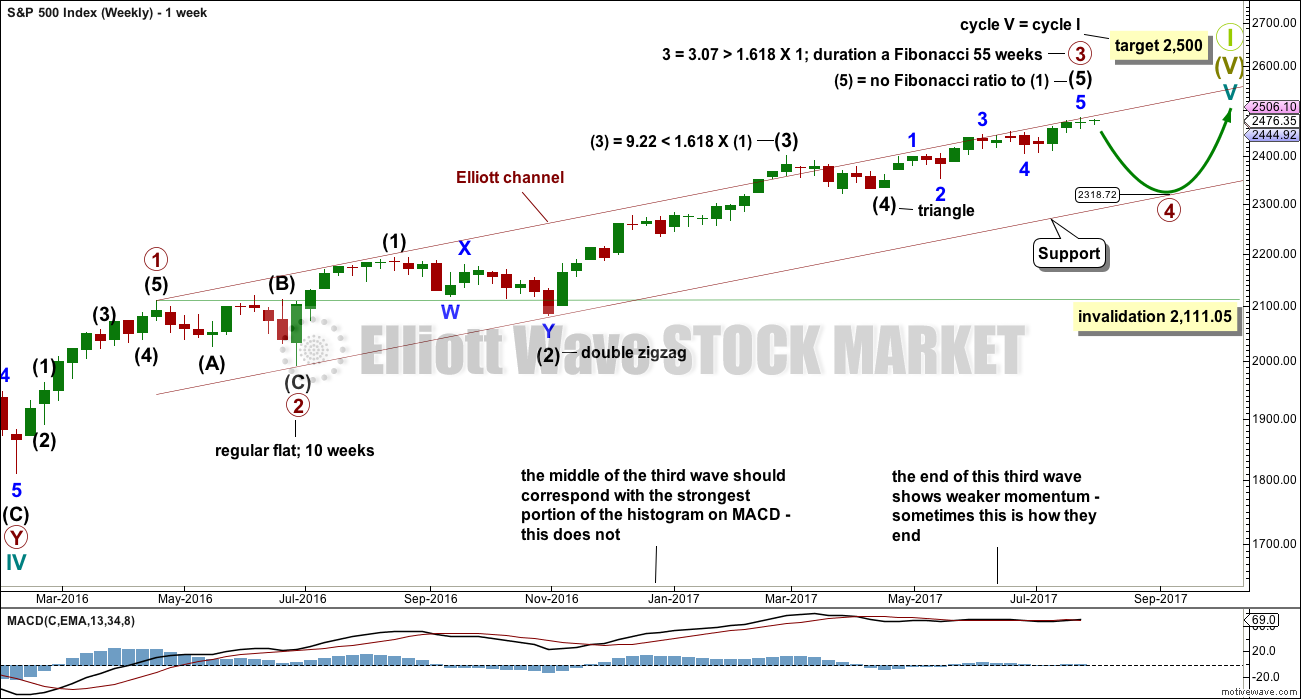
It is possible that primary wave 3 is complete. However, some confidence may be had in this view only with a new low below 2,430.98. Further and substantial confidence may be had if price makes a new low below 2,405.70. Fibonacci ratios are calculated at primary and intermediate degree. If primary wave 3 is complete, then it exhibits the most common Fibonacci ratio to primary wave 1. It also perfectly exhibits a Fibonacci 55 weeks duration.
Primary wave 4 may not move into primary wave 1 price territory below 2,111.05.
Primary wave 4 should last about 8 weeks minimum for it to have reasonable proportion with primary wave 2. It is the proportion between corrective waves which give a wave count the right look. Primary wave 4 may last 13 or even 21 weeks if it is a triangle or combination.
If primary wave 4 reaches down to the lower edge of the Elliott channel, it may end about 2,320. This is very close to the lower range of intermediate wave (4); fourth waves often end within the price territory of the fourth wave of one lesser degree, or very close to it.
If price reaches the target at 2,500 and either the structure is incomplete or price keeps rising, then the next target would be the next Fibonacci ratio in the sequence between cycle waves I and V. At 2,926 cycle wave V would reach 1.618 the length of cycle wave I.
DAILY CHART
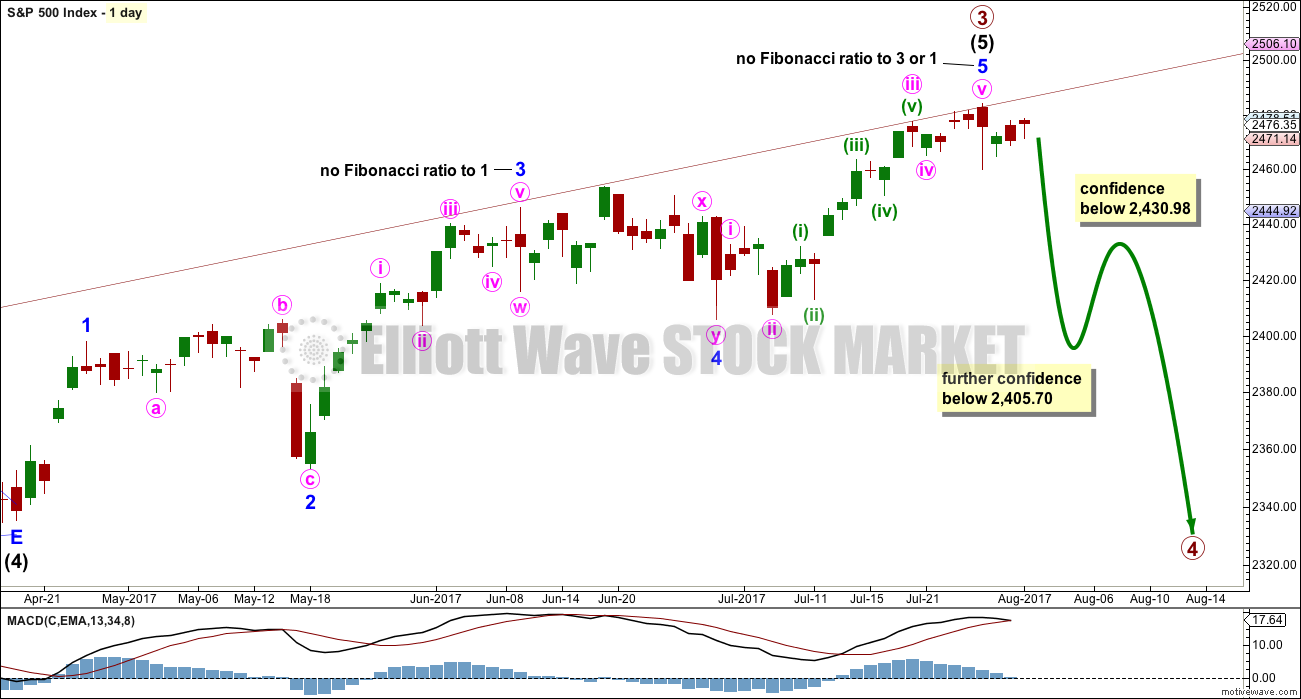
The daily chart shows only the structure of intermediate wave (5); this structure is an impulse.
There is perfect alternation between the deep expanded flat of minor wave 2 and the shallow double zigzag of minor wave 4.
There are no adequate Fibonacci ratios between minor waves 1, 3 and 5. This is not uncommon for the S&P500. Minor wave 3 exhibits strongest momentum and is the longest actionary wave, so this wave count fits with MACD.
It must be accepted that it is entirely possible that primary wave 3 may not be over and may continue higher while price remains above 2,405.70.
FIRST HOURLY CHART
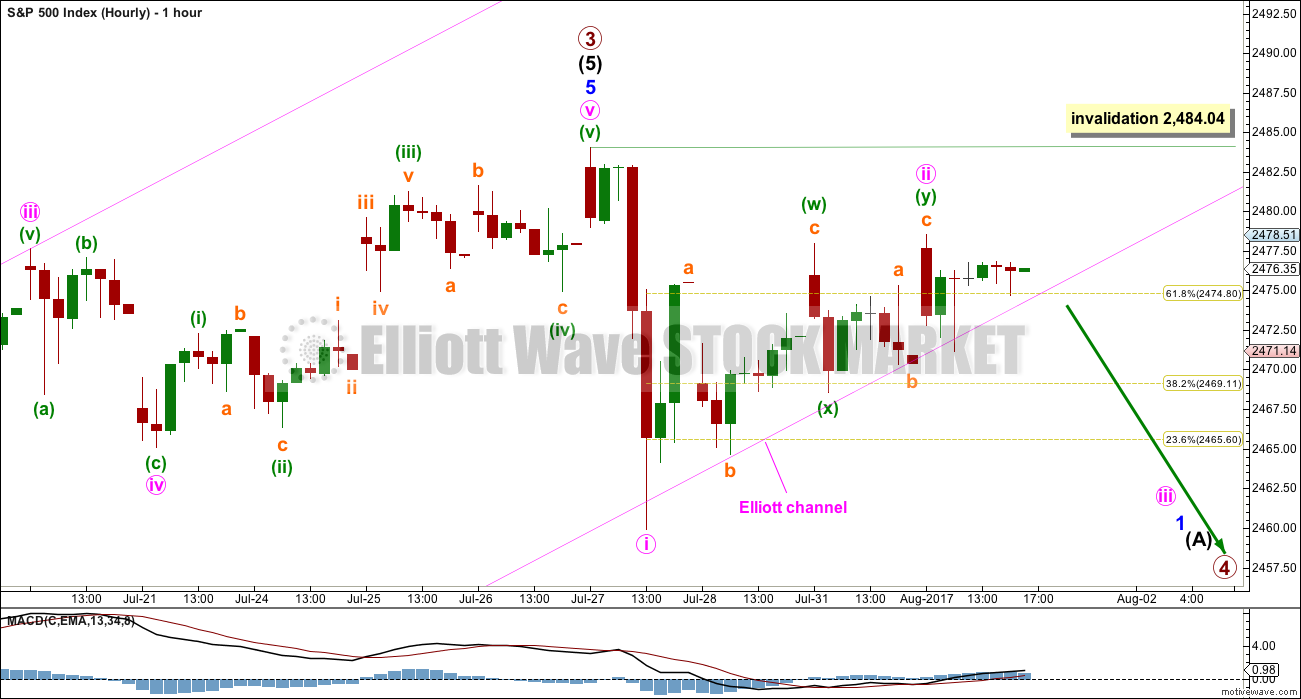
Minor wave 5 may now be a complete five wave impulse.
A strong breach of that channel would indicate a trend change, but it may not necessarily be a trend change at primary degree.
Minute wave ii may have continued higher today as a deep double zigzag. The subdivisions fit perfectly. This wave count now expects to see an increase in downwards momentum tomorrow and a breach of the pink Elliott channel.
If it continues further, then minute wave ii may not move beyond the start of minute wave i above 2,484.04.
SECOND HOURLY CHART
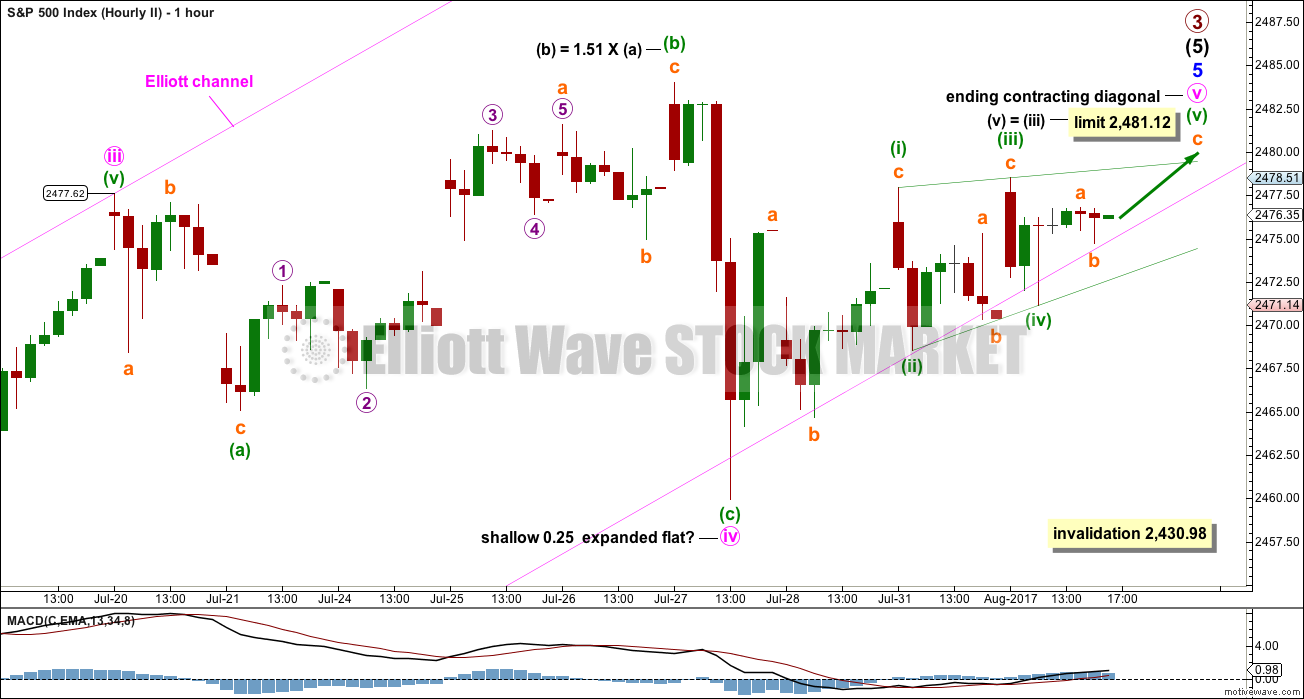
It is still possible that minor wave 5 is incomplete, that minute wave iv is still unfolding.
This wave count must be an alternate because there is inadequate alternation between minute waves ii and iv: both are expanded flats. There may still be good alternation in depth, but alternation is a guideline and not a rule and the S&P500 does not always exhibit perfect alternation.
Minute wave iv may have ended at Thursday’s low. The following fifth wave may end mid way within the channel, or at the upper edge.
With much overlapping in recent slow upwards movement, it may be an ending diagonal for minute wave v. It is extremely rare for ending diagonals to result in truncated fifth waves, so this one should end above the high labelled minute wave iii at 2,477.62. It only needs to end beyond the end of minute wave iii to avoid a truncation, not the price extreme of minute wave iv.
The diagonal may be contracting. This limits minuette wave (v) to no longer than equality in length with minuette wave (iii).
If it continues any further, then minute wave iv may not move into minute wave i price territory below 2,430.98.
TECHNICAL ANALYSIS
WEEKLY CHART
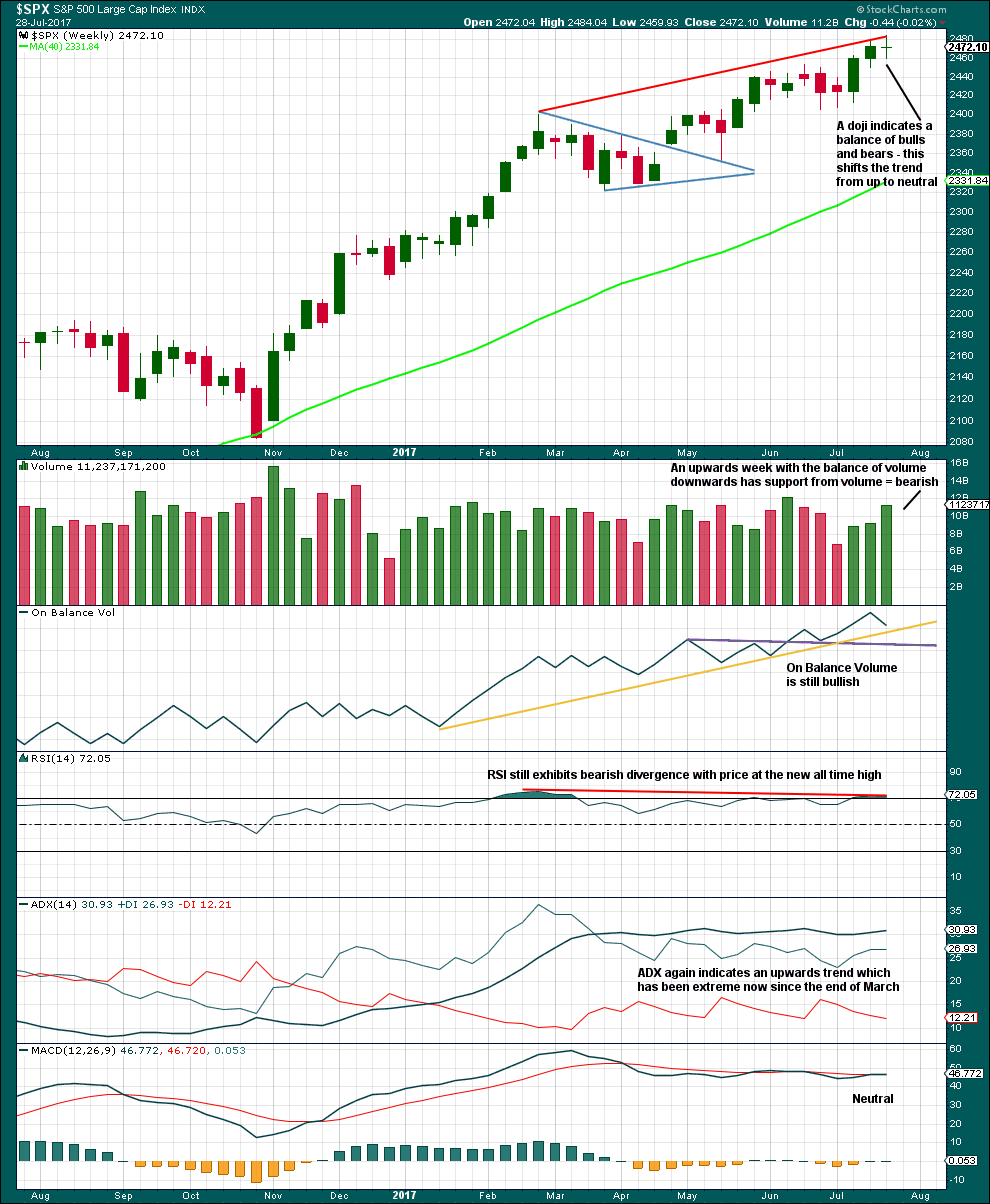
Click chart to enlarge. Chart courtesy of StockCharts.com.
There is a little short term bearishness last week to support the labelling of the daily Elliott wave count: some support from volume for downwards movement, divergence still between price and RSI, and a doji candlestick.
With still extreme ADX, the conditions look right now for a primary degree correction here.
DAILY CHART
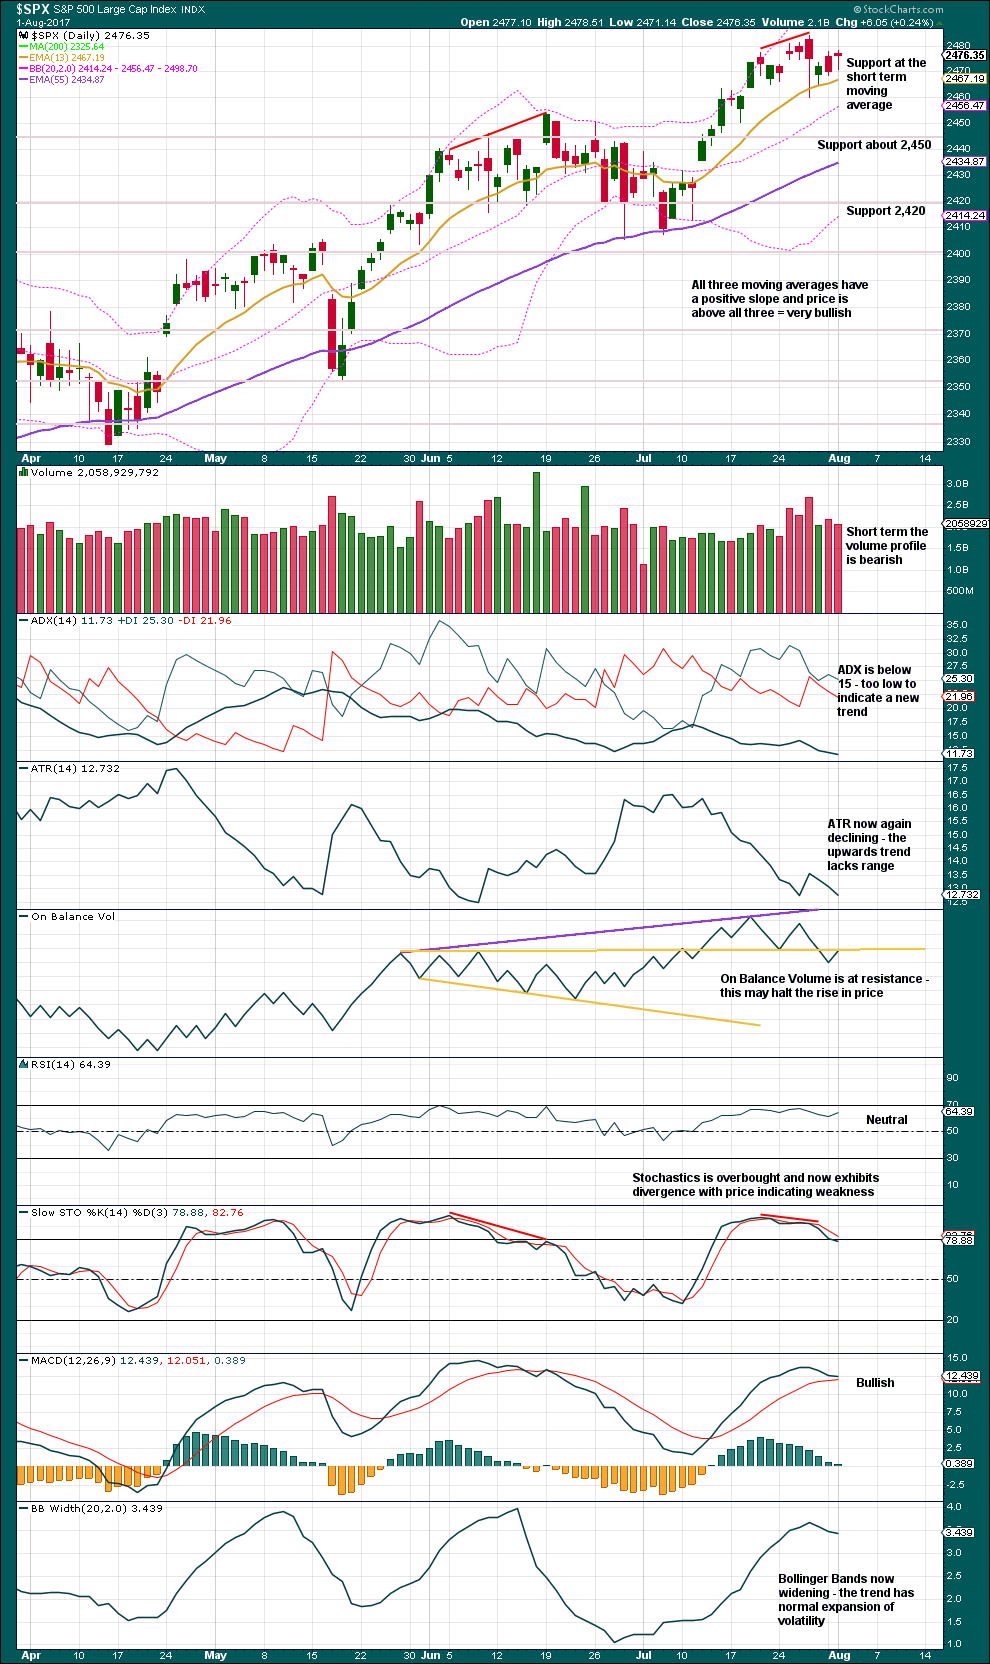
Click chart to enlarge. Chart courtesy of StockCharts.com.
Comments are all on the chart today. It remains overall fairly bearish.
In conjunction with bearishness at the weekly chart level, there is now more support for the main Elliott wave count than the alternate hourly Elliott wave count.
VOLATILITY – INVERTED VIX CHART
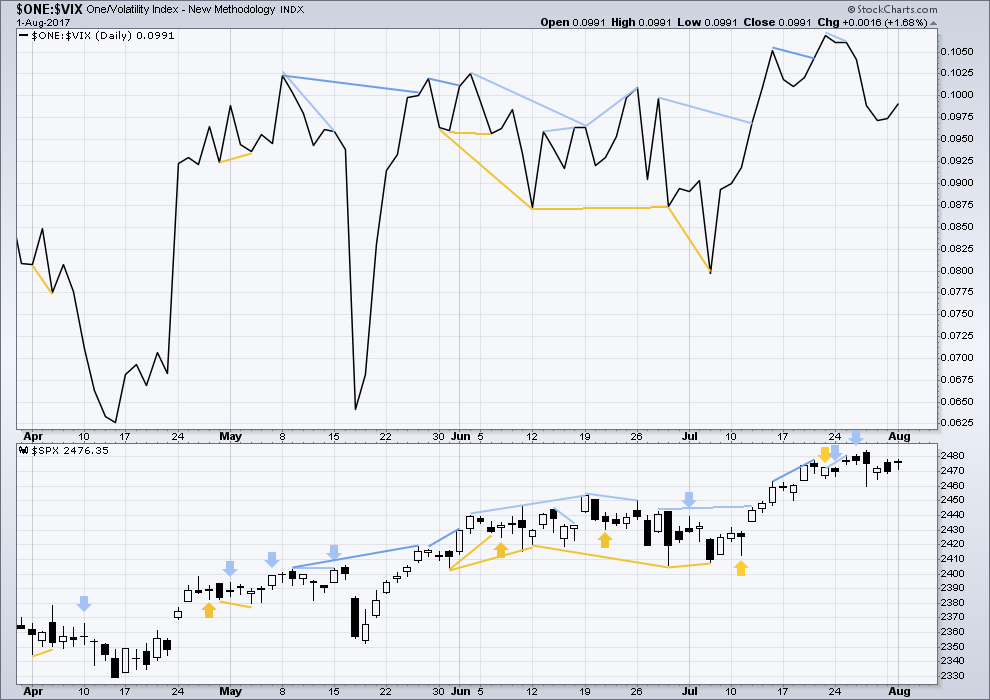
Click chart to enlarge. Chart courtesy of StockCharts.com.
Normally, volatility should decline as price moves higher and increase as price moves lower. This means that normally inverted VIX should move in the same direction as price.
Price and inverted VIX moved higher for Tuesday. There is no new divergence.
BREADTH – AD LINE
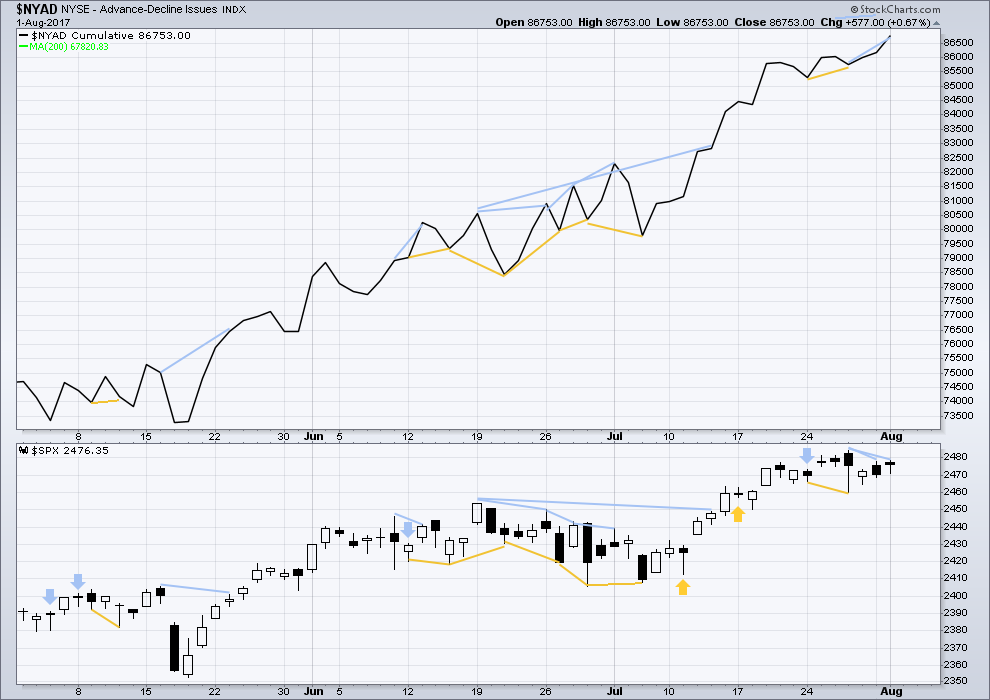
Click chart to enlarge. Chart courtesy of StockCharts.com.
With the last all time high for price, the AD line also made a new all time high. Up to the last high for price there was support from rising market breadth.
There is normally 4-6 months divergence between price and market breadth prior to a full fledged bear market. This has been so for all major bear markets within the last 90 odd years. With no divergence yet at this point, any decline in price should be expected to be a pullback within an ongoing bull market and not necessarily the start of a bear market.
A new high today for market breadth does not come with a corresponding new high for price. Upwards movement during Tuesday’s session sees weakness in price. This is interpreted as bearish.
Lowry’s measures of internal market strength and health continue to show a healthy bull market. While the bull market overall remains healthy, there are signs at the end of this week of some short term weakness which may indicate a pullback to develop here. This supports the labelling of the Elliott wave count at the daily chart level.
Historically, almost every bear market is preceded by at least 4-6 months of divergence with price and market breadth. There is no divergence at all at this time. This strongly suggests this old bull market has at least 4-6 months to continue, and very possibly longer.
DOW THEORY
The S&P500, DJIA, DJT and Nasdaq have all made new all time highs.
Modified Dow Theory (adding in technology as a barometer of our modern economy) sees all indices confirming the ongoing bull market.
The following lows need to be exceeded for Dow Theory to confirm the end of the bull market and a change to a bear market:
DJIA: 17,883.56.
DJT: 7,029.41.
S&P500: 2,083.79.
Nasdaq: 5,034.41.
Charts showing each prior major swing low used for Dow Theory are here.
Published @ 11:06 p.m. EST.

Good morning everybody 🙂 We have a channel breach, and now a back test.
Updated main hourly chart.
And on another bright note, I’m better today. And very happy about it too! So your analysis will be earlier than yesterday.
Thank you for this, Lara. And it’s good to know you’re doing better!
If we make new highs in S&P today or tomorrow could the wave count of ending diagonal for second hourly chart be moved down one degree and this was just end of first wave?
Also if we take end of wave 4 at 2459, could final fifth wave be unfolding as a contracting diagonal in entirety with wave 2 completed or partially completed today. Just trying to consider options for new highs.
Yes to your first question, and that will be my alternate today.
No to your second question. If minute v is to be a larger diagonal then the first wave within it must be a zigzag, it cannot be a diagonal.
Thanks. Got confused there between diagonals and zig zag structures.
When quickly trying to come up with alternative solution can lose forest for the trees. Now looking for impulsive third wave up tomorrow back into channel. The lack of overlapping to be expected from diagonal will hopefully mean primary 3 will be over by early next week to allow for fireworks to downside in August and September notorious bad volatile months for the market. Also Aug 21 is total North American eclipse. Hoping for sharp moves up in VIX. Think that will be the money trade.
Right back in that channel she goes. lmao.
SPX is not back in the channel. The bottom of the channel now sits around 2475-2476 and should act as major resistance. It is not surprising we would see a midday retest. RUT’s retrace has been much, much shallower, so I am unconvinced this low volume run up means anything. If RUT returns to the 1426 handle I would be much more convinced.
Looks like you are correct. I had mine a bit low and didn’t notice!
If you’re using Motive Wave then you have to condense the chart then expand for channels to sit right. It has to “see” the anchor points for it to place it correctly.
This may also be the same for other charting platforms, not sure.
Gotta head out early today. Stay frosty! 🙂
Sure am frosty down here in the middle of winter in NZ 🙂
yesterday Hot Blooded,, today Cold as Ice,,,both Foreigner songs
by the way,, heat wave here in Wash. St. 90+. Rodney is likely laying necked in a river somewhere in nowhere,just to stay cool.
I guess it is still possible that we could be looking at a zig zag for a second wave correction but if that is the case we need that third wave down to get going before the close. Hesitation around pivots really bite. It is usually a clue that the uptrend is not yet done.
The Euro currency ETF, FXE is displaying one of those “false flag” set-ups today. After penetration of the upper BB on Monday it posted a doji near the upper BB which I think indicated exhaustion of the move. Predictably, some slick market makers stepped into today and ramped it up to ambush whoever went short on the doji yesterday. I know several traders that did. Some of them are going to get stopped out today for certain.
A few savvy ones are going to add to their positions. Let’s take some free money with the August 18 115 puts for 0.78 cents. They could pump it higher hence the later expiration date.
These guys are too smart by half. 🙂
It is starting to look that this pivot is not going to decisively fall during the regular session and neither will the DJI gaps be filled. The dip-buyers, be they banksters or retail lemmings will keep this thing elevated for at least one more day. A time for patience methinks.
RUT has seemingly capitulated the 1426-1427 handle. Next stop, 1400? It is now or never for P4. The decline so far is broad but lacks volume at this point. We are only down 0.25% so if/when volume picks up we should get confirmation.
The lack of downward momentum is starting to be a bit of an issue. A primary degree trend change should really not be so tentative as this appears to be.
I am starting to think we may have one more leg up to a final top. The initial impulse down at primary degree trend changes really should decisively take out pivots and that just ain’t happenin’. I really don’t like it but price is what it is.
Another remote possibility is that this a much more significant top than most of us think hence the torpidity of the turn.
There isn’t really support from breadth or volume on this run up. I think it’s most likely a retest of the bottom edge of Lara’s channel. We are still 10 points off the price invalidation point for the current wave count. I am not an expert on Elliot Waves by any means but it seems like the Fibonacci ratios from the hourly chart are acting as pretty reliable predictors of support and resistance. I wouldn’t expect SPX’s intermediate A wave of P4 to come on a day that the Dow opens at an all time high. If SPX closes inside the channel and RUT retraces to 1426 I would have a very different opinion.
Selling NFLX 180.00 puts for 2.30…
Well, well well…it does seem as if the boys have moved the game to trying to pump NFLX. Remarkable it is up off this morning’s 177.81 lows. Are you kidding me?
Who is throwing money at this creature?? I’ll take it! 🙂
Buying 180 puts expiring Friday for 1.56…
Below 2466.48 for confirmation…
Another quick double on 75 strike DDS puts!
It still has a long way to fall. Will reload on the next pop but I think the market makers are onto me and are not about to give me another such opportunity! Rats! 😀
Nine waves up in DJI off the lows. They are burning a LOT of capital to arrest the decline.
Coming back for the 2470 smooch….
They are burning an awful lot of capital trying to keep those DJI gaps open. Yikes!
Adding to KSS 40 puts. Long upper wick….
PLEASE DON’T BOUNCE 20 POINTS NOW.
It could, but it won’t matter….I doubt it will though.
If it goes back above 2470 I would run like my hair is on fire! 🙂
Are you running yet?
Not quite….5 down 3 up so far…
I guess price did move beyond the end of the third wave at 2480.38 so this could still have been and ED. If it is, there will be no pussy footing around. These things mean business when they complete and waste no time getting back to the beginning of the ED . The bearish engulfing candle looks like a good start.
Taking the money and running on the rest of my NFLX 85 puts. It is still too bloated for an enterprise that does nothing but loose money by the billions.
We do seem to have left the comfy confines of SPX 2070. I suspect it will be a few weeks before we re-visit it. Look for a final kiss good-bye but I think that’s all she wrote! 🙂
Might be. I’m watching now for a nice pull-back to maybe hop on for at least a short ride. We’ll see…
I am not liking those open DJI gaps one bit. Deep pockets keep stepping in to keep ’em open and that is not too good….
OK people, the 2470 pivot coming up for testing. What happens here will tell is if we are gong to have another day or two of snooze-fest.
He! He! It looks like quite a few folk piled into the DDS puts. I have rarely seen them abandon an ambush trade with such haste. This reminds of the days I used to trade with Bottarelli Research and would roll on the floor with laughter as we watched trades pop when a few hundred thousand worth of option contracts got executed in the space of 15 minutes. The call options we bought close to expiration dates would really pop as the market makers scrambled to buy shares since they could never be sure if we intended to take delivery on in the money contracts or take the money and run. Boy those days were fun! 🙂
Last few sessions gaps open filled in SPX, but not in DJI. The trend change should see all three in DJI filled on the first impulse down; meanwhile….ZZZZZZ…! 🙂
If we take out 2470 I may have to revisit that ED thesis…! 🙂
Although it has a lower probability, I must say I do like the ED in SPX as it lines up precisely with what seems to be happening in DJI. We should get a throw-over the top boundary of the diagonal followed by a swift reversal today or tomorrow.
VIX continues to coil as the short-sellers hold on for dear life. Chris Vermeulen has identified August as a month for volatility fireworks. The action should get hot and heavy shortly and will probably be quite dramatic due to the historically unprecedented short positions accumulated the last many months. The whipsaws as traders battle it out are going to be manic. I recommend quick scalping and harvesting profits intra-day. This is not a buy-and -hold market and has not been for some time.
Another reason I like the ED is virtually all sideways meandering in the market eventually resolves with at the very least a short term move to the upside. I have never seen the market drop into a new downtrend over the last year or so after sideways consolidation and think we will see a similar outcome now.
well looky here, 1st again