Price has moved higher as last analysis expected. The Elliott wave target remains the same.
Summary: While price remains above 2,418.71, then expect it is more likely that this downwards movement is a smaller pullback within an ongoing upwards trend. The target is now at 2,450 with the classic analysis target at 2,448.
A new low below 2,418.71 would see the pullback as either intermediate (4) or primary 4. At that stage, expect it to be deeper and longer lasting.
New updates to this analysis are in bold.
Last monthly and weekly charts are here. Last historic analysis video is here.
MAIN ELLIOTT WAVE COUNT
WEEKLY CHART
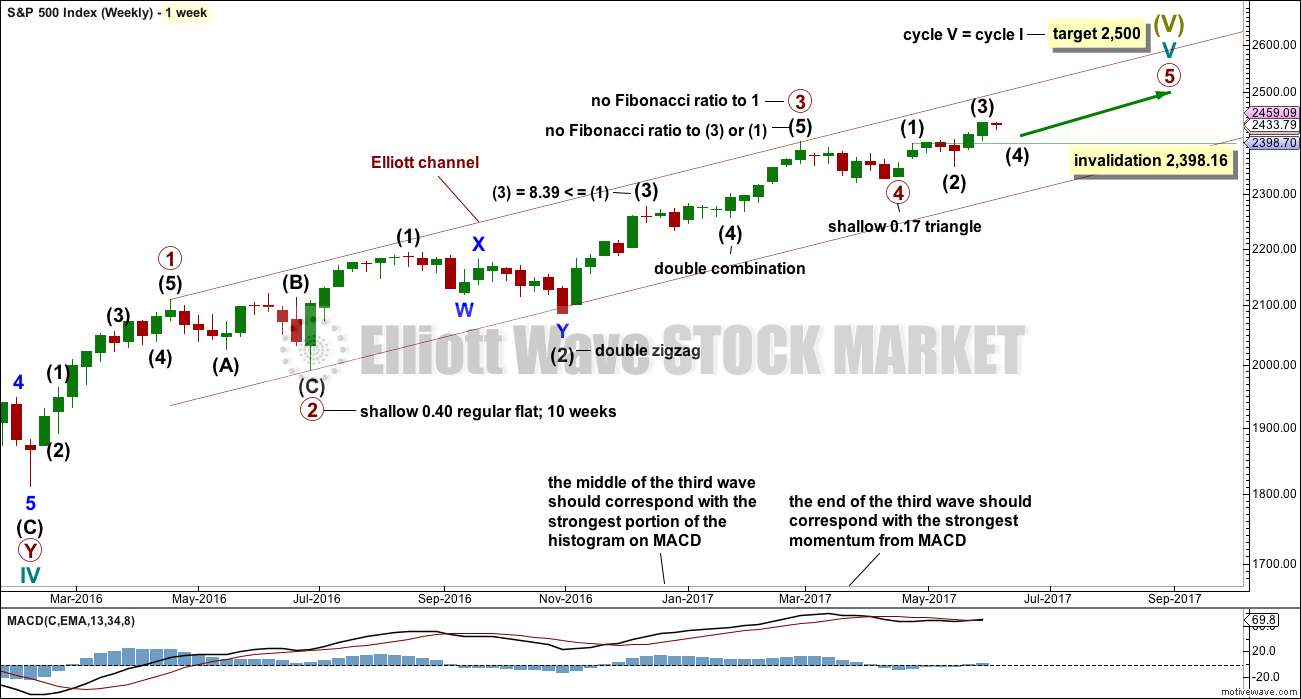
This wave count has a better fit with MACD and so may have a higher probability.
Primary wave 3 may be complete, falling short of 1.618 the length of primary wave 1 and not exhibiting a Fibonacci ratio to primary wave 1. There is a good Fibonacci ratio within primary wave 3.
The target for cycle wave V will remain the same, which has a reasonable probability. At 2,518 primary wave 5 would reach 0.618 the length of primary wave 1. If the target at 2,500 is exceeded, it may not be by much.
There is alternation between the regular flat correction of primary wave 2 and the triangle of primary wave 4.
Within primary wave 3, there is alternation between the double zigzag of intermediate wave (2) and the double combination of intermediate wave (4).
If primary wave 4 is over and primary wave 5 is underway, then within primary wave 5 intermediate wave (2), if it moves lower, may not move beyond the start of intermediate wave (1) below 2,344.51 (this point is taken from the triangle end on the daily chart).
DAILY CHART
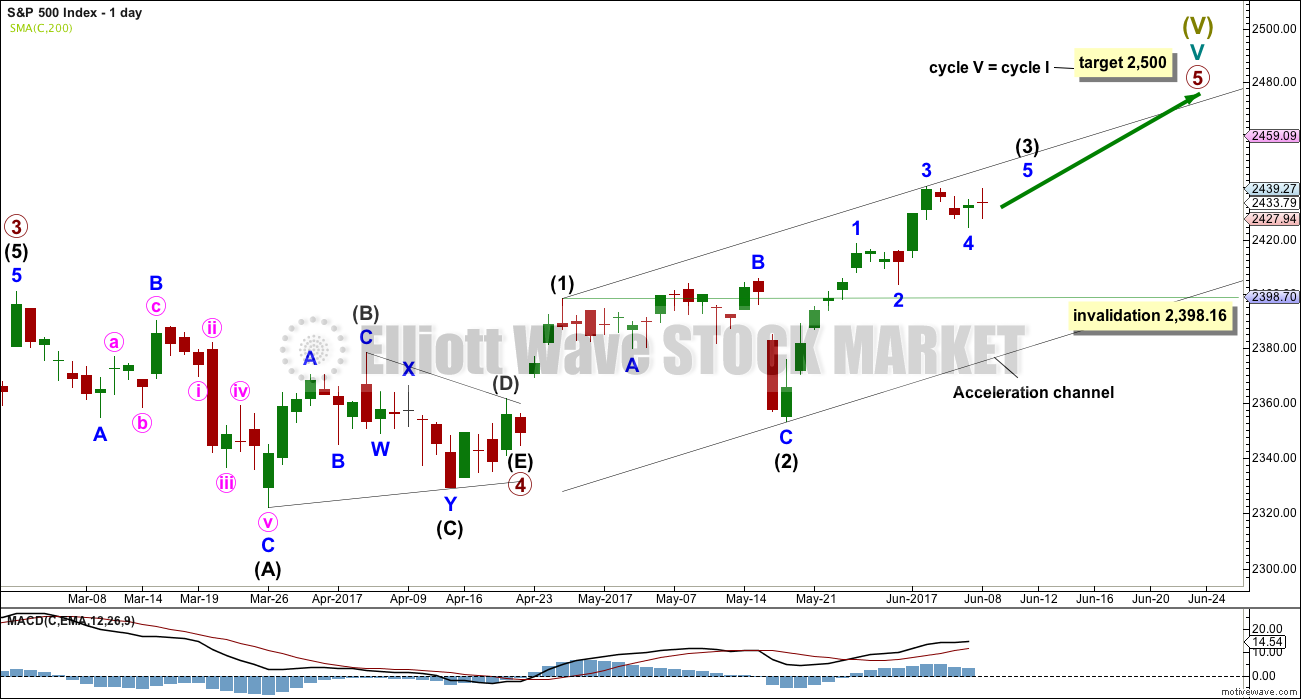
Primary wave 5 must complete as a five wave motive structure, either an impulse (more common) or an ending diagonal (less common). So far, if this wave count is correct, it looks like an impulse.
Intermediate wave (3) now looks best on the daily chart if it is incomplete. The last small correction may only be minor wave 4. Thereafter, minor wave 5 should move price higher, and this looks like it may have begun today.
The alternate hourly chart now considers the possibility that intermediate wave (3) was over at the last all time high.
Intermediate wave (4) may not move into intermediate wave (1) price territory below 2,398.16.
HOURLY CHART
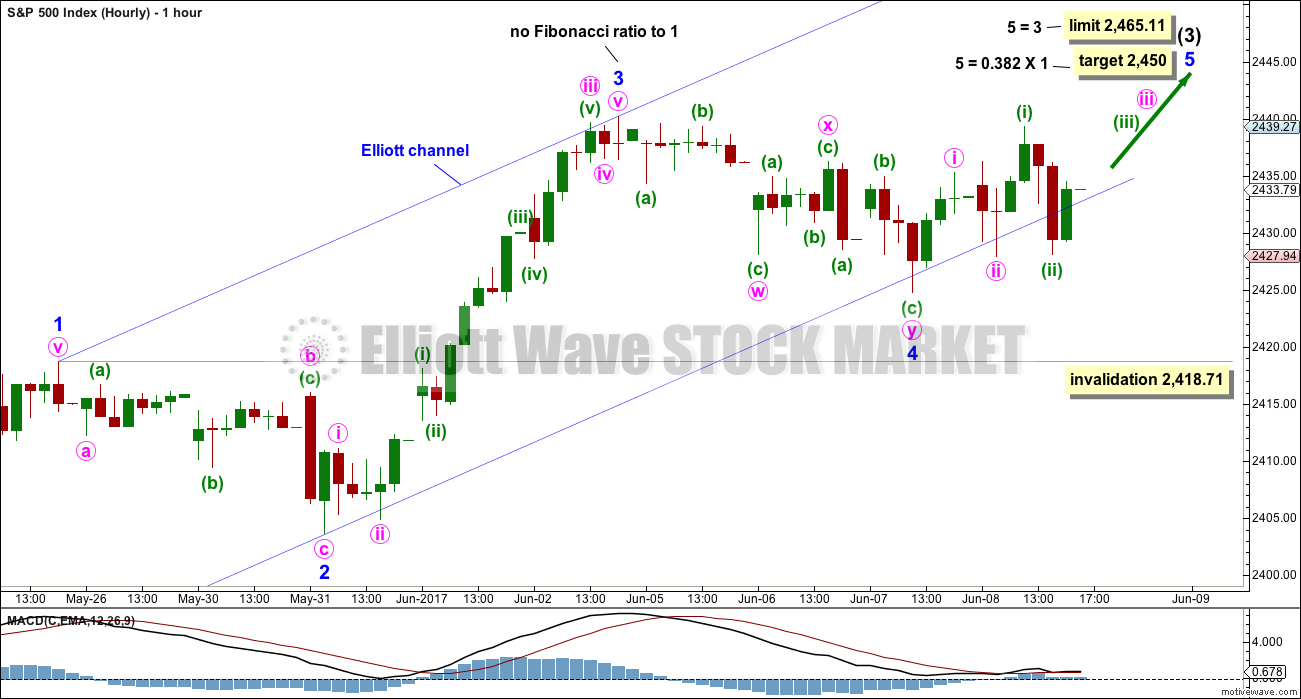
If this labelling of intermediate wave (3) is correct, then within it minor wave 3 is shorter than minor wave 1. Minor wave 5 is limited to no longer than equality in length with minor wave 3, so that minor wave 3 is not the shortest actionary wave and the core Elliott wave rule is met. That limit is now at 2,461.36.
Minor wave 4 may not move into minor wave 1 price territory below 2,418.71.
There is no longer adequate alternation between minor waves 2 and 4. Minor wave 2 is a very shallow 0.23 single zigzag whereas minor wave 4 is now a deeper 0.42 double zigzag. Alternation is a guideline, not a rule.
Minor wave 4 may have ended at today’s low when price came down to touch the lower edge of the Elliott channel.
The target for minor wave 5 is now just 2 points above the target calculated using classic analysis. This area looks like a reasonable point to expect strong resistance.
Minor wave 5 may be remaining mostly within the Elliott channel so far. If it has begun with two overlapping first and second waves today, then tomorrow it should show an increase in upwards momentum and price should move further up into the Elliott channel and remain there.
There is almost no room left for minor wave 4 to move into, so if it does continue further it may be as a flat correction or triangle, both of which are sideways structures.
ALTERNATE HOURLY CHART
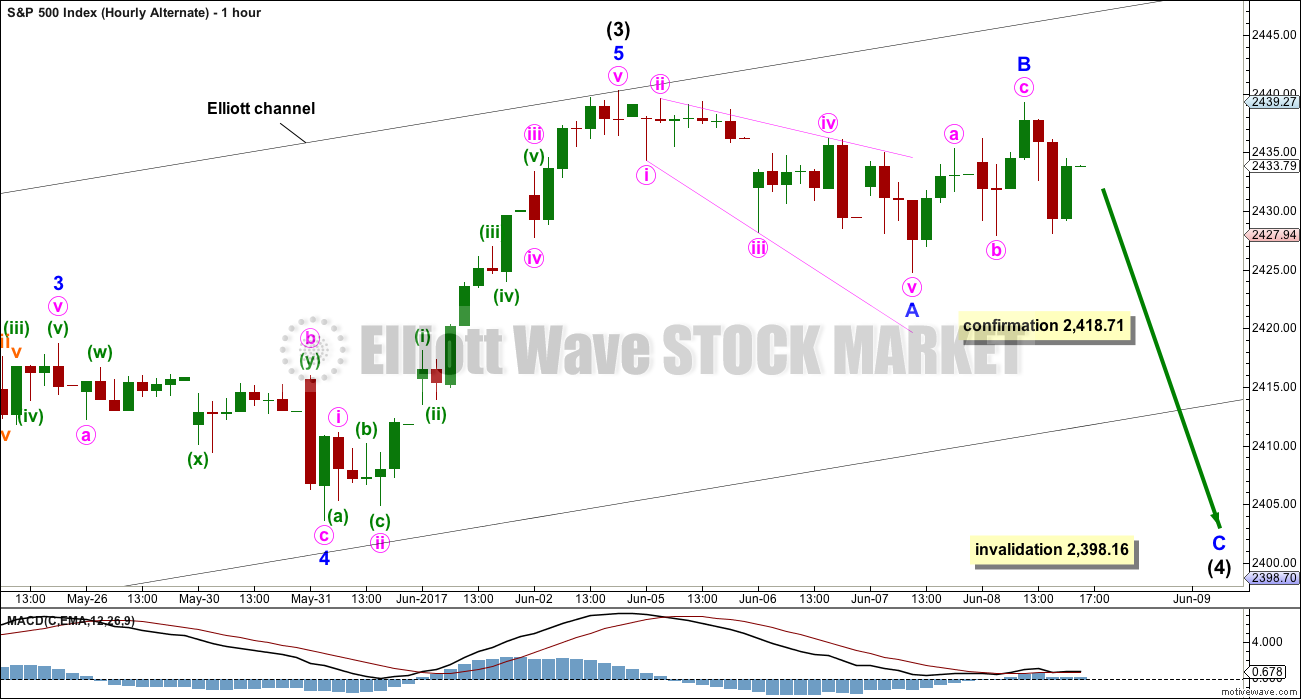
This labelling also remains entirely viable, but it does not have as good a look at higher time frames due to the disproportion between minor waves 2 and 4. Here, there is also no alternation between minor waves 2 and 4; they are both zigzags.
A new low below 2,418.71 would indicate that the correction should be deeper and longer lasting, at least at intermediate degree.
Intermediate wave (4) may not move into intermediate wave (1) price territory below 2,398.16.
At this stage, both hourly charts have a good fit for most recent movement. Neither has a better fit than the other.
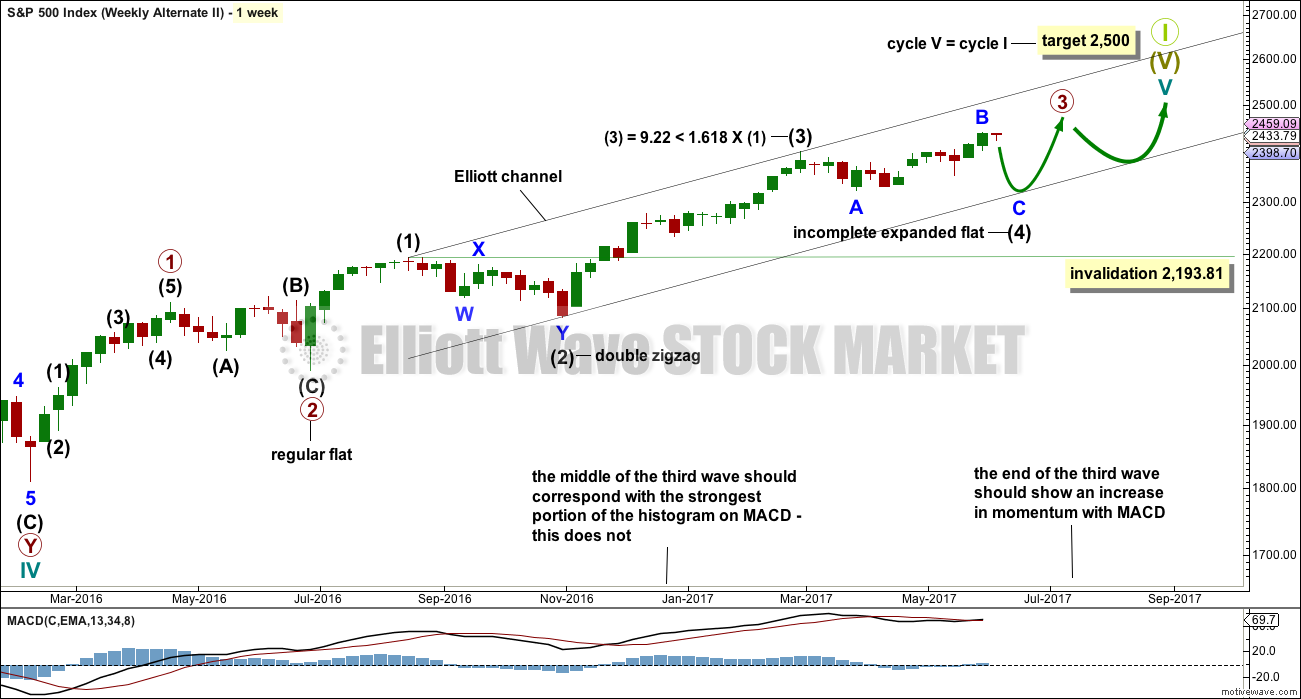
ALTERNATE WEEKLY CHART
This weekly chart has been published with a slight variation before.
It is still possible that intermediate wave (4) is incomplete and may be continuing as a very common expanded flat correction.
This weekly wave count expects a slow end to Grand Super Cycle wave I at the target at 2,500. Once intermediate wave (4) is over, then intermediate wave (5) would be expected to move above the end of intermediate wave (3) at 2,400.98 to avoid a truncation; it need not make a new all time high (but would be likely to do so).
Thereafter, another multi week sideways correction for primary wave 4 may unfold that must remain above primary wave 1 price territory, which has its extreme at 2,111.05.
Finally, a last upwards wave for primary wave 5 towards the target at 2,500 should show substantial weakness.
This wave count allows for the target at 2,500 to be reached possibly in October.
When looking at upwards movement so far on the monthly chart, the corrections of intermediate waves (2) and (4) show up. This is how the labelling fits best at that time frame.
It is also still possible that the expanded flat correction could be labelled primary wave 4 as per the alternate published here.
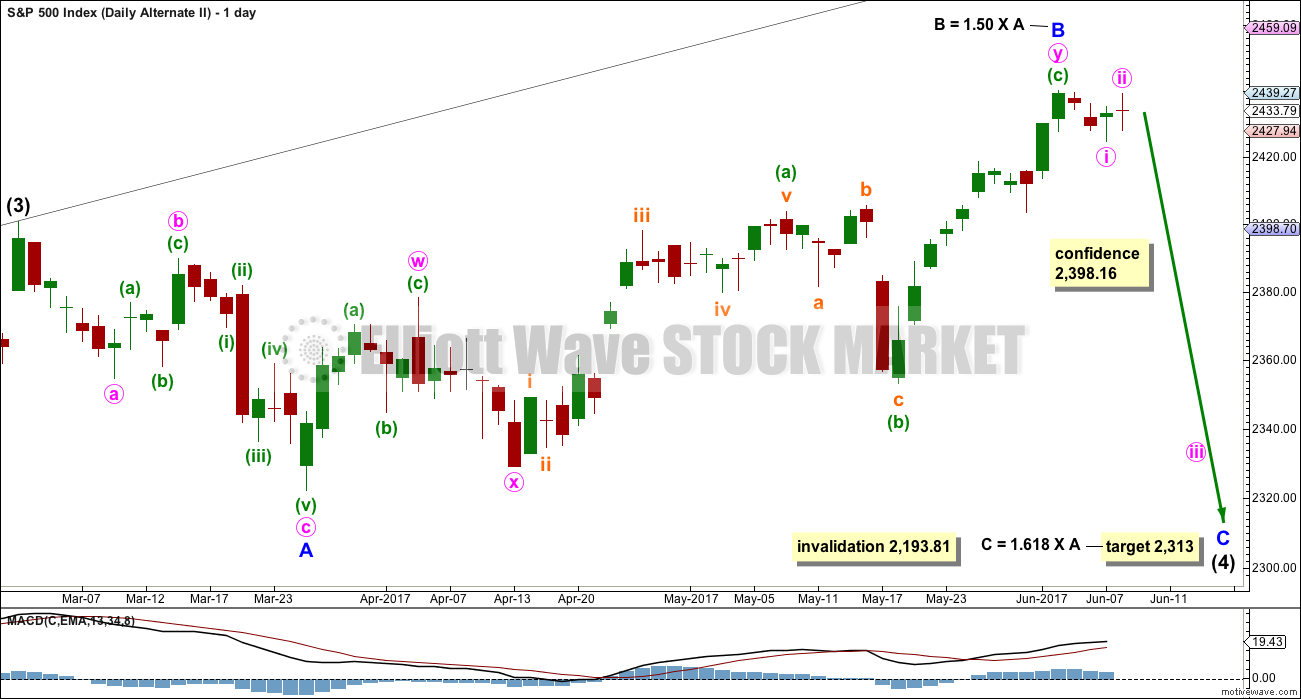
ALTERNATE DAILY CHART
Expanded flat corrections are very common structures. They subdivide 3-3-5. Within this one, minor wave B would now be just beyond the common range of 1 to 1.38 the length of minor wave A.
The target for minor wave C is recalculated.
The target calculated expects price to find strong support at the lower edge of the black Elliott channel, which is copied over from the weekly chart.
TECHNICAL ANALYSIS
WEEKLY CHART
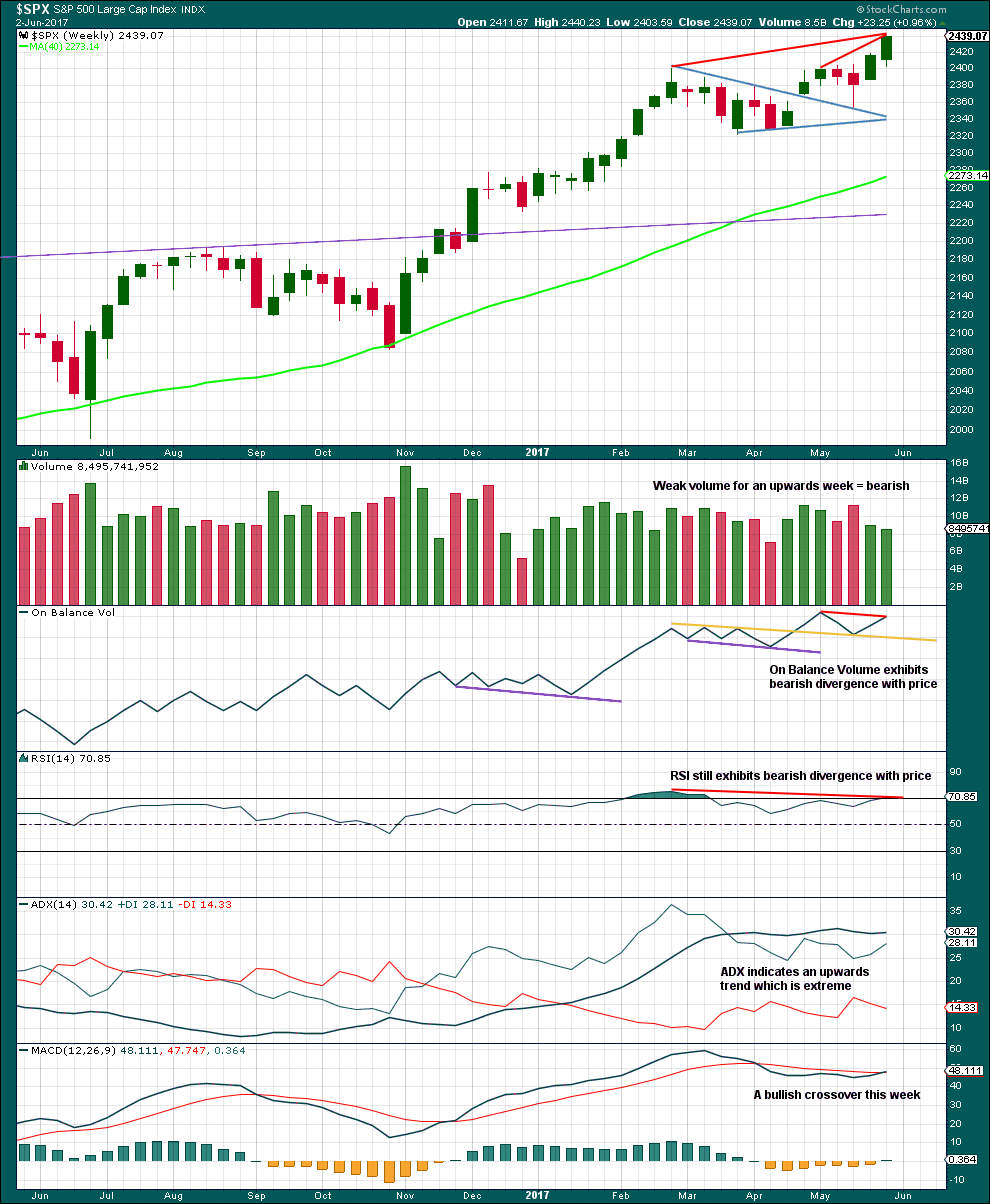
Click chart to enlarge. Chart courtesy of StockCharts.com.
On Balance Volume gives the most recent signal as a weak bearish divergence with price.
Volume is bearish. RSI divergence is bearish. ADX at extreme is bearish.
MACD is now bullish.
Although this chart is bearish, we have been here before. The reality is price keeps rising although indicators are bearish. This bearishness should tell traders to protect long positions with stops, and be aware the market is currently vulnerable to a pullback. It does not tell traders to enter short here; that would be premature.
DAILY CHART
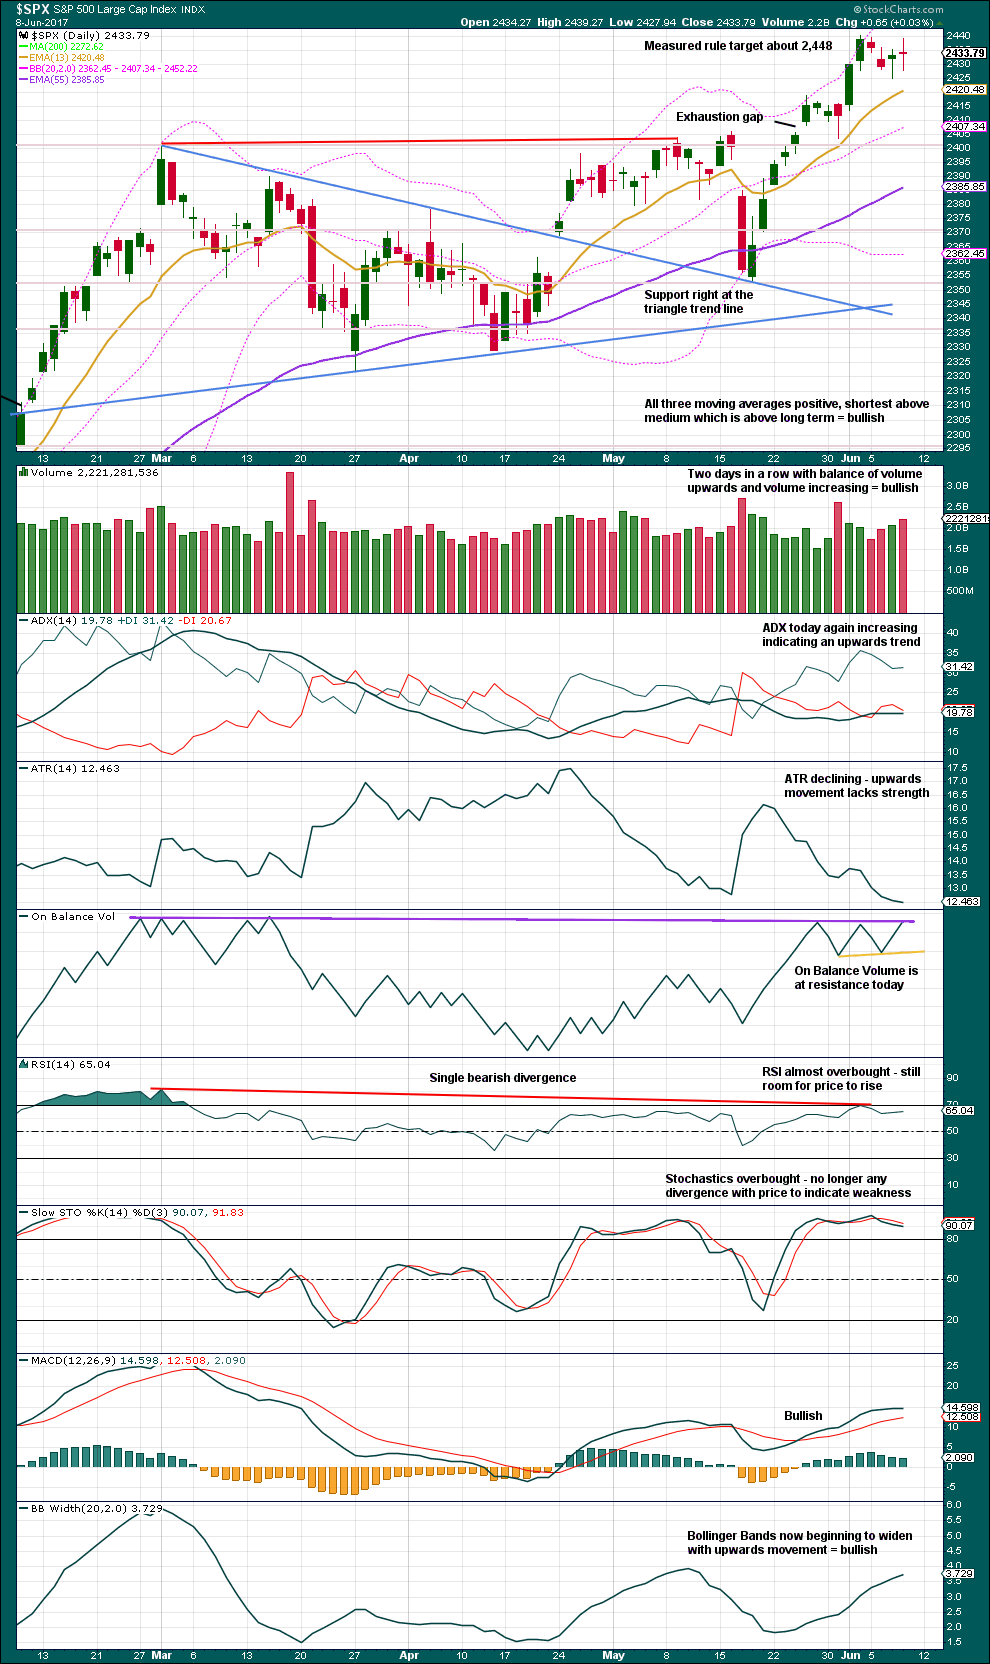
Click chart to enlarge. Chart courtesy of StockCharts.com.
If the widest part of the symmetrical triangle is taken from the high of the 1st of March to the low of the 27th of March, then a measured rule target would be at 2,448. Use this target and the Elliott wave target at 2,450 as a zone for long positions.
On Balance Volume today is at resistance, so this may serve to halt the rise in price. This supports the alternate hourly Elliott wave count today. If tomorrow does see another upwards day, then On Balance Volume would give a strong and important bullish signal that should be given reasonable weight.
Volume is again bullish. The doji candlestick for today is neutral. It looks like a small consolidation is continuing. The breakout should be upwards.
VOLATILITY – INVERTED VIX CHART
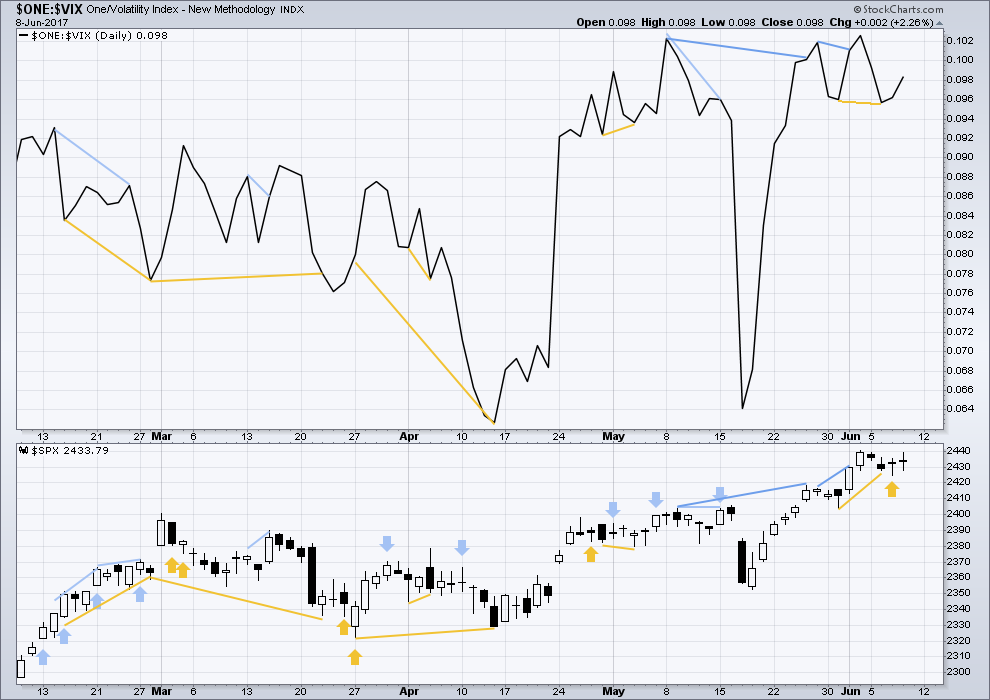
Click chart to enlarge. Chart courtesy of StockCharts.com.
Normally, volatility should decline as price moves higher and increase as price moves lower. This means that normally inverted VIX should move in the same direction as price.
Two bullish signals have now been followed by upwards movement. This may be followed by one more upwards day or it may be resolved here.
BREADTH – AD LINE
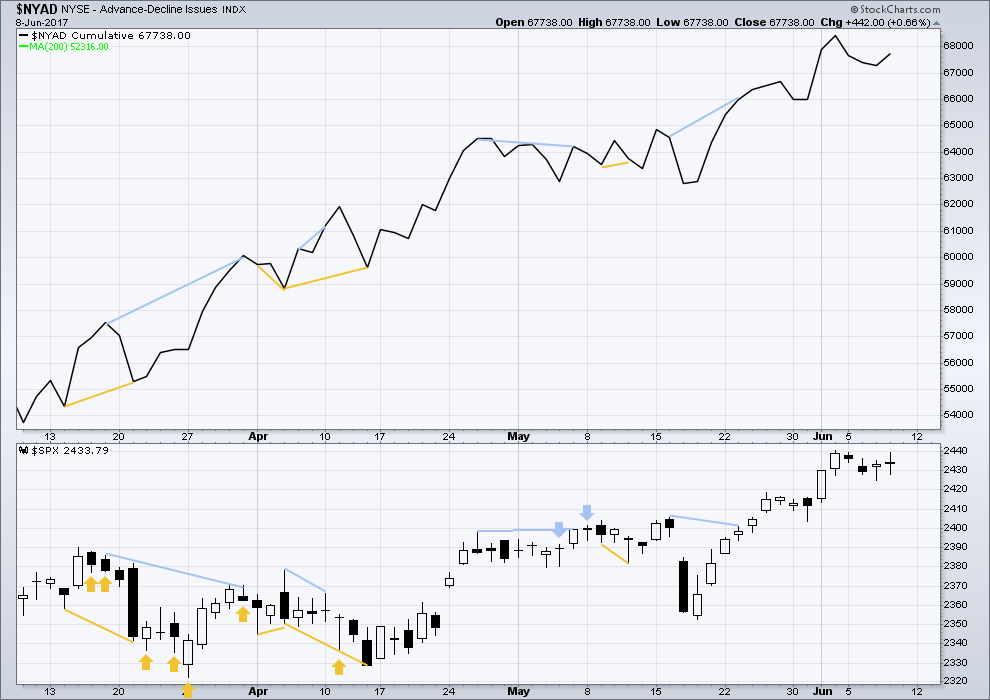
Click chart to enlarge. Chart courtesy of StockCharts.com.
With the last all time high for price, the AD line also made a new all time high. Up to the last high for price there was support from rising market breadth.
There is normally 4-6 months divergence between price and market breadth prior to a full fledged bear market. With no divergence yet at this point, any decline in price should be expected to be a pullback within an ongoing bull market and not necessarily the start of a bear market.
There is no divergence for the short term at this time to indicate weakness.
At the end of last week, it is noted that the mid caps and small caps have failed to make new all time highs. There is some internal weakness with increasing selectivity in this market.
DOW THEORY
At the end of last week, Nasdaq, DJIA and the S&P500 have all made new all time highs. DJT has failed to confirm an ongoing bull market because it has not yet made a new all time high. However, at this stage that only indicates some potential weakness within the ongoing bull market and absolutely does not mean that DJT may not yet make new all time highs, and it does not mean a bear market is imminent.
The following lows need to be exceeded for Dow Theory to confirm the end of the bull market and a change to a bear market:
DJIA: 17,883.56.
DJT: 7,029.41.
S&P500: 2,083.79.
Nasdaq: 5,034.41.
Charts showing each prior major swing low used for Dow Theory are here.
This analysis is published @ 07:40 p.m. EST.

I’m off bush to help Kiwi today. Your end of week analysis will be done tomorrow and published Saturday evening EST. You’ll still have all of Sunday to review it.
That last ATH looks like the end of the third wave.
The structure of the fourth wave had me stumped temporarily. But I think there’s a bunch of expanded flats, nested B waves within B waves. This fits very neatly, but I still need to check the subdivsions on the 5 minute chart.
Minor 4 could have been a regular flat. Now there’s perfect alternation with the zigzag of minor 2. No Fibonacci ratios between minor 1, 3 and 5, but that’s not unusual for the S&P.
They sure are starting to come out of the woodwork. Another confident boast in my inbox from Keith Fitz-Gerald- Dow will hit 60,000.00!
Granted he later qualifies it by saying “in the next ten years”, but that makes him no less wildly bullish. Must be getting close…
Hi Verne, do you an Intermediate decline – r we not starting intermediate wave 4 down?
I prefer the count that sees a primary 4 down, although it could also be an intermediate wave.
Me too. But lets assume the bull has longer to run… until price tells us it doesn’t.
The line in the sand between intermediate (4) and primary 4 is 2,398.16. If we see a correction which remains above that, we should assume it’s intermediate (4).
But if it doesn’t then we’ll know it’s primary 4.
I believe so Nick..intermediate degree
Bradley turn today. Projected low June 12th.
Yep. Another major date June 20. This is the way a primary wave decline should commence. I expect it to be deeper than most expect ahead of the final manic wave up into the Fall season. Looking forward to Lara’s downside target but it should head to about 2300.00
Have we seen A of 4 just finish or is this just 1 of of A of 4?
Virtually impossible to say at this early stage. We do have a complete five down so it very well could be a complete A of a Zig Zag or just wave one of A, assuming the fourth will turn out to be a Zig Zag.
Well, this day is turning out to be quite interesting. 2446 happens and then tech tanks and seemingly everything else?
I also think the alternate charts can probably be tossed out the window.
?? why??
They’re still entirely valid.
The high was the end of a third wave.
I suspect Joshua posted that prior to that brutal reversal… 🙂
Oh yes, probably.
IWM trading in rarefied air indeed. Looks like it is about to suffer from a bit of oxygen deprivation. A classic RTM set-up methinks….
It looks as if NDX, as it led the way up, is leading the turn down. I don’t remember ever seeing NDX futures firmly in the red on the same day all the indices were making new 52 week highs.
Also, Elon top ticked his own stock by taunting the shorts yesterday via twitter
Pride goeth before a fall…
Lara the 2448 number appears like it was dead on. With how bad breadth is today; NASDAQ rolling, TRANS and UTILITIES negative. This may by 5 of 3 finally.
I took me awhile. But paying attention to Lara’s price targets is the key to profitably trading her incredible analysis. I don’t know how she does ( seems even refined for fib analysis). Once again spot on!
Lara, I am interested to see monthly chart but when I click on your link “Last monthly and weekly charts are here” I am taken to a google search results page.
Thank you for letting us know about the broken link. I’ve fixed the problem. Now the link works. Cesar
Is it me or is there a broadening megaphone pattern on the Russell 2k? Resistance at 1426; seems like if there’s going to be a 4th wave at high degree there could be a trip to 1220. On the other side, I could see a break out to 1510.
Hi Chris,
Here is my take on IWM. It is breaking out of a six month long consolidation (rectangle). It has broken out of the 4th wave triangle, returned to touch the upper triangle line and is now breaking out of the entire pattern. the projection is about an 8 point (~5.7%) move upwards to 148 or so.
Thanks Rodney!
yup,, here I am
Hi Doc. Nice to see ‘ya