Downwards movement was expected. Another red daily candlestick has made a new low.
Summary: While price remains above 2,418.71, then expect it is more likely that this downwards movement is a smaller pullback within an ongoing upwards trend. The target is now at 2,454 with the classic analysis target at 2,448.
A new low below 2,418.71 would see the pullback as either intermediate (3) or primary 4. At that stage, expect it to be deeper and longer lasting.
New updates to this analysis are in bold.
Last monthly and weekly charts are here. Last historic analysis video is here.
MAIN ELLIOTT WAVE COUNT
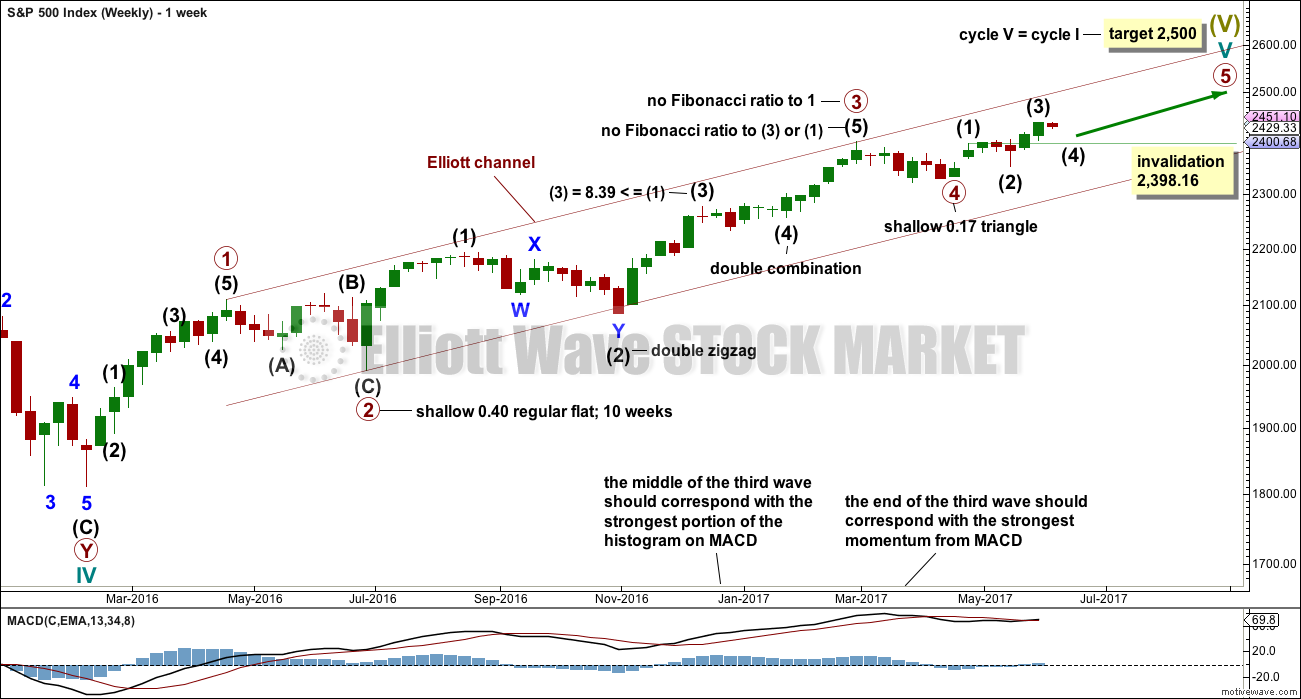
WEEKLY CHART
This wave count has a better fit with MACD and so may have a higher probability.
Primary wave 3 may be complete, falling short of 1.618 the length of primary wave 1 and not exhibiting a Fibonacci ratio to primary wave 1. There is a good Fibonacci ratio within primary wave 3.
The target for cycle wave V will remain the same, which has a reasonable probability. At 2,518 primary wave 5 would reach 0.618 the length of primary wave 1. If the target at 2,500 is exceeded, it may not be by much.
There is alternation between the regular flat correction of primary wave 2 and the triangle of primary wave 4.
Within primary wave 3, there is alternation between the double zigzag of intermediate wave (2) and the double combination of intermediate wave (4).
If primary wave 4 is over and primary wave 5 is underway, then within primary wave 5 intermediate wave (2), if it moves lower, may not move beyond the start of intermediate wave (1) below 2,344.51 (this point is taken from the triangle end on the daily chart).
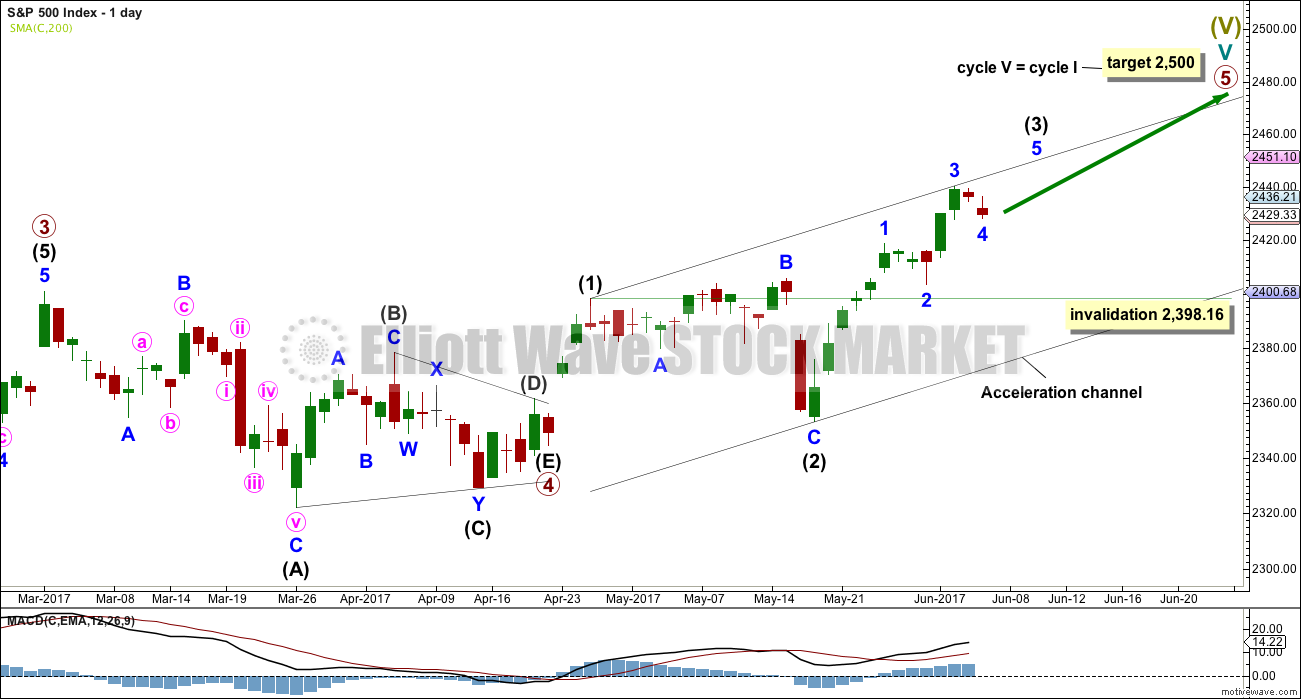
DAILY CHART
Primary wave 5 must complete as a five wave motive structure, either an impulse (more common) or an ending diagonal (less common). So far, if this wave count is correct, it looks like an impulse.
Intermediate wave (3) now looks best on the daily chart if it is incomplete (so the hourly charts are swapped over today). The current correction may only be minor wave 4. Thereafter, minor wave 5 should move price higher, and this looks like it should begin tomorrow.
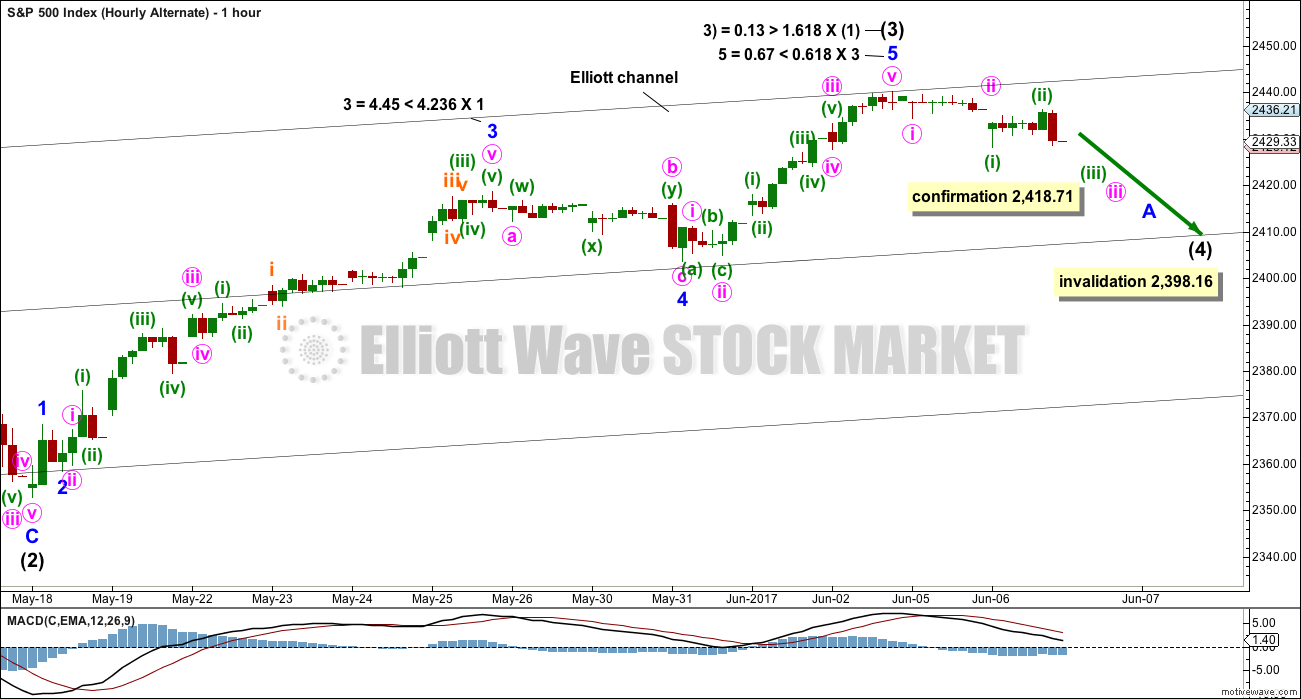
The alternate hourly chart now considers the possibility that intermediate wave (3) was over at the last all time high.
Intermediate wave (4) may not move into intermediate wave (1) price territory below 2,398.16.
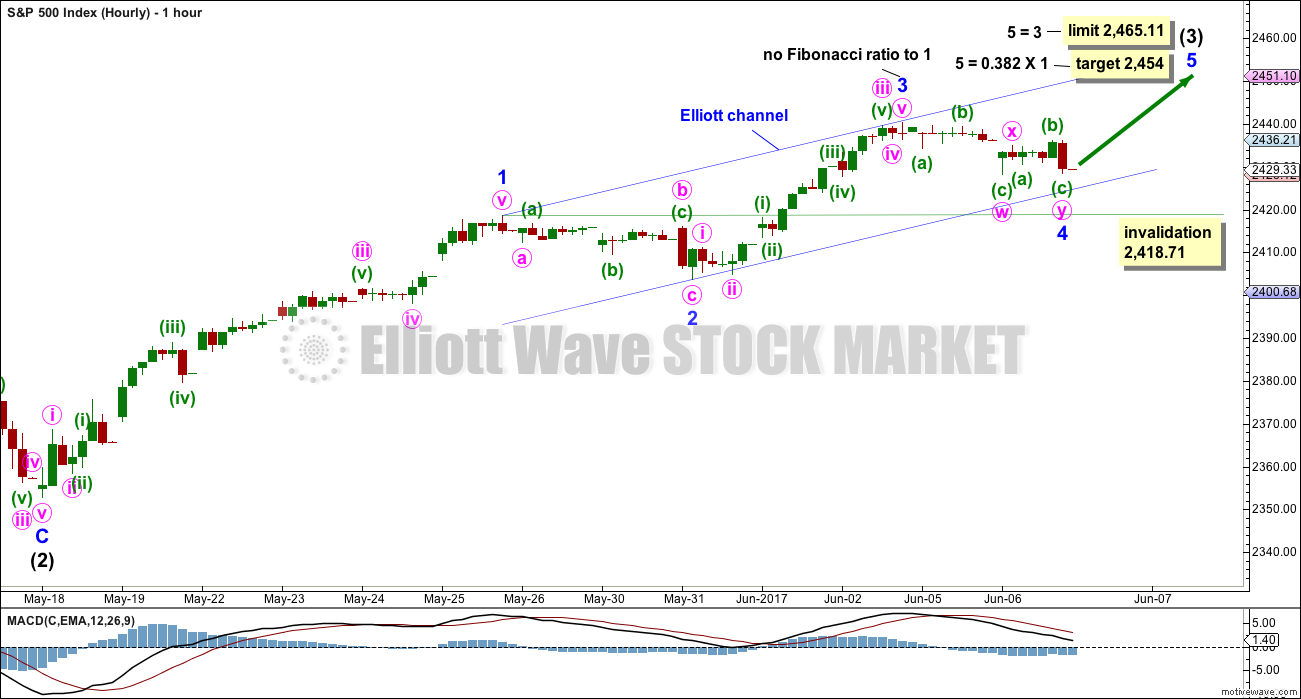
HOURLY CHART
If this labelling of intermediate wave (3) is correct, then within it minor wave 3 is shorter than minor wave 1. Minor wave 5 is limited to no longer than equality in length with minor wave 3, so that minor wave 3 is not the shortest actionary wave and the core Elliott wave rule is met.
Minor wave 4 may not move into minor wave 1 price territory below 2,418.71.
There is alternation between the zigzag of minor wave 2 and the possible double combination of minor wave 4.
ALTERNATE HOURLY CHART
This labelling also remains entirely viable, but it does not have as good a look at higher time frames due to the disproportion between minor waves 2 and 4. Here, there is also no alternation between minor waves 2 and 4; they are both zigzags.
A new low below 2,418.71 would indicate that the correction should be deeper and longer lasting, at least at intermediate degree.
Intermediate wave (4) may not move into intermediate wave (1) price territory below 2,398.16.
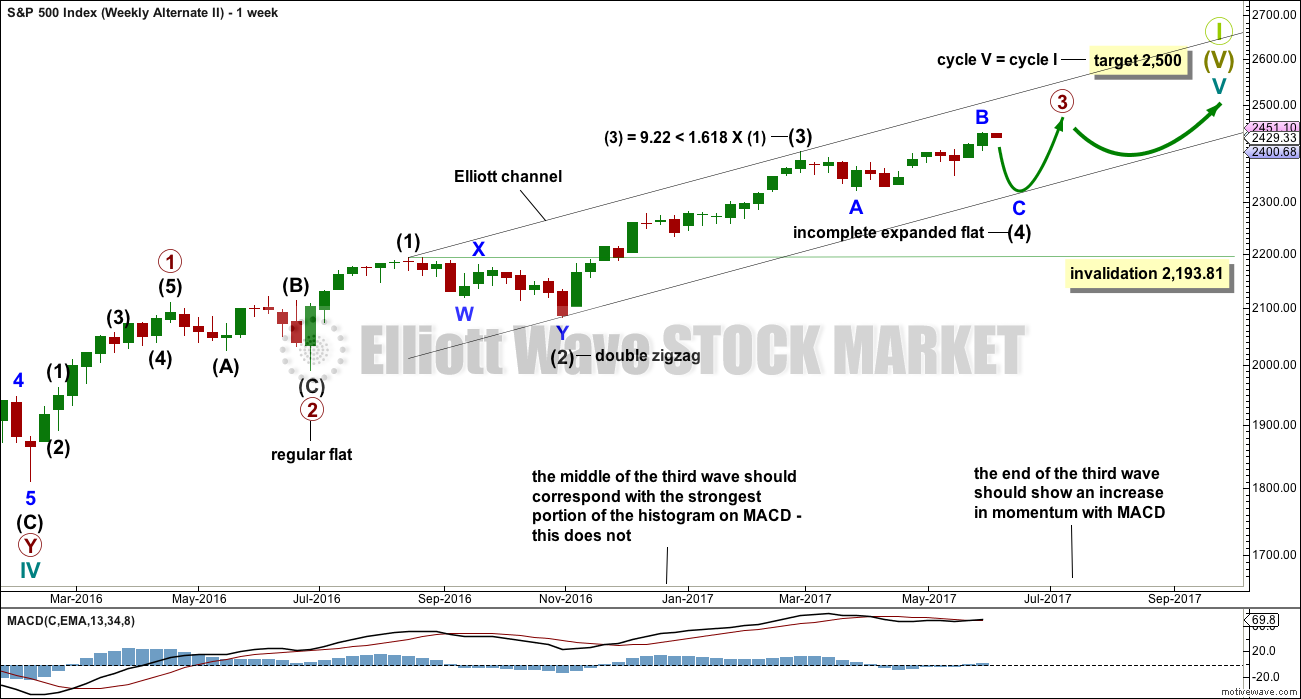
ALTERNATE WEEKLY CHART
This weekly chart has been published with a slight variation before.
It is still possible that intermediate wave (4) is incomplete and may be continuing as a very common expanded flat correction.
This weekly wave count expects a slow end to Grand Super Cycle wave I at the target at 2,500. Once intermediate wave (4) is over, then intermediate wave (5) would be expected to move above the end of intermediate wave (3) at 2,400.98 to avoid a truncation; it need not make a new all time high (but would be likely to do so).
Thereafter, another multi week sideways correction for primary wave 4 may unfold that must remain above primary wave 1 price territory, which has its extreme at 2,111.05.
Finally, a last upwards wave for primary wave 5 towards the target at 2,500 should show substantial weakness.
This wave count allows for the target at 2,500 to be reached possibly in October.
When looking at upwards movement so far on the monthly chart, the corrections of intermediate waves (2) and (4) show up. This is how the labelling fits best at that time frame.
It is also still possible that the expanded flat correction could be labelled primary wave 4 as per the alternate published here.
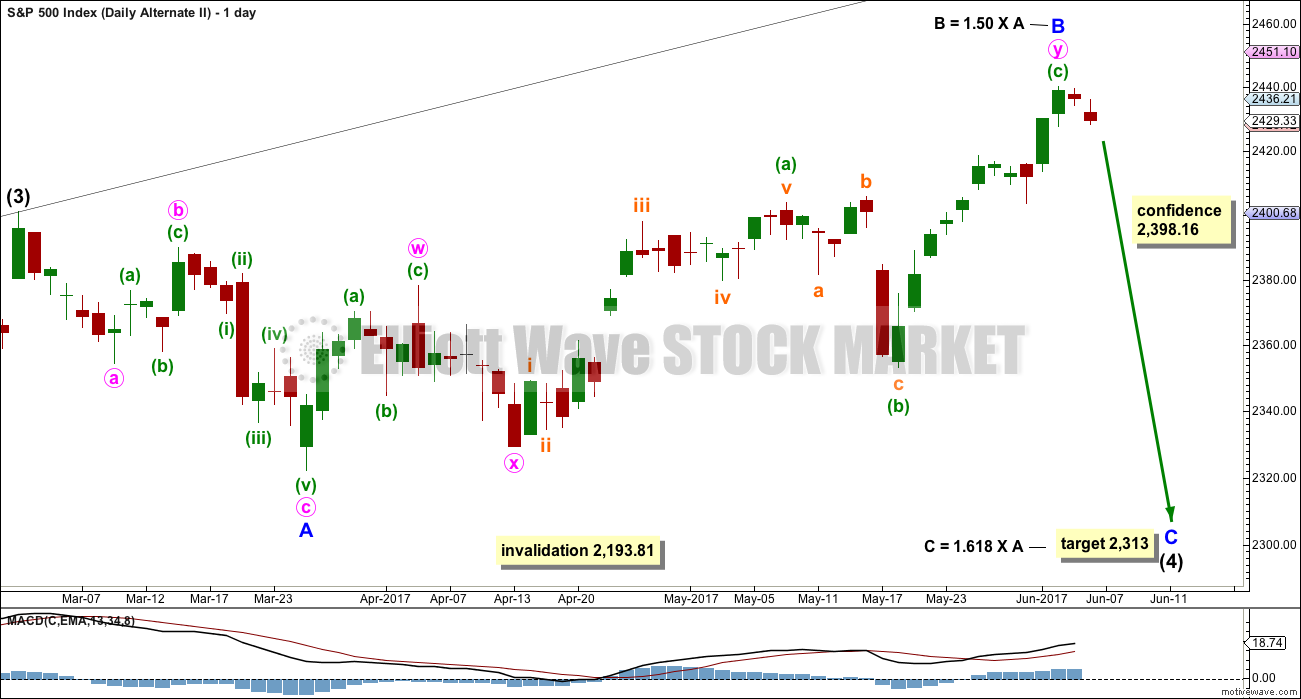
ALTERNATE DAILY CHART
Expanded flat corrections are very common structures. They subdivide 3-3-5. Within this one, minor wave B would now be just beyond the common range of 1 to 1.38 the length of minor wave A.
The target for minor wave C is recalculated.
The target calculated expects price to find strong support at the lower edge of the black Elliott channel, which is copied over from the weekly chart.
TECHNICAL ANALYSIS
WEEKLY CHART
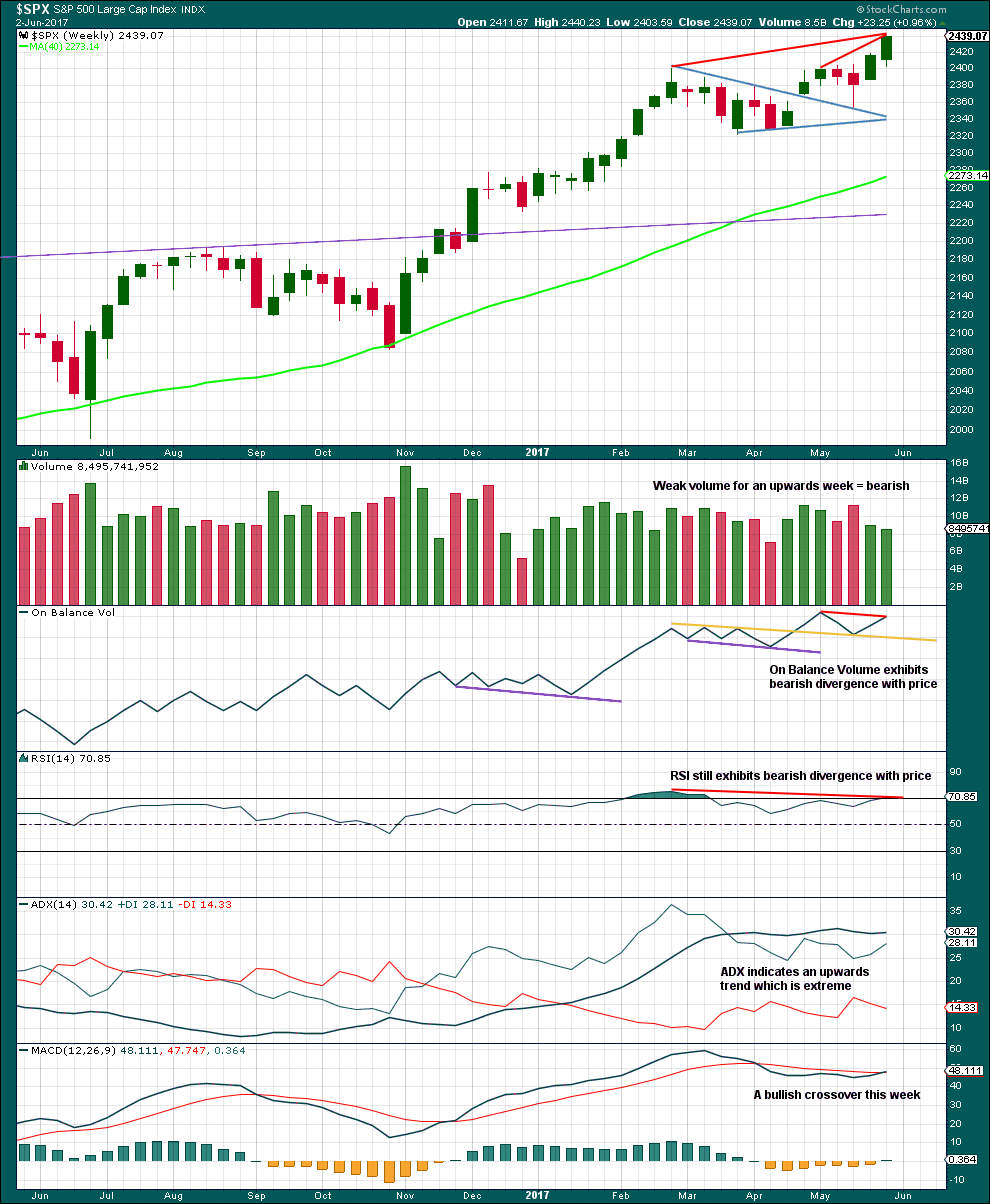
Click chart to enlarge. Chart courtesy of StockCharts.com.
On Balance Volume gives the most recent signal as a weak bearish divergence with price.
Volume is bearish. RSI divergence is bearish. ADX at extreme is bearish.
MACD is now bullish.
Although this chart is bearish, we have been here before. The reality is price keeps rising although indicators are bearish. This bearishness should tell traders to protect long positions with stops, and be aware the market is currently vulnerable to a pullback. It does not tell traders to enter short here; that would be premature.
DAILY CHART
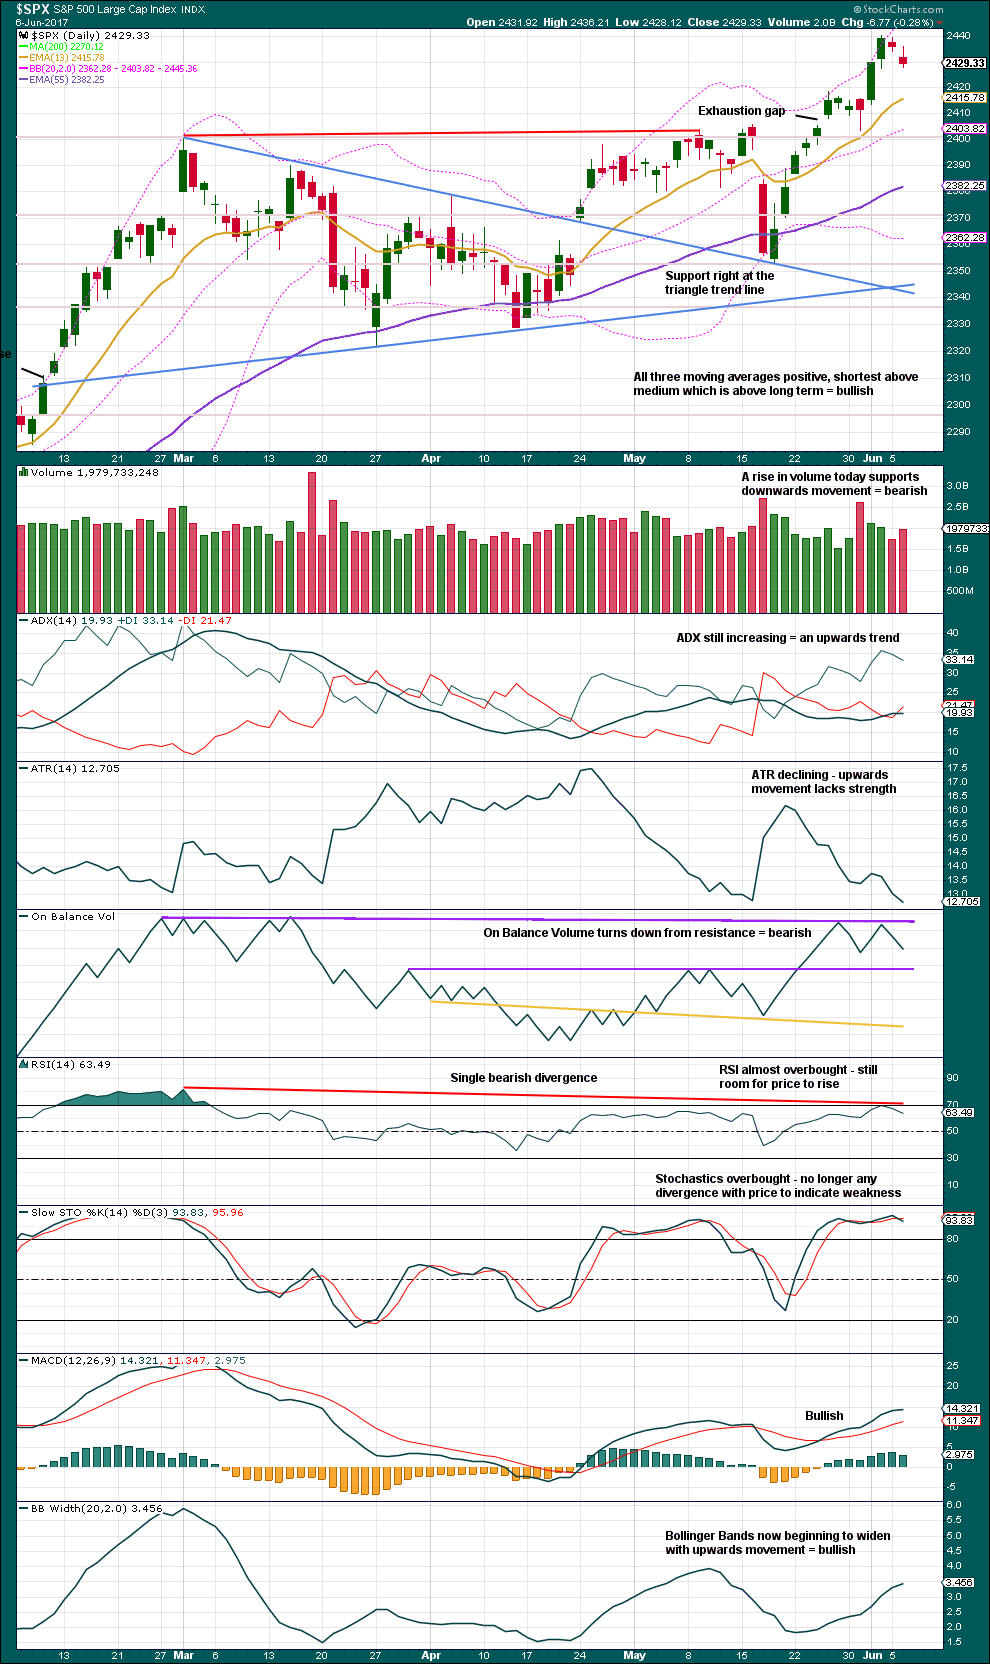
Click chart to enlarge. Chart courtesy of StockCharts.com.
If the widest part of the symmetrical triangle is taken from the high of the 1st of March to the low of the 27th of March, then a measured rule target would be at 2,448. If price continues a little higher this week, then use this target and the Elliott wave target at 2,454 as a zone for long positions.
Volume today is slightly bearish. The last signal from On Balance Volume is bearish.
ATR is bearish; it indicates weakness.
ADX is bullish. Bollinger Bands are bullish.
Stochastics and RSI indicate there is room for price to move higher.
VOLATILITY – INVERTED VIX CHART
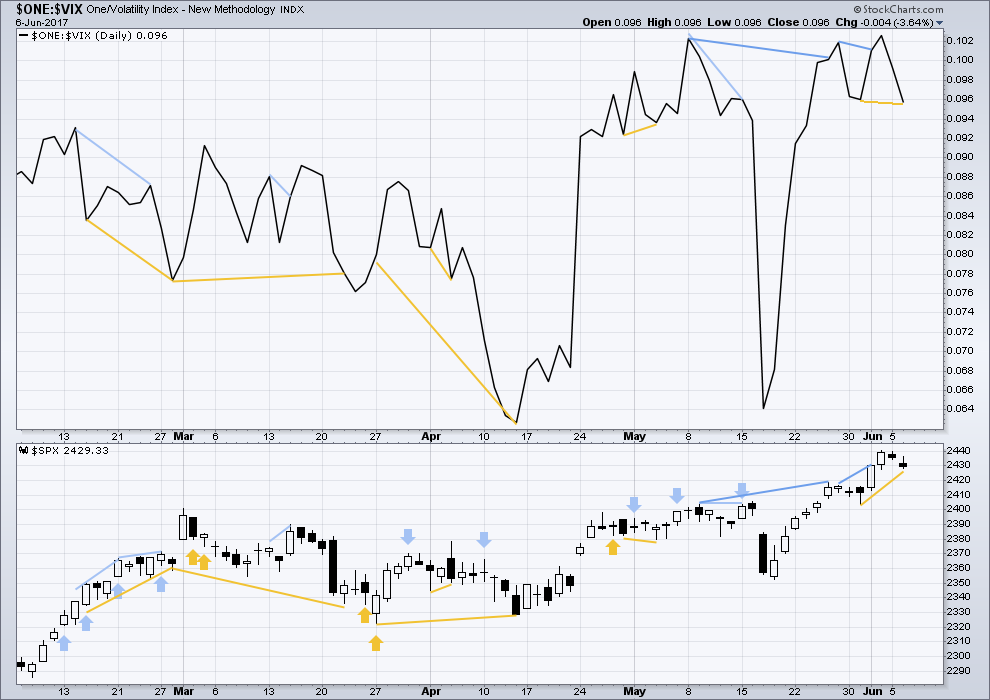
Click chart to enlarge. Chart courtesy of StockCharts.com.
Normally, volatility should decline as price moves higher and increase as price moves lower. This means that normally inverted VIX should move in the same direction as price.
There is weak bullish divergence today between price and inverted VIX: inverted VIX has made a lower low, but price has not. This divergence indicates weakness within price, but it will not be given weight as the difference for inverted VIX is so slight.
BREADTH – AD LINE
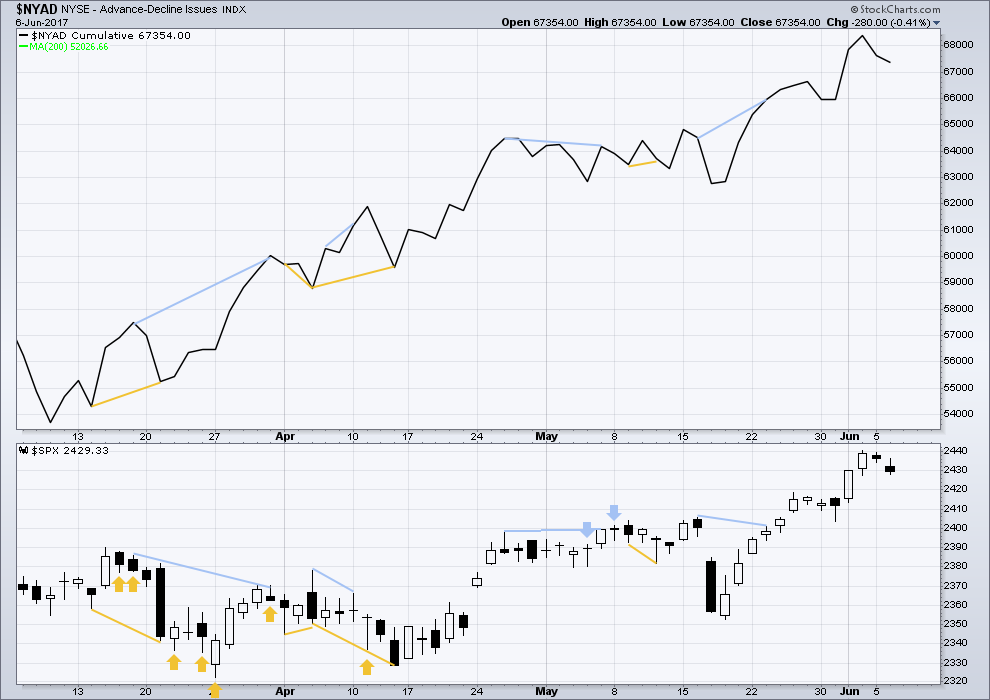
Click chart to enlarge. Chart courtesy of StockCharts.com.
With the last all time high for price, the AD line also made a new all time high. Up to the last high for price there was support from rising market breadth.
There is normally 4-6 months divergence between price and market breadth prior to a full fledged bear market. With no divergence yet at this point, any decline in price should be expected to be a pullback within an ongoing bull market and not necessarily the start of a bear market.
There is no divergence for the short term at this time to indicate weakness.
At the end of last week, it is noted that the mid caps and small caps have failed to make new all time highs. There is some internal weakness with increasing selectivity in this market.
DOW THEORY
At the end of last week, Nasdaq, DJIA and the S&P500 have all made new all time highs. DJT has failed to confirm an ongoing bull market because it has not yet made a new all time high. However, at this stage that only indicates some potential weakness within the ongoing bull market and absolutely does not mean that DJT may not yet make new all time highs, and it does not mean a bear market is imminent.
The following lows need to be exceeded for Dow Theory to confirm the end of the bull market and a change to a bear market:
DJIA: 17,883.56.
DJT: 7,029.41.
S&P500: 2,083.79.
Nasdaq: 5,034.41.
Charts showing each prior major swing low used for Dow Theory are here.
This analysis is published @ 11:37 p.m. EST.

A fourth wave which adheres to it’s Elliott channel…. a beautiful sight if it continues. Not all that common for the S&P. Gold isn’t managing it today.
This is still the main wave count. The low today may be an opportunity to go long with a stop just below the invalidation point. Always use a stop, do not invest more than 1-5% of equity on any one trade.
Manage risk! It’s the single biggest difference between novices who wipe out their accounts, and professionals who make a living at trading. Boring but necessary.
BTW, look for divergence with UVXY on that last move up. It we see a green volatility print during the move up that is usually a good sign it is probably a terminal move. Cheerio!
One more wave up. They are going to probably ramp it close to the close to spring the bull trap starting today and run it up into the close tomorrow. I will reload short before the close tomorrow as I expect and overnight ambush.
Move out of this triangle of some sort should be sharp and should conclude upward movement. Still SOH for me until we get final move up.
I am taking profits on next week’s SVXY puts bought for 6.00. Sold for 8.10.
Moving to sidelines all cash for now. Too much whipsaw so waiting for some directional clarity.
So far gap from Monday provinding resistance. Bulls need to decisively close it to confirm further upside.
Gaps closed
I got out for 5.60. Will add to next week 160 puts when we reach Lara’s new updated target around 2450.00
Once again I have learned the hard way not to let profits sit in this crazy market. Bid on my SVXY 160 puts have gone from a double yesterday at 8.70 to a barely better than break-even 5.00 this morning. I may as well roll ’em…Oh well, I should know better…
Opening sell STC order on SVXY 160 puts expiring this week for limit of 8.50 just in case we are headed higher.
Holding 160 puts expiring next week.
Will add to next week’s position if price moves below 2440.00
Joseph I was wondering if you are keeping and eye on the yield curve. I know you know a lot about FED rates and how they impact the over-all economy and was surprised that you think they can keep this thing inflated much longer. So far as when the thing is going to pop I think an inversion will be the signal. I am starting to re-think the idea that they are going to blink and will indeed raise rates in June and probably one more time this year. Why? Because they apparently don’t learn anything from their past mistakes. I think they will convince themselves, and others that the “low” unemployment rate justifies the rate hikes, and if the ten year rate continues to fall, two more hikes will very likely result in a yield curve inversion . We all know what happens after that- without exception. Everything seems to be converging toward a Fall showdown. Curious to know what you think.
Yes… that is my baby.
Just in the last 7 days US Treasury Yields on mid to long-term have broken below key support levels. When they the break below or above they tend to continue in the direction of the break and it will take several months to repair that damage. With the Fed increasing at least 2 more times this year the 1 mo to 2 year will continue it’s rise.
The Yield Curve is flattening. IMO that flattening will continue.
Yes… over time it may lead to inversion… but not for a long time.
Yes normally that would lead to a major decline in equities… but the market will go higher and higher and higher anyway. Just because it is what it is… pure magic!
As you are well aware… I have no explanation for the continued market rise. I have posted my views the last few years many times on the world wide debt levels and it’s unsustainability and the extreme valuations of US Equities by many measures. Yet… up… up … up and away the market goes. I have thrown in the towel.
yo
Did you mean, “Yo Adrian!”