Downwards movement was expected. Price has moved sideways to print a red daily candlestick.
Summary: The target for a third wave is met and the structure is complete. If price keeps rising, then use the classic target at 2,448. This target is very close to a new Elliott wave target (alternate wave count) at 2,451.
At this stage, a new low now below 2,418.71 would provide strong price indication that a deeper pullback has begun. The target range is 2,418.71 to 2,403.62.
New updates to this analysis are in bold.
Last monthly and weekly charts are here. Last historic analysis video is here.
MAIN ELLIOTT WAVE COUNT
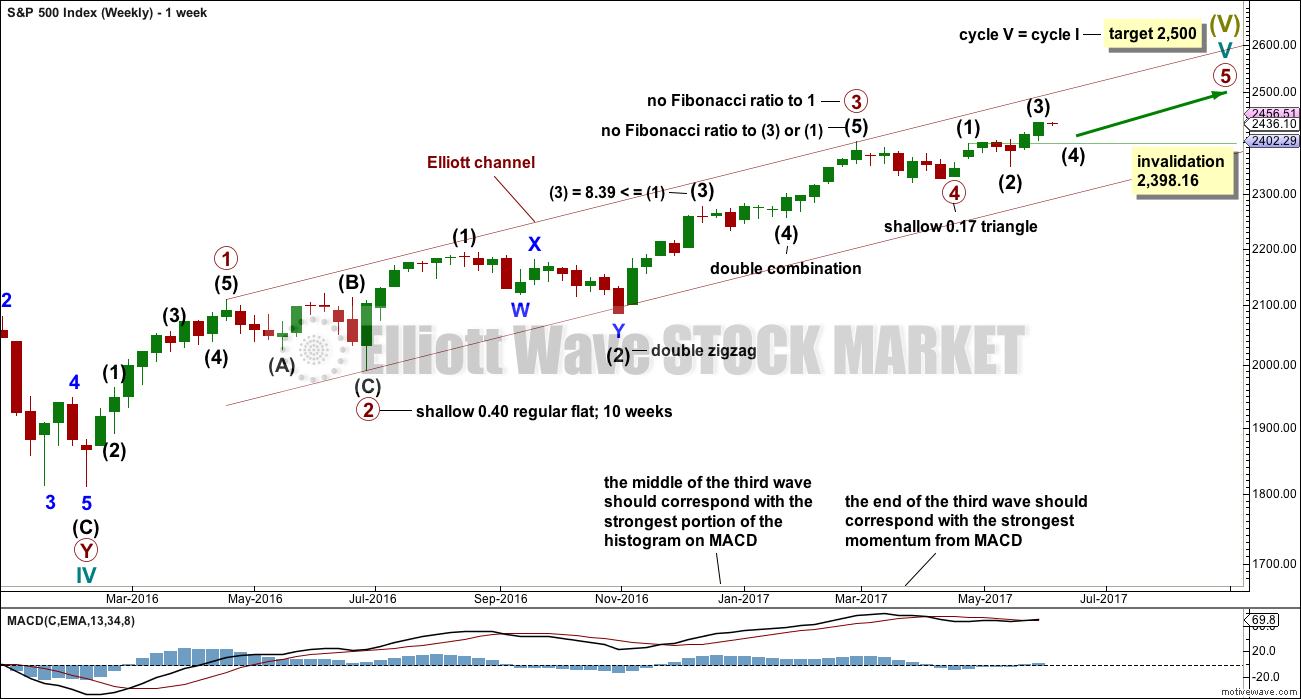
WEEKLY CHART
This wave count has a better fit with MACD and so may have a higher probability.
Primary wave 3 may be complete, falling short of 1.618 the length of primary wave 1 and not exhibiting a Fibonacci ratio to primary wave 1. There is a good Fibonacci ratio within primary wave 3.
The target for cycle wave V will remain the same, which has a reasonable probability. At 2,518 primary wave 5 would reach 0.618 the length of primary wave 1. If the target at 2,500 is exceeded, it may not be by much.
There is alternation between the regular flat correction of primary wave 2 and the triangle of primary wave 4.
Within primary wave 3, there is alternation between the double zigzag of intermediate wave (2) and the double combination of intermediate wave (4).
If primary wave 4 is over and primary wave 5 is underway, then within primary wave 5 intermediate wave (2), if it moves lower, may not move beyond the start of intermediate wave (1) below 2,344.51 (this point is taken from the triangle end on the daily chart).
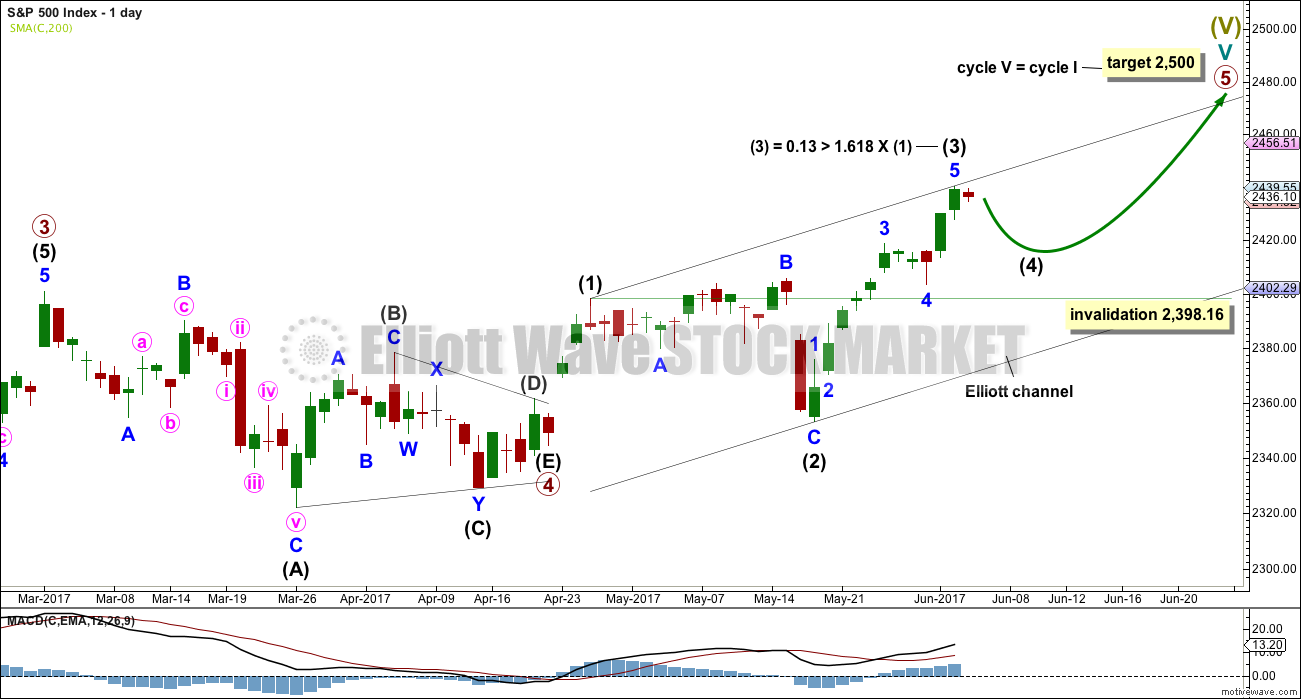
DAILY CHART
Primary wave 5 must complete as a five wave motive structure, either an impulse (more common) or an ending diagonal (less common). So far, if this wave count is correct, it looks like an impulse.
Intermediate wave (3) is now a complete structure on the hourly chart and has reached a common Fibonacci ratio to intermediate wave (1). It may be complete here.
Intermediate wave (4) may not move into intermediate wave (1) price territory below 2,398.16.
Intermediate wave (4) may end within the price territory of the fourth wave of one lesser degree. Minor wave 4 has its range from 2,418.71 to 2,403.62.
Copy the Elliott channel over to the hourly chart.
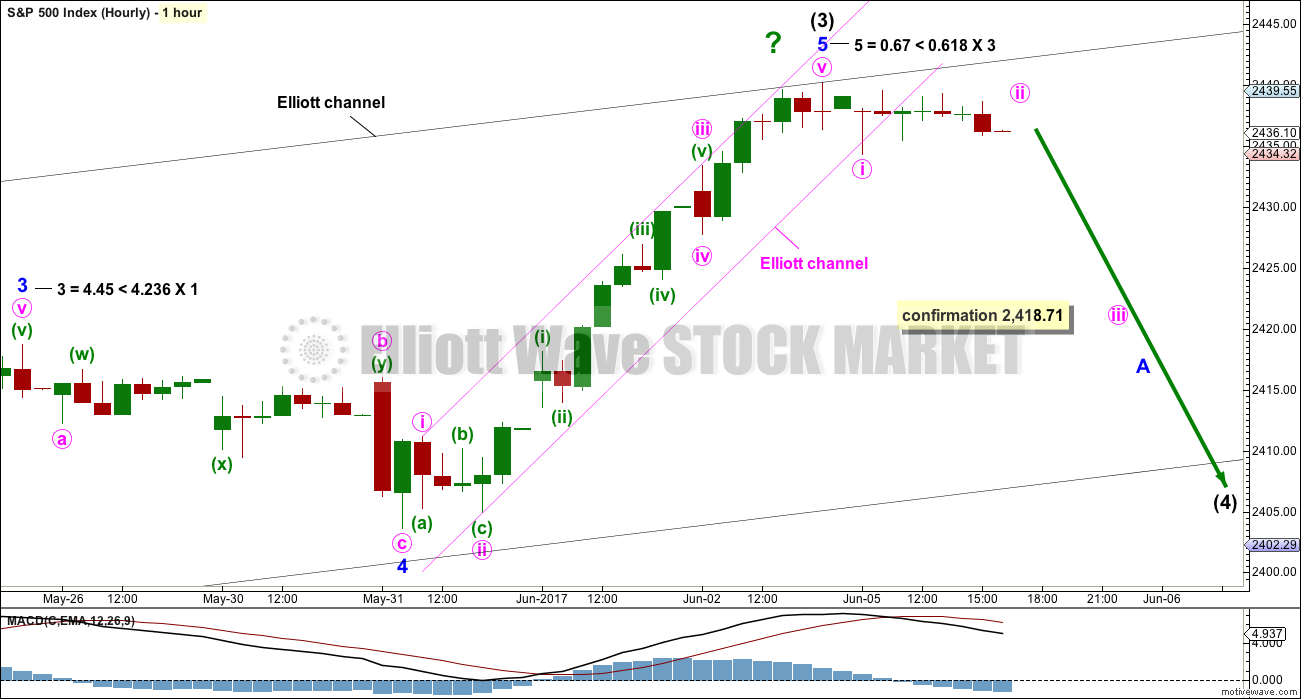
HOURLY CHART
Within intermediate wave (3), there are Fibonacci ratios between all three actionary waves of minor waves 1, 3 and 5. Intermediate wave (3) also exhibits a Fibonacci ratio to intermediate wave (1).
Add a small channel about minor wave 5. This channel is breached today, but only by sideways movement and not clear downwards movement. At this stage, this sideways movement looks very much like a small consolidation within an ongoing upwards trend. For this reason an alternate is provided below.
Intermediate wave (1) lasted three days. Intermediate wave (2) lasted 16 days. Intermediate wave (3), if it is over, would have lasted 10 days. Intermediate wave (4) may last about eight or 13 days.
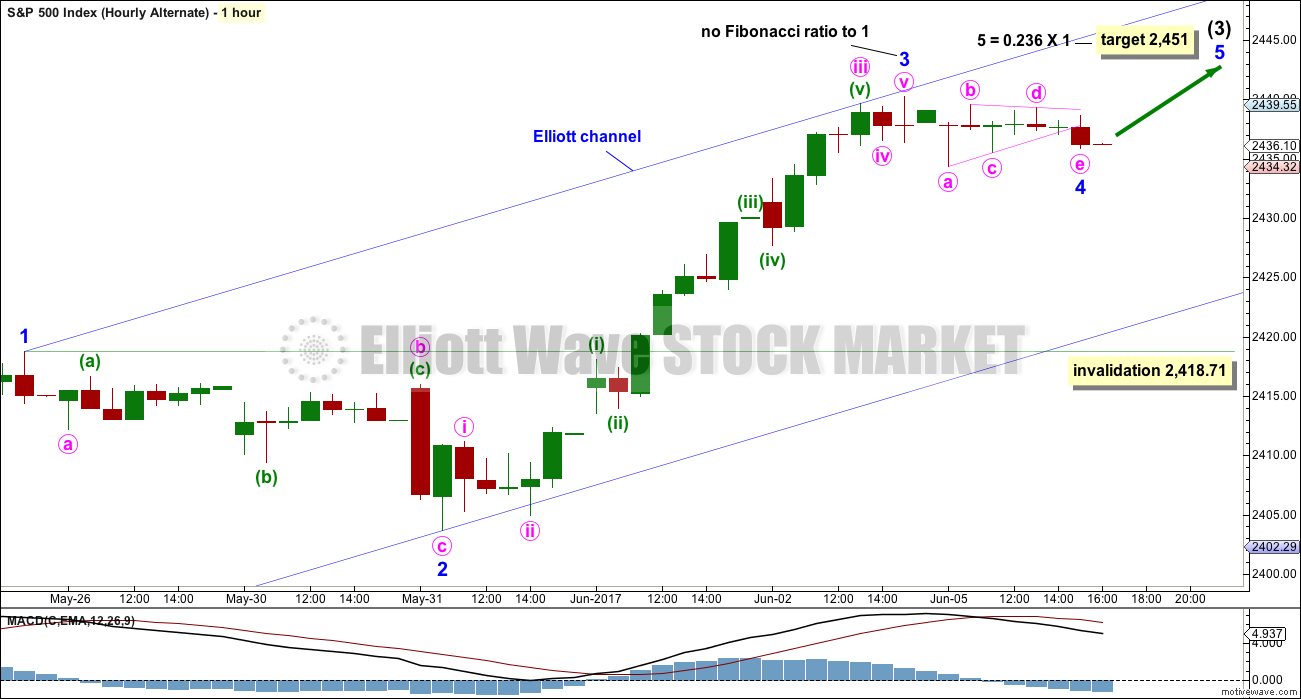
ALTERNATE HOURLY CHART
At the hourly chart level, this is how intermediate wave (3) would have the best look.
It is possible that intermediate wave (3) is not over and may not exhibit a Fibonacci ratio to intermediate wave (1).
Within intermediate wave (3), there would be no Fibonacci ratio between minor waves 3 and 1. This makes it more likely that minor wave 5 should exhibit a Fibonacci ratio to minor wave 1. Minor wave 3 is shorter than minor wave 1, so minor wave 5 has a limit of no longer than equality with minor wave 3 at 2,172.44 because minor wave 3 cannot be the shortest wave.
This alternate sees good alternation between the zigzag of minor wave 2 and a possible small triangle of minor wave 4.
Minor wave 4 may not move into minor wave 1 price territory below 2,418.71. Invalidation of this alternate would add substantial confidence to the main wave count.
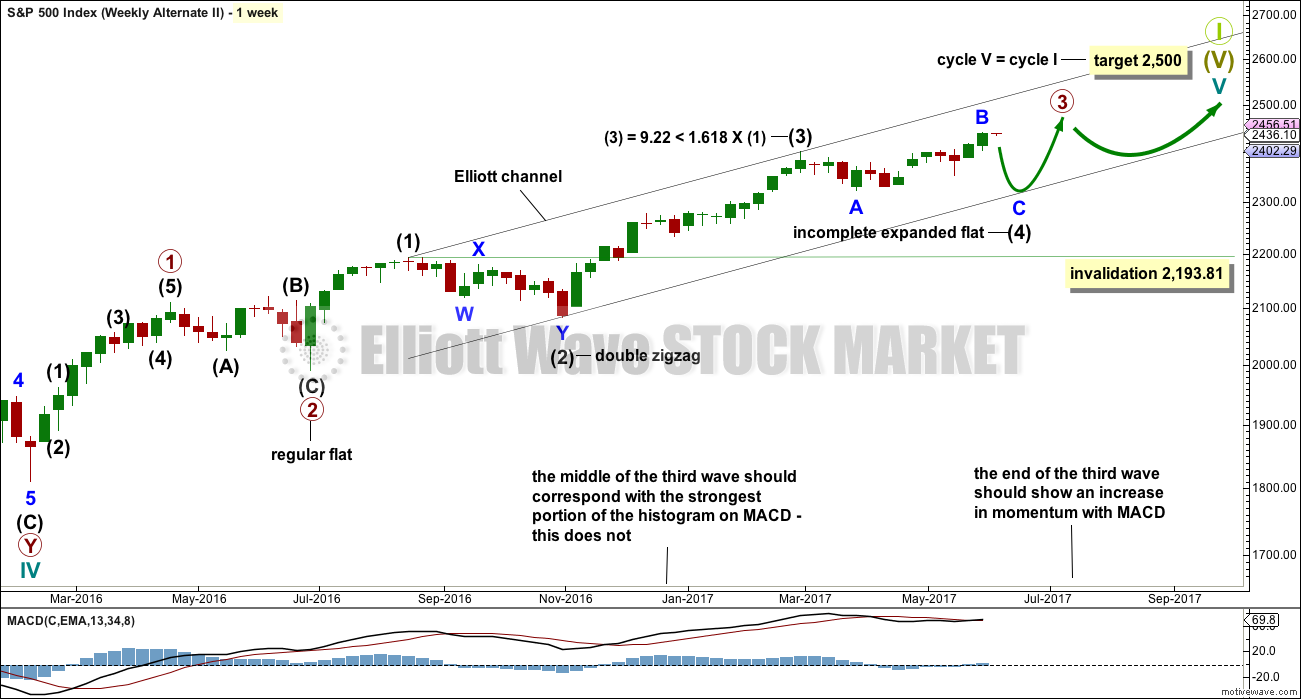
ALTERNATE WEEKLY CHART
This weekly chart has been published with a slight variation before.
It is still possible that intermediate wave (4) is incomplete and may be continuing as a very common expanded flat correction.
This weekly wave count expects a slow end to Grand Super Cycle wave I at the target at 2,500. Once intermediate wave (4) is over, then intermediate wave (5) would be expected to move above the end of intermediate wave (3) at 2,400.98 to avoid a truncation; it need not make a new all time high (but would be likely to do so).
Thereafter, another multi week sideways correction for primary wave 4 may unfold that must remain above primary wave 1 price territory, which has its extreme at 2,111.05.
Finally, a last upwards wave for primary wave 5 towards the target at 2,500 should show substantial weakness.
This wave count allows for the target at 2,500 to be reached possibly in October.
When looking at upwards movement so far on the monthly chart, the corrections of intermediate waves (2) and (4) show up. This is how the labelling fits best at that time frame.
It is also still possible that the expanded flat correction could be labelled primary wave 4 as per the alternate published here.
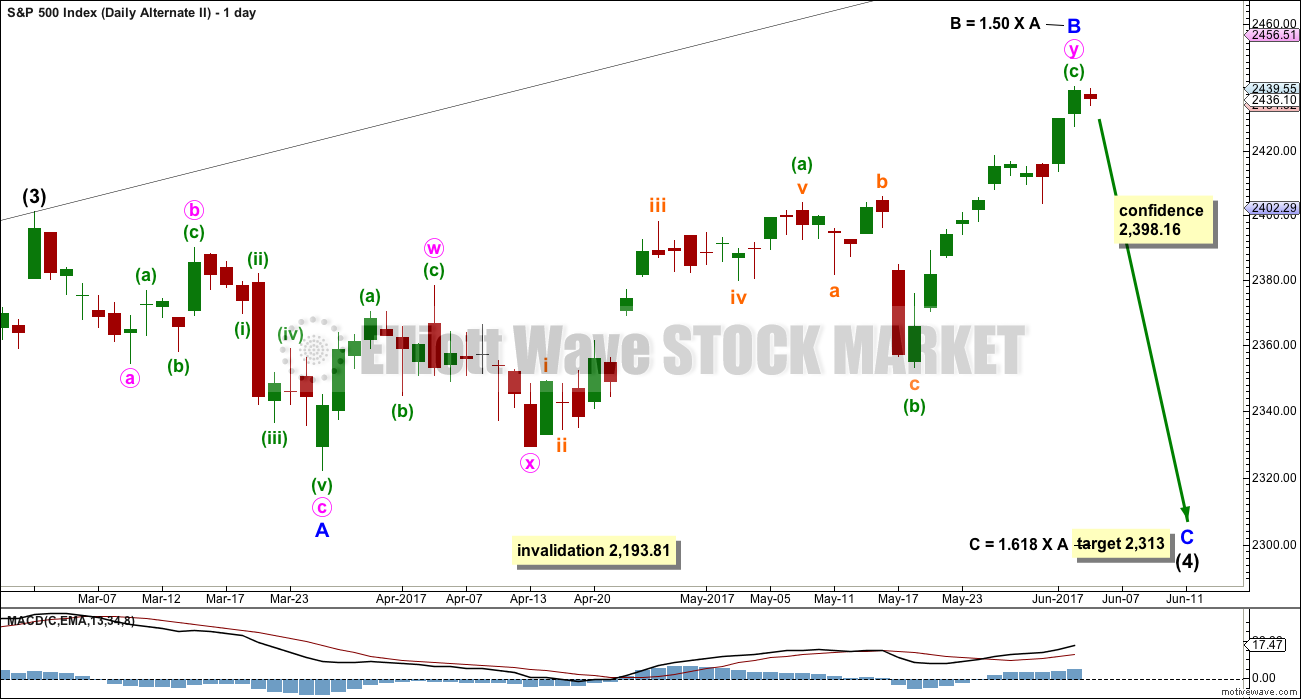
ALTERNATE DAILY CHART
Expanded flat corrections are very common structures. They subdivide 3-3-5. Within this one, minor wave B would now be just beyond the common range of 1 to 1.38 the length of minor wave A.
The target for minor wave C is recalculated.
The target calculated expects price to find strong support at the lower edge of the black Elliott channel, which is copied over from the weekly chart.
TECHNICAL ANALYSIS
WEEKLY CHART
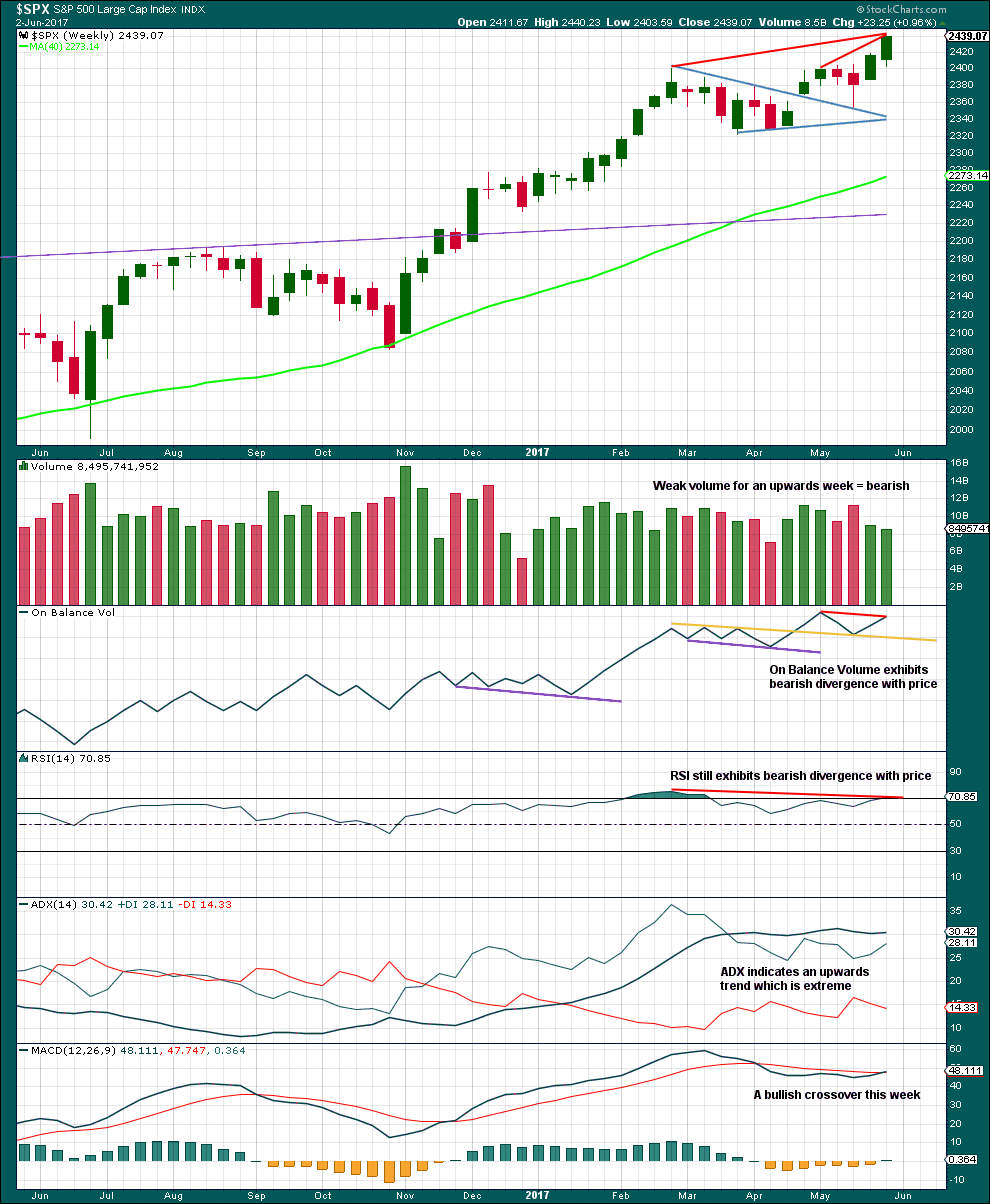
Click chart to enlarge. Chart courtesy of StockCharts.com.
On Balance Volume gives the most recent signal as a weak bearish divergence with price.
Volume is bearish. RSI divergence is bearish. ADX at extreme is bearish.
MACD is now bullish.
Although this chart is bearish, we have been here before. The reality is price keeps rising although indicators are bearish. This bearishness should tell traders to protect long positions with stops, and be aware the market is currently vulnerable to a pullback. It does not tell traders to enter short here; that would be premature.
DAILY CHART
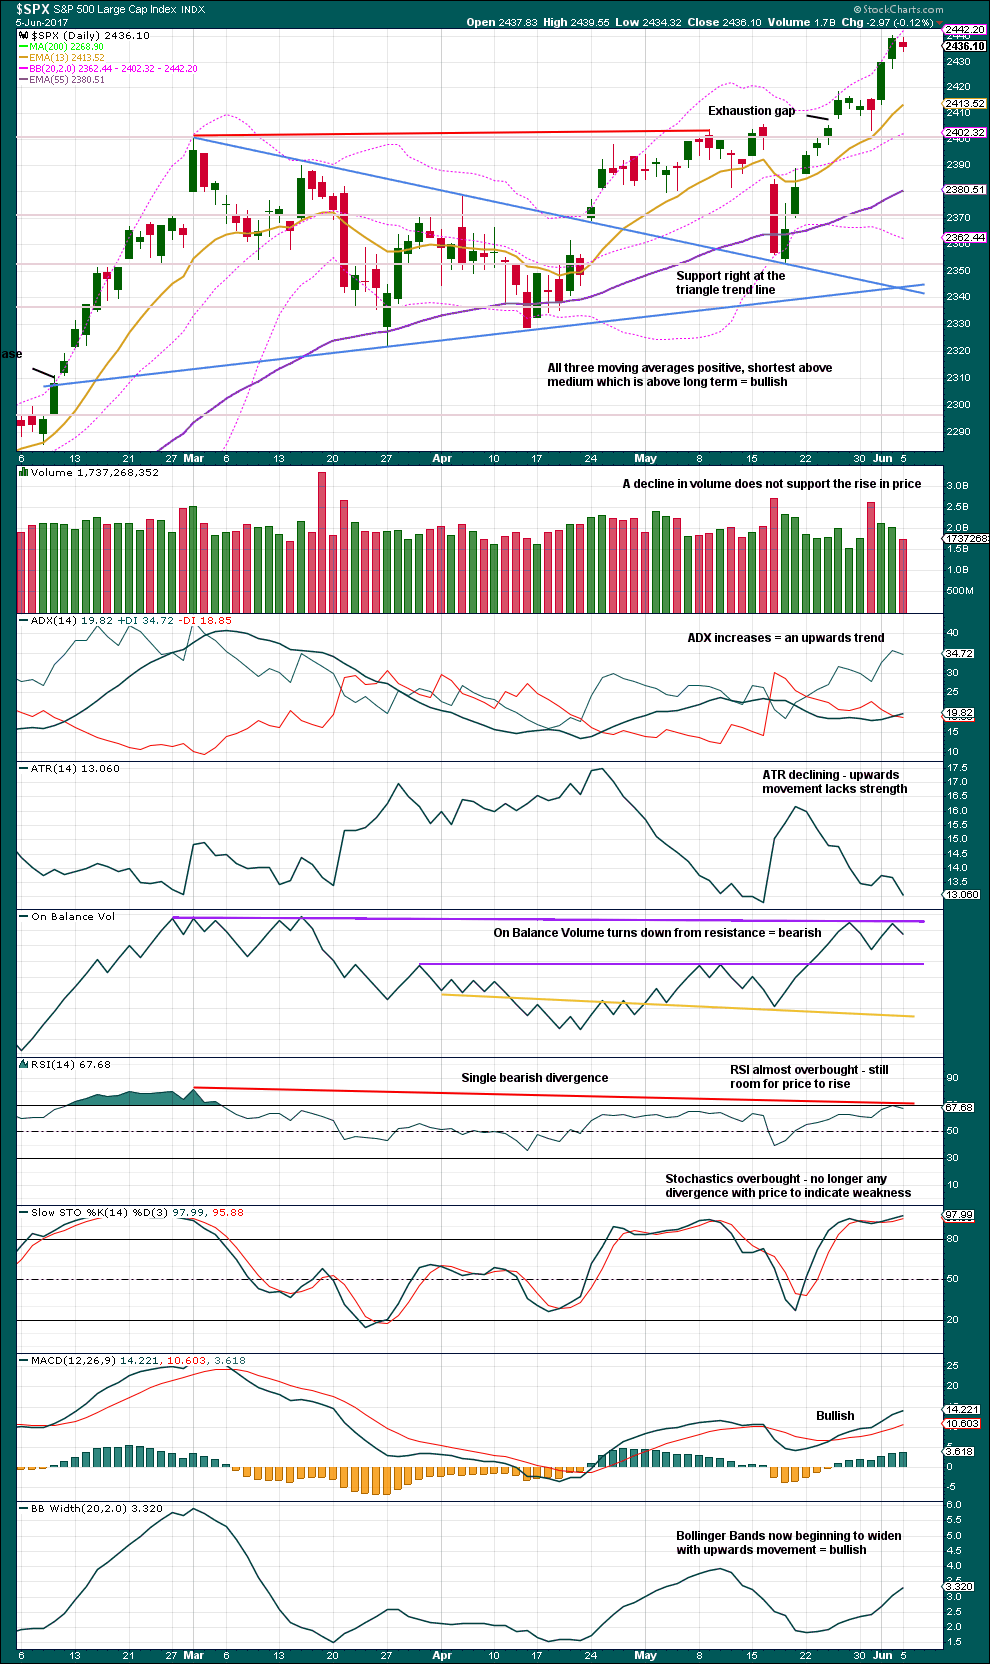
Click chart to enlarge. Chart courtesy of StockCharts.com.
If the widest part of the symmetrical triangle is taken from the high of the 1st of March to the low of the 27th of March, then a measured rule target would be at 2,448. If price continues a little higher this week, then use this target for long positions.
The balance of volume for Monday was down and the candlestick closed red. Downwards movement during the session did not have support from volume. This looks like a small pause within an upwards trend and not like the start of a deeper pullback. This supports the alternate hourly wave count.
ADX is bullish. MACD is bullish. Bollinger Bands are bullish.
ATR indicates weakness within this trend. RSI divergence indicates weakness.
Stochastics no longer indicates weakness and may remain extreme for long periods of time during a trending market.
VOLATILITY – INVERTED VIX CHART
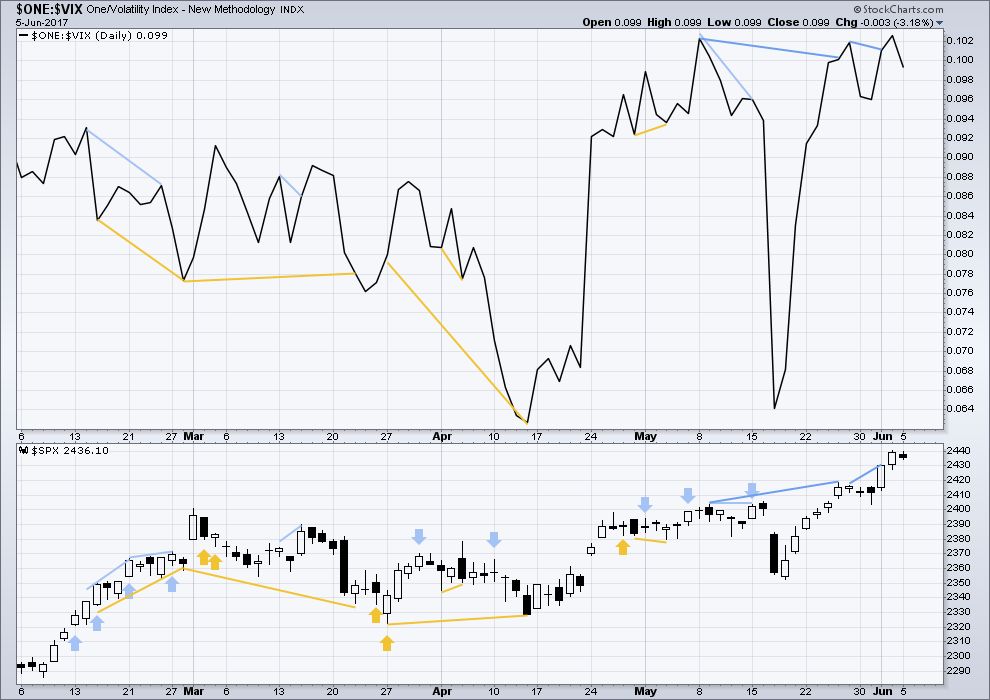
Click chart to enlarge. Chart courtesy of StockCharts.com.
Normally, volatility should decline as price moves higher and increase as price moves lower. This means that normally inverted VIX should move in the same direction as price.
There is no divergence today between price and VIX to indicate weakness.
BREADTH – AD LINE
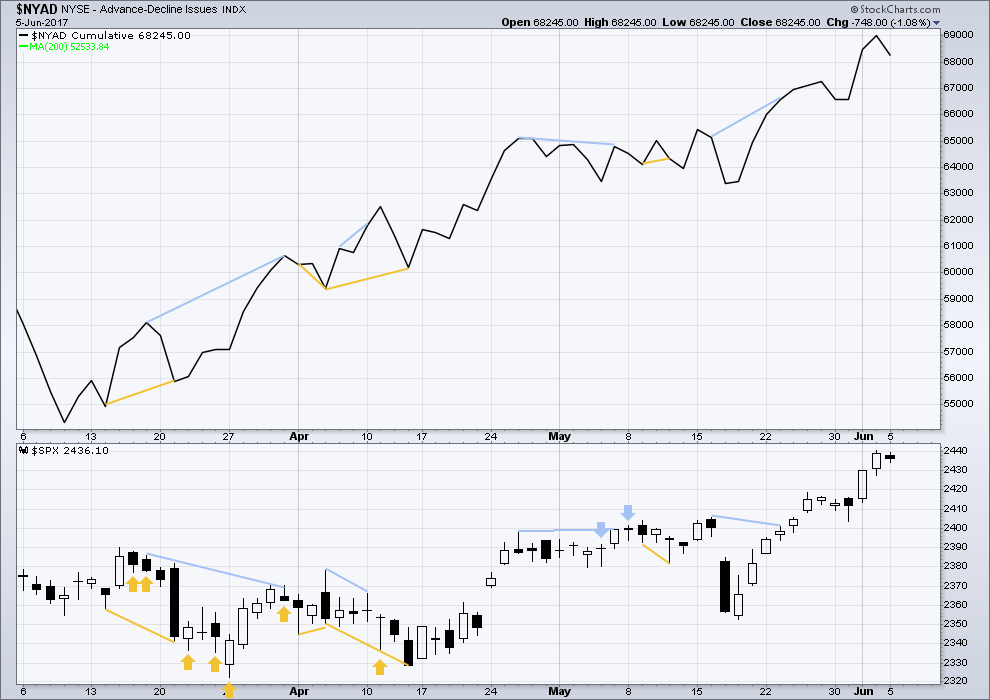
Click chart to enlarge. Chart courtesy of StockCharts.com.
With the last all time high for price, the AD line also made a new all time high. Up to the last high for price there was support from rising market breadth.
There is normally 4-6 months divergence between price and market breadth prior to a full fledged bear market. With no divergence yet at this point, any decline in price should be expected to be a pullback within an ongoing bull market and not necessarily the start of a bear market.
There is no divergence for the short term at this time to indicate weakness.
At the end of last week, it is noted that the mid caps and small caps have failed to make new all time highs. There is some internal weakness with increasing selectivity in this market.
DOW THEORY
At the end of last week, Nasdaq, DJIA and the S&P500 have all made new all time highs. DJT has failed to confirm an ongoing bull market because it has not yet made a new all time high. However, at this stage that only indicates some potential weakness within the ongoing bull market and absolutely does not mean that DJT may not yet make new all time highs, and it does not mean a bear market is imminent.
The following lows need to be exceeded for Dow Theory to confirm the end of the bull market and a change to a bear market:
DJIA: 17,883.56.
DJT: 7,029.41.
S&P500: 2,083.79.
Nasdaq: 5,034.41.
Charts showing each prior major swing low used for Dow Theory are here.
This analysis is published @ 11:42 p.m. EST.

I do think this is probably the correct hourly count. I’ll be swapping them over today. As Verne notes, there just isn’t the selling pressure for a bigger pullback here.
They can start slow, but more often not.
2,418.71 is the price point that differentiates the two ideas.
Yep! I think we have one more sprint to the upside, and that will correspond with a nice pullback in Gold (I know the guys on the Gold site don’t wanna hear that kind of talk!) The Yen is printing a doji today and so a reversal there would definitely portend a resumption of the uptrend in equities.
Retailers hemorrhaging blood today. Anybody take a gander at Macy’s, DKS DECK, JWN? Yikes!
The auto related stocks are also printing money for short side trades : ORLY CAR, AN, AZO to cite a few.
We know from the Hindenburg Omen that many stocks within the various indices are showing great weakness. The key to successful trading these days is to find those weak sectors. I know a few folk are probably frustrated by the indices themselves but there is opportunity if you know where to look! Cheers! 🙂
I always like to go back and read the fine print of jobs report and see what this report’s guestimate for the so-called CES birth/death “adjustment” was. I have to say I was quite shocked by this month’s number- 230,000.00!!
This means the reported gains of 138,000.00 woeful as it was, was actually far worse. The economy in reality lost 92.000.00 jobs. Sounds like recessionary numbers to me……
We have a clear breach of the Elliott channel but still no real selling pressure. The market’s decline seems to be due to top heaviness and I imagine is being resisted by some degree of bankster pumping. Decline so far does not look that impulsive so it could be the beginning of either another shallow correction, or a slow torturous drift to the downside target. VIX showing some signs of life so let’s see how quickly it gets to the upper BB or whether they expand to signal a bigger move ahead.
Last week I mentioned I would be looking for an exit strategy for my long positions in all three accounts; short, medium and long term. I will be in 100% cash by the 4th of July. I am looking for an exit around SPX 2470 or so (alternate hourly count).
After the 4th, I will be begin the 1st of 4 planned vacations ending in mid-September. Since two of those vacations will see me going on solo remote mountain expeditions where there is no service of any kind except satellite, I will not be able to watch the markets, trade or otherwise be involved. I am thinking we will see the end of this long march higher in the markets by September or thereabouts. I am looking for a slow rounded top followed by a waterfall down by year’s end. Volatility will return. I will be trading that event as it shows itself.
I am quite satisfied with the gains to my accounts in 2017. All accounts are up handsomely. In fact, I have almost made up the big losses I experienced in 2016 (short term account only) due to my hubris, foolishness, and greedy gunslinger mentality while we were all looking for the demise of the equity markets. It did not materialize and I paid the penalty. But today, with hard work, patience, good fortune and Lara’s expert analysis, I have made a strong come back. It is not the first time. But I hope it is the last time I need to stage such a come back. I am getting to old for that.
So that is my plan for the next three or four months. I will be traveling on foot in the most remote part of the continental US. I will be over 100 miles from the nearest town with any services. I will be looking for the remarkable Grizzly Bear. I hope to find him/her and invite him/her to Wall Street. Perhaps the bear market we have been looking for since 2012 will finally arrive and usher in great pain and damage commensurate with such a decline.
Finally, I have announced retirement plans in a little over two years. Between now and then, I need to determine how much if any trading I want to be doing. I enjoy watching and trading the market. I have made some good money at it. But I also want to be free from the necessity of managing these accounts.
Have a great day everyone.
Sounds like a great plan Rod!
A lot of folk who I think know what they are talking about are now casting wary eyes toward the September/October time frame.
If we do not get a real correction soon I am leaning toward an earlier top.
A fabulous plan indeed Rodney. May you replenish your soul in the mountains 🙂
The shark’s breathing process requires him to keep moving at all times. If he does not move, he cannot breathe. I think I am starting to figure out why the banksters are so terrified of even the mildest correction. Just think about it folk. Look how far this market has come on virtually non-existent volume. The algos are running wild. The banksters (especially BOJ) have been in a non-stop buying frenzy, and the companies have issued tens of billions in bonds to buy back their over-valued shares, further inflating P.E. ratios to historic and ridiculous levels, considering the rate of economic growth we have seen in recent years.
At some point his market is going to start to fall. Oh, I know! Some of you think it is going to go on in perpetuity, but that scenario is not going to be permitted by the laws of nature, insane calls for DJI 51,000.00 notwithstanding.
Here is the million dollar question folk – when the panic does arrive, and arrive it will, who the hell is going to take the buy side of every Tom, Dick and Harry, all trying their utmost, and at the same time, to get the hell out of Dodge??!!
Remember, at the market’s highest levels in history… NO VOLUME PEOPLE!!
‘Nuff said! 🙂
Hit the nail on the head Verne. It’s very interesting that people continually fall for psychological traps, and repeat the same pattern over and over again. I would argue the risk now is much much greater, and less easier to quantify due to over-confidence in the central banks. The public has been lulled to sleep, talented money managers destroyed, all bears back to hibernation, and an utterly shameful level of debt, manipulation, plutocracy, and destruction of capitalism exists on top of all that misplaced confidence. The banksters will either succumb to fear and sell themselves, or be forced to raise rates rapidly and reduce money supply due to roaring inflation, or perhaps worse have a sinister plot to crash the global economies to get close to one world currency and government. Either way the party stops soon…….
I think a lot of folk are going to look back at this period and consider it the biggest WTF! (were we thinking!) era of our lifetimes!
In keeping with a 500 year cycle top.
While I agree with what you are saying Verne, then next thing that will hold the market up will be the Buy the DIP group… it will be effective because there is ZERO Fear in this market of any major sustained decline. They will have the 2007 to 2017 period to point to for evidence.
This Group will Buy the DIP at 5.00% down… 7.50% down 10% Down… 15% Down… 20% Down… all with ZERO Fear!
It will take a relatively fast 40% to 60% down to Break the buy the DIP mentality…
After that you have to deal with the Buy and Hold Crew!: To Break the Buy and Hold Crew mentality it will take a continued erosion in price over a long period of time after being down 60% relatively fast like an additional 20% beyond the 60%. + to really end a Bear Market at multiple Cycle Degrees it will take PE ratios and the CAPE to swing to the other extreme end of the pendulum and the debt haircuts must finally actually play out worldwide.
Then you know for sure that cleansing has completed and a Brand New multi-decade long Bull Market Cycle is free to begin.
But… that being said… markets will continue to higher and higher and higher and higher. Reason??? Unknown to me… but will happen anyway!
It sure does seem that way Joseph, but if you take a peek under the hood, you can detect some very clear signs of the coming engine failure. We have had a confirmed (two omens within a 36 day period) Hindenburg Omen last month. In fact we had a double double in that not only was the omen repeated, but the signal triggered on two indices on the same day. As you know, one key aspect of the omen is the number of stocks making both 52 week highs and lows at the same time. Lots of stocks making new 52 week highs OR 52 week lows can be a very normal sign of an ongoing healthy bull market, or an ending bear market. When both are happening at the same time it usually spells trouble. We have also seen how so much of recent gains in some indices have come via a relatively few components of the index, for example the Nasdaq, with most of the other components trading substantially below moving averages. This leads to a bi-furcated market and probably explains why HO are often predictive of a market collapse.
All it takes for that to happen is for the people bidding up the supporting stocks to head for the exits. I continue to argue that for any number of reasons, this stampede for the exits in these particular stocks could happen suddenly and so those who are confident the market will give plenty of advance warning of what is about to happen could be in for a nasty surprise. An index held up by few components can and probably will fall fast and hard when those particular stocks reverse. I could be wrong, but I expect that when the collapse comes it will do so faster than many expect.
Here is a good article on the HO that was recently written by Robert McHugh. His research resulted in the addition of two additional triggers that makes for five instead of the original three, and which give the omen but better predictive value. He has given permission to share with friends and family.
https://www.technicalindicatorindex.com/subscribers/guest-articles/Hindenburg%20Article%20June%205th%2C%202017%20McHugh%20backup.pdf
Thanks for the link Verne… Good read.
Has anyone looked at how these signals work in conjunction with EW.
Off the top of my head… it may have worked together in the summer of 2015… as one instance.
For sure, I just hope to still be in business and provide for my family once it occurs……
Why? Because the market only goes higher and higher and higher with zero fear of even a 5% correction! The elusive EW Top and major crash continues to be pushed out into the future. It’s delayed since 2012… that’s 5 years+ and counting.
No point in wasting any brain cells on that!
Surprised there are no comments! Futures pointing down a bit a few hours prior to open!