
An outside day moved price lower to start the session.
Summary: The target is at 2,440 (Elliott wave target) to 2,448 (classic analysis target). Expect upwards movement to continue. Corrections are an opportunity to add to long positions.
In the short term, a new low now below 2,398.16 would indicate a deeper pullback may be underway.
New updates to this analysis are in bold.
Last monthly and weekly charts are here. Last historic analysis video is here.
MAIN ELLIOTT WAVE COUNT
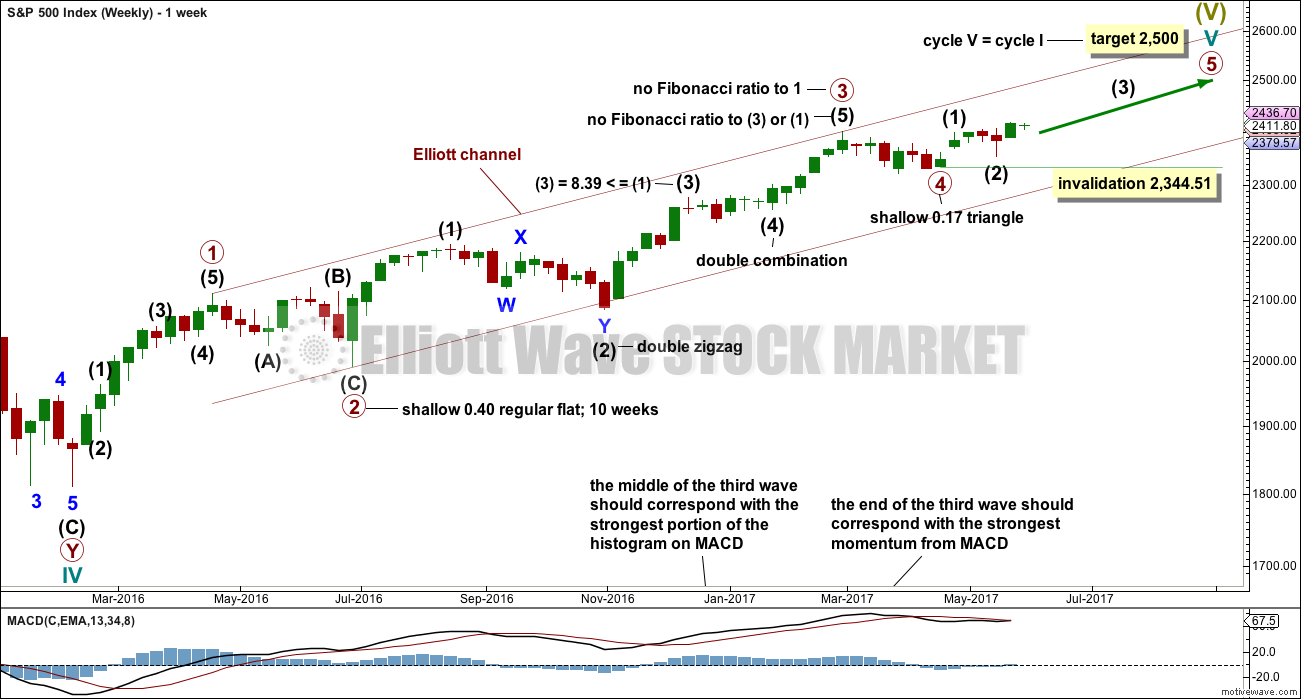
WEEKLY CHART
Click chart to enlarge.
This wave count has a better fit with MACD and so may have a higher probability.
Primary wave 3 may be complete, falling short of 1.618 the length of primary wave 1 and not exhibiting a Fibonacci ratio to primary wave 1. There is a good Fibonacci ratio within primary wave 3.
The target for cycle wave V will remain the same, which has a reasonable probability. At 2,518 primary wave 5 would reach 0.618 the length of primary wave 1. If the target at 2,500 is exceeded, it may not be by much.
There is alternation between the regular flat correction of primary wave 2 and the triangle of primary wave 4.
Within primary wave 3, there is alternation between the double zigzag of intermediate wave (2) and the double combination of intermediate wave (4).
If primary wave 4 is over and primary wave 5 is underway, then within primary wave 5 intermediate wave (2), if it moves lower, may not move beyond the start of intermediate wave (1) below 2,344.51 (this point is taken from the triangle end on the daily chart).
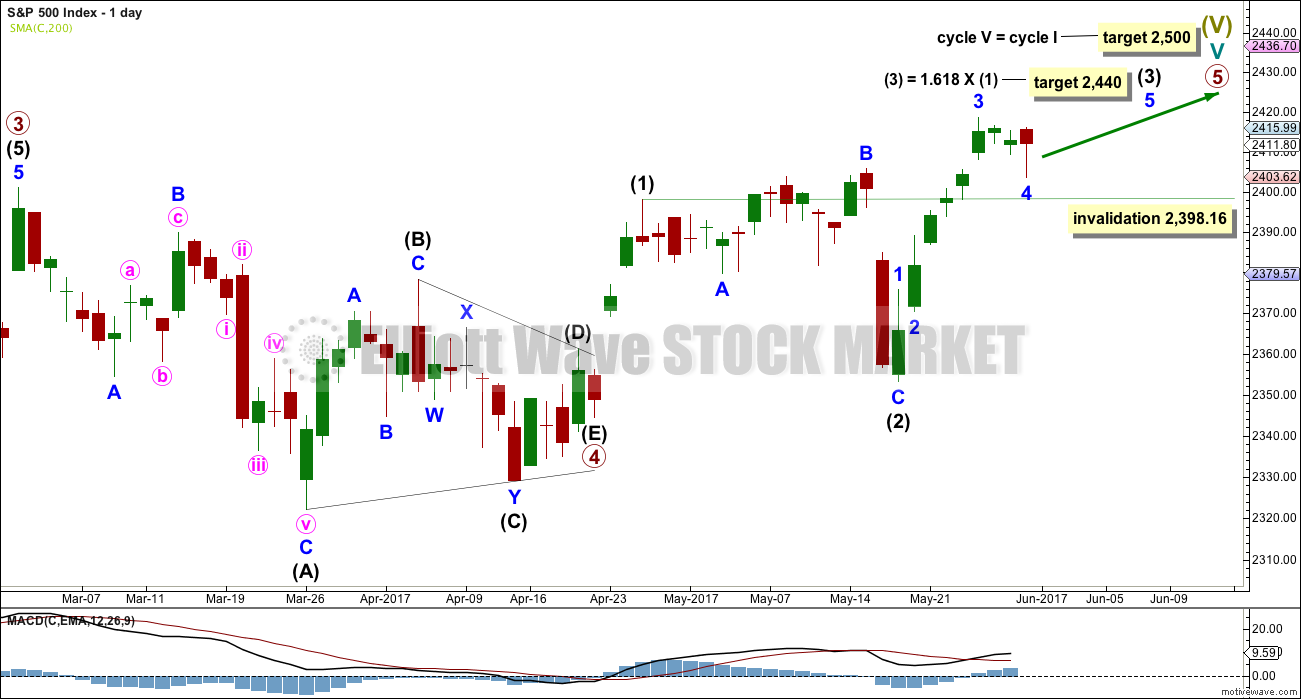
DAILY CHART
Click chart to enlarge.
Primary wave 5 must complete as a five wave motive structure, either an impulse (more common) or an ending diagonal (less common). So far, if this wave count is correct, it looks like an impulse.
Intermediate wave (3) is now far enough developed to move the invalidation point up. If intermediate wave (4) begins shortly, it may not move into intermediate wave (1) price territory below 2,398.16.
Intermediate wave (3) may only subdivide as an impulse structure.
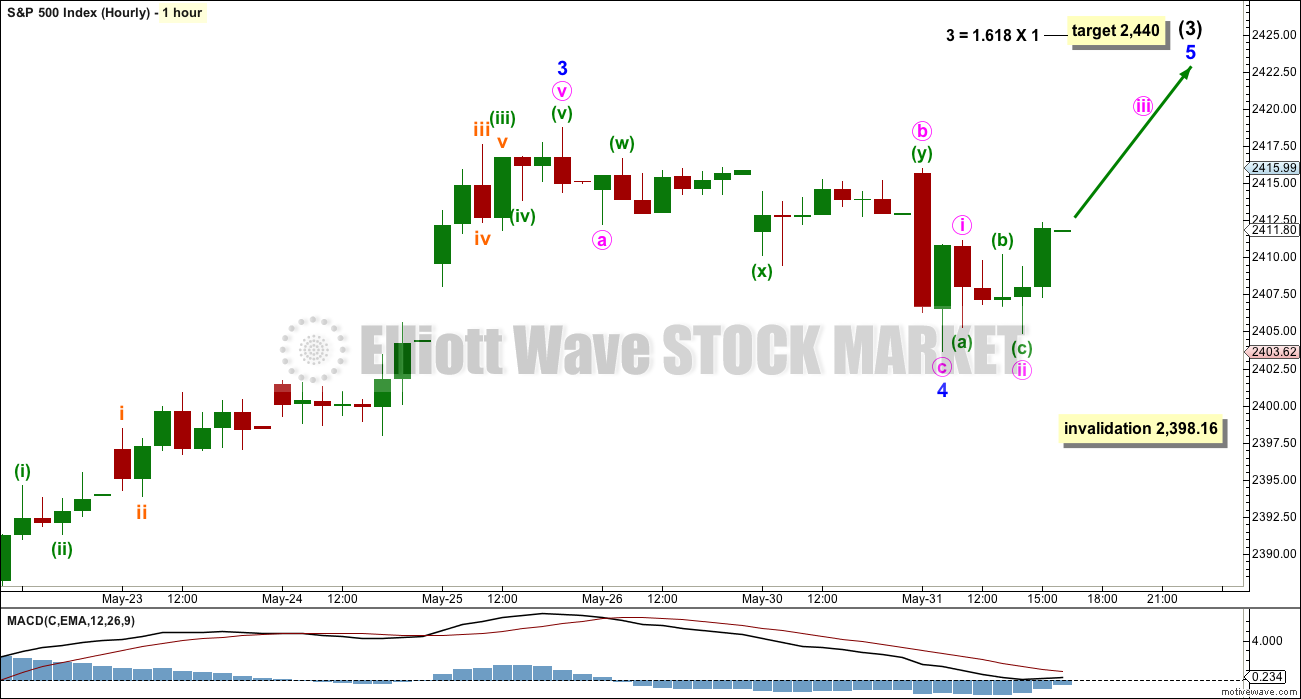
HOURLY CHART
Click chart to enlarge.
Intermediate wave (3) may only subdivide as an impulse. For the S&P 500, it is most common for third wave impulses to exhibit extended third waves within them. Here, minor wave 3 is just 4.44 points short of 4.236 the length of minor wave 1.
Minor wave 4 may have continued further today and completed as a zigzag, with a complicated combination for minute wave b within it.
Any movement below 2,398.16 would see this main wave count discarded in favour of the alternate below.
The best fit channel did not work because price breached it. The structure of intermediate wave (3) still looks incomplete, it has not yet moved far enough above the end of intermediate wave (1) to allow for room for intermediate wave (4) to unfold and remain above first wave price territory.
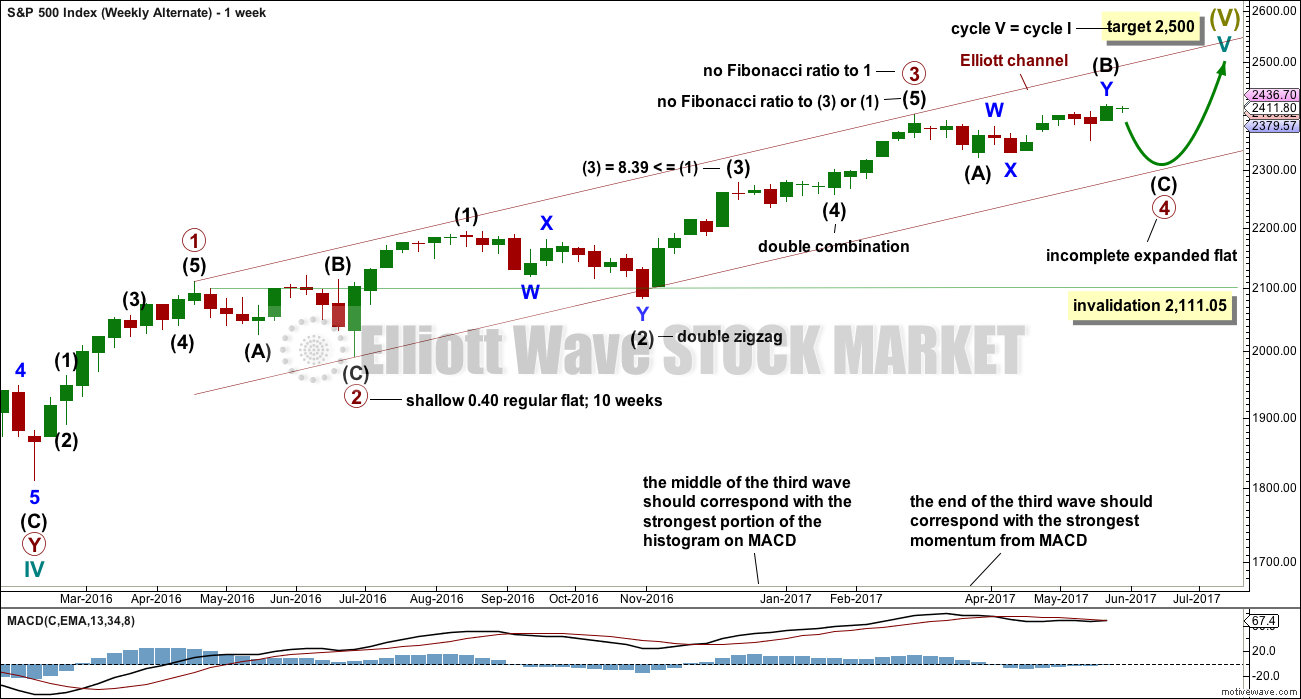
ALTERNATE WEEKLY CHART
Click chart to enlarge.
This alternate is new in response to a member’s suggestion. At this stage, there are several alternate wave counts possible. It is time to consider one more.
This wave count is identical up to the end of primary wave 3, Thereafter, it looks at the possibility that primary wave 4 may be an incomplete expanded flat correction.
If the expanded flat is primary wave 4, then there is very little alternation with the regular flat of primary wave 2.
Primary wave 4 may not move into primary wave 1 price territory below 2,111.05.
ALTERNATE DAILY CHART
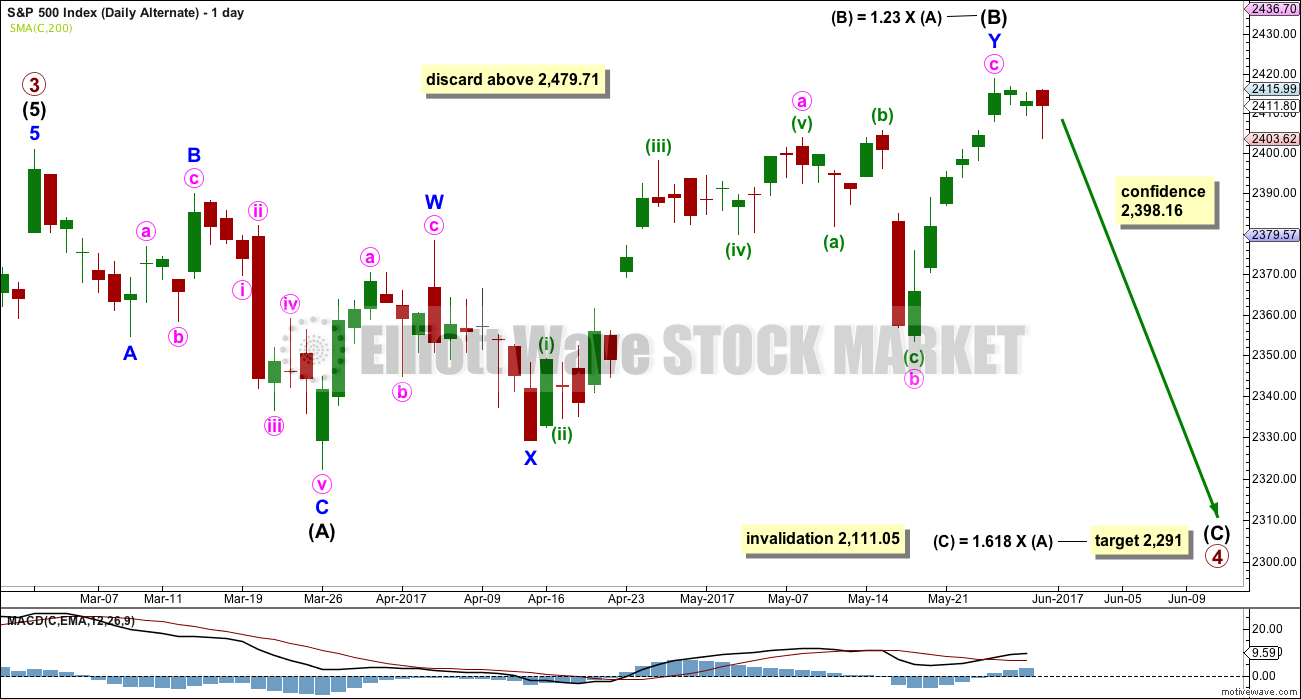
Click chart to enlarge.
Within the possible expanded flat correction, intermediate wave (A) fits as a single zigzag and intermediate wave (B) fits as a double zigzag and is within the normal range for B waves of flats.
If price keeps rising, then when intermediate wave (B) reaches twice the length of intermediate wave (A) at 2,479.71, then the idea of a flat correction continuing should be discarded based upon a very low probability. Unfortunately, this price point is far enough away to be of little use. This alternate may be discarded sooner if structure shows it is unlikely.
It is also possible that the expanded flat correction is intermediate wave (4) within primary wave 3. This alternate idea will be published if it shows itself to be true. For now, because it does not diverge from the alternate published above, this second idea will not be published on a daily basis.
At the hourly chart level, downwards movement from the high labelled here as intermediate wave (B) will fit neatly as a leading expanding diagonal.
TECHNICAL ANALYSIS
WEEKLY CHART
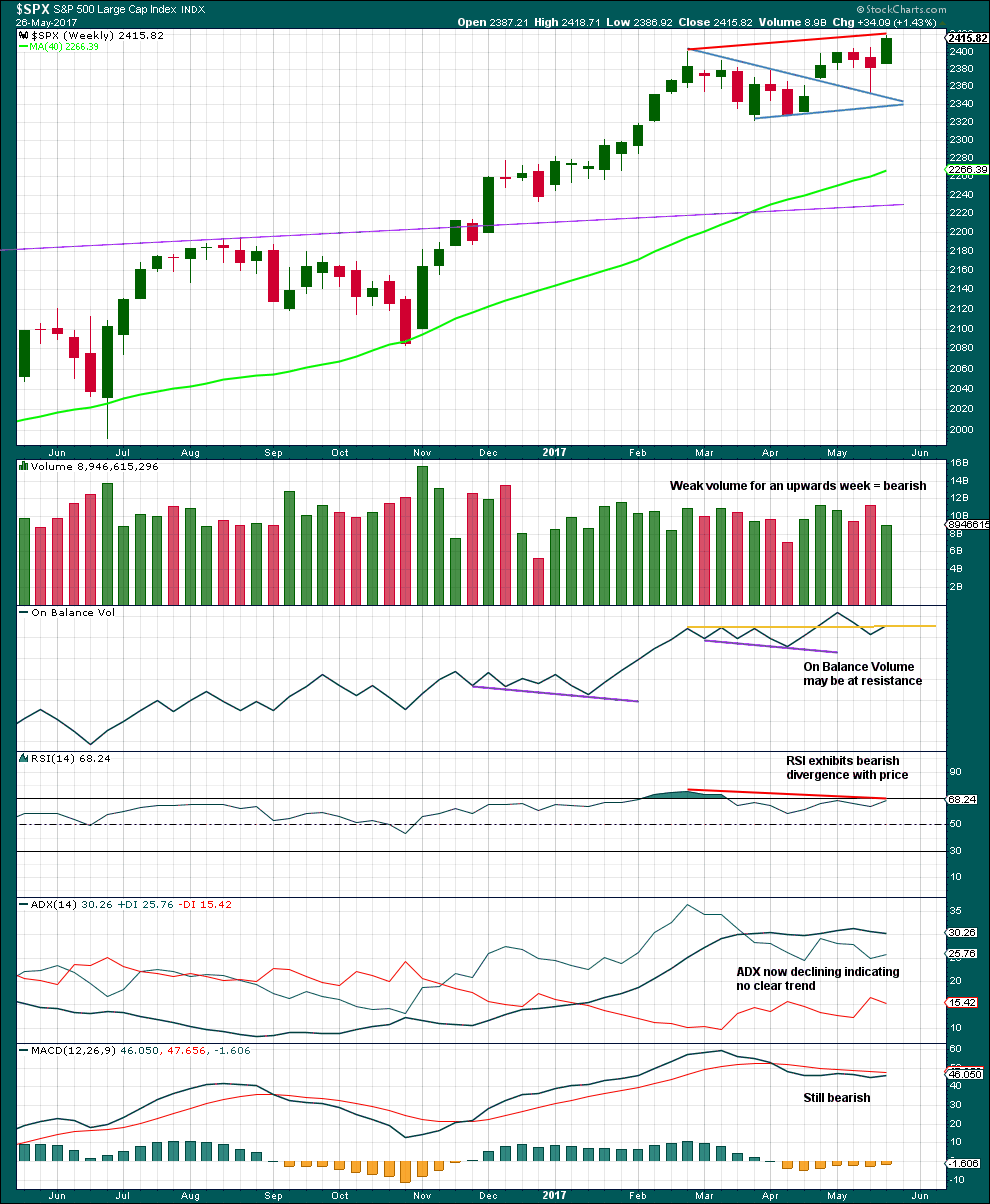
Click chart to enlarge. Chart courtesy of StockCharts.com.
This weekly chart supports the alternate wave counts over the main wave count.
DAILY CHART
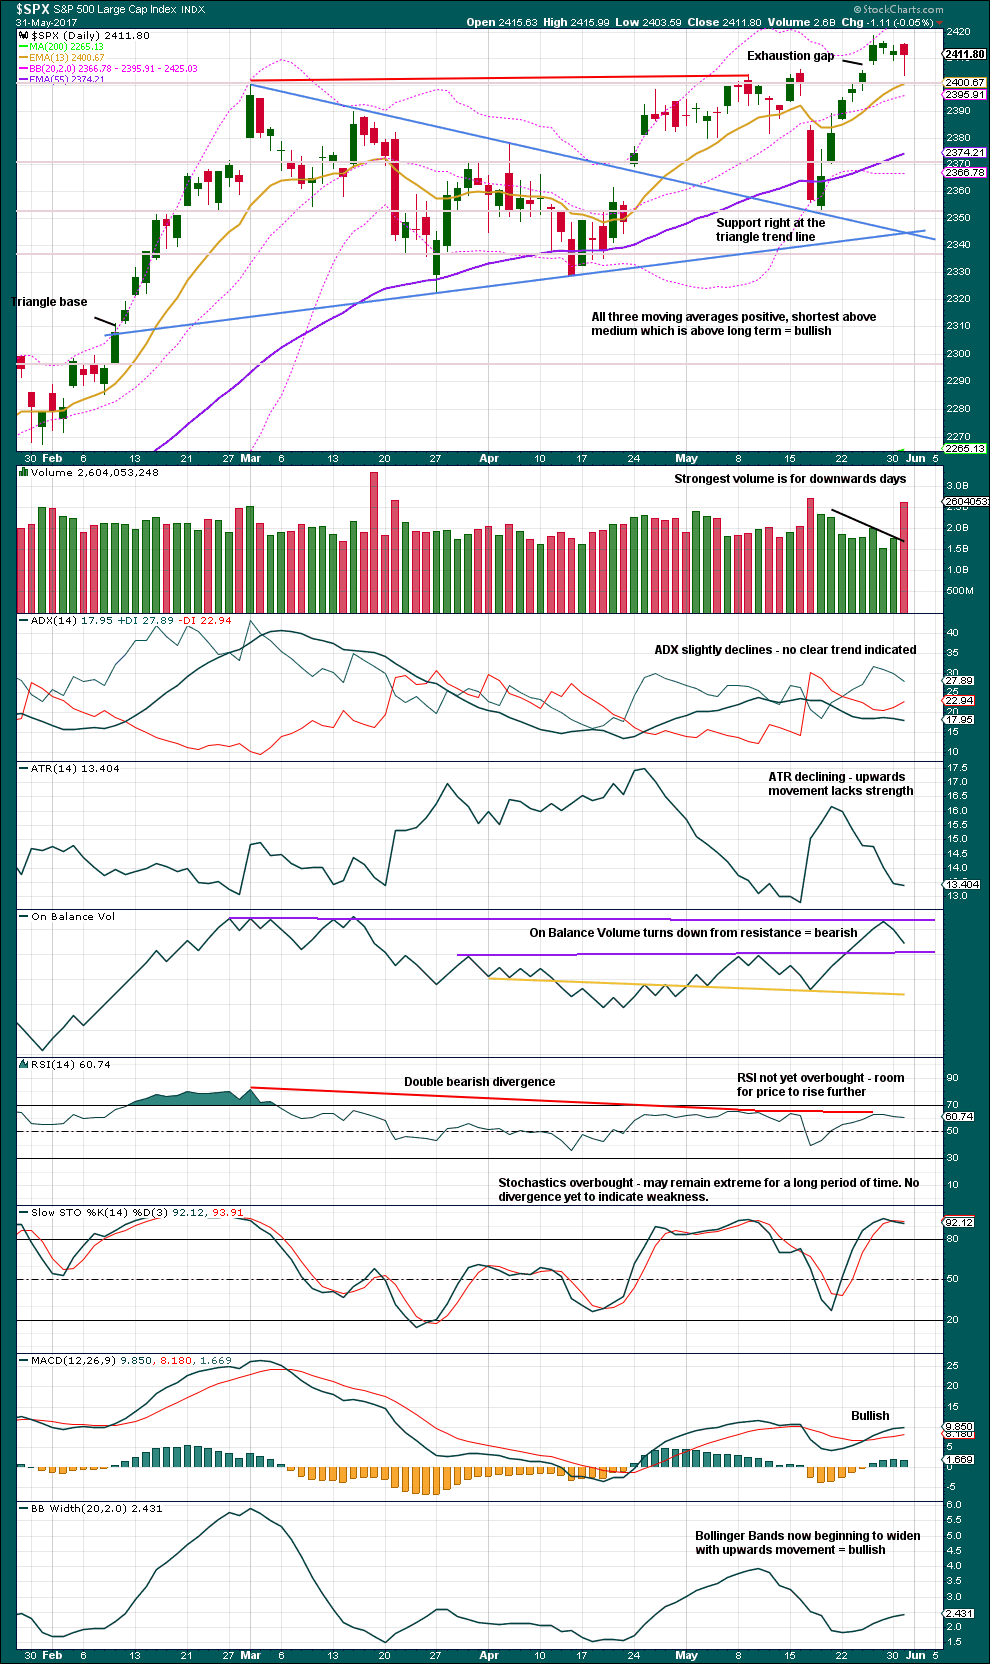
Click chart to enlarge. Chart courtesy of StockCharts.com.
If the widest part of the symmetrical triangle is taken from the high of the 1st of March to the low of the 27th of March, then a measured rule target would be at 2,448. This is just 8 points above the Elliott wave target.
Price today reached down very close to support about 2,400, which was previously strong resistance. This closed the last gap, so now it is correctly named an exhaustion gap. Expect price to continue to find support about 2,400.
On Balance Volume is very close to support also. This may serve to halt the fall in price here.
Volume declined for the last upwards movement and is strongest for recent downwards days. The volume profile is bearish.
MACD and Bollinger Bands are bullish.
The breakout from the triangle followed by a curve down and test of support at the prior resistance line looks like very typical price behaviour. It is moving up and away. The target is not yet reached. It seems most sensible to assume it will be, until the alternate Elliott wave count is confirmed by price.
VOLATILITY – INVERTED VIX CHART
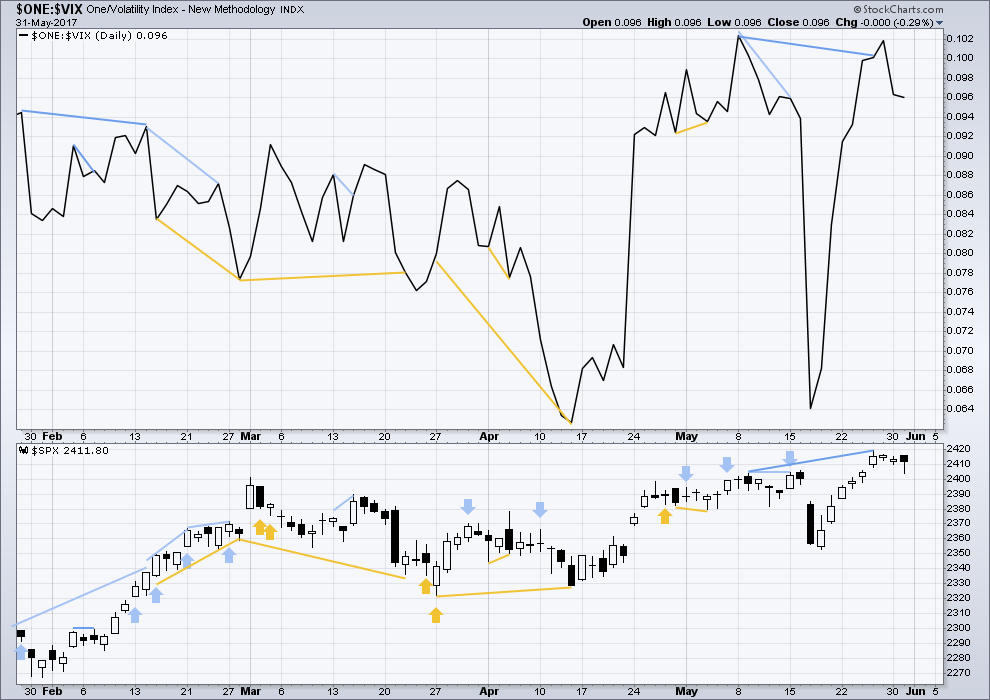
Click chart to enlarge. Chart courtesy of StockCharts.com.
Normally, volatility should decline as price moves higher and increase as price moves lower. This means that normally inverted VIX should move in the same direction as price.
Hidden mid term bearish divergence has now been followed by two days which have made new lows, so it may now be resolved.
BREADTH – AD LINE
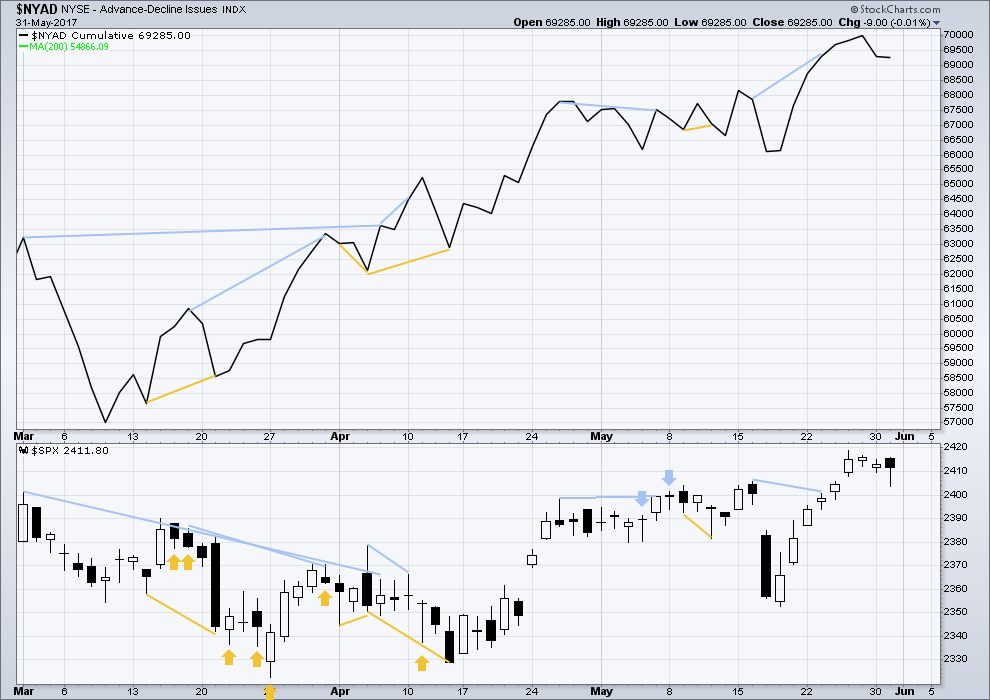
Click chart to enlarge. Chart courtesy of StockCharts.com.
With the last all time high for price, the AD line also made a new all time high. Up to the last high for price there was support from rising market breadth.
There is normally 4-6 months divergence between price and market breadth prior to a full fledged bear market. With no divergence yet at this point, any decline in price should be expected to be a pullback within an ongoing bull market and not necessarily the start of a bear market.
There is no divergence between price and breadth today; both moved essentially sideways.
DOW THEORY
The DJIA, DJT, S&P500 and Nasdaq continue to make new all time highs. This confirms a bull market continues.
The following lows need to be exceeded for Dow Theory to confirm the end of the bull market and a change to a bear market:
DJIA: 17,883.56.
DJT: 7,029.41.
S&P500: 2,083.79.
Nasdaq: 5,034.41.
Charts showing each prior major swing low used for Dow Theory are here.
This analysis is published @ 10:32 p.m. EST.
A very nice day for the S&P. Up and on to the target.
Nice spotting the fourth wave yesterday Lara, I realize the B wave could still be alive but this exceeded my measurements for its height. Again, manipulation at open on all indexes, and now that we are within a few points of either a large 4th wave or a terminal high, I’m layering into the NASDAQ, awaiting impulsive decline to go full position.
I was scratching my head in confusion for a wee while on the five minute chart for that one.
Holding onto the assumption that the trend remains the same, until proven otherwise, works so far.
Indeed it does. One of the more sagacious reminders you have been providing us for quite some time. Target just ahead! I am wondering about the degree. We don’t have a lot of time for a significant correction ahead of a move to a final high come Fall.
Just musing here on durations:
If 2,500 is reached in October that gives 17 more weeks.
Primary 1 lasted 10 weeks. Primary 2 also 10 weeks. Primary 3 a Fibonacci 34 weeks (main count). Primary 4, 7 weeks.
So far primary 5 = 6 weeks, and intermediate (3) isn’t quite done.
If intermediate (3) lasts into next week, then intermediate (4) could last 8 weeks and intermediate (5) also 8 weeks.
That does look like a bit of a stretch.
So, what if the second alternate is correct?
Currently price in intermediate (4) of primary 3.
Intermediate (1) lasted 6 weeks, intermediate (2) lasted 11 weeks, intermediate (3) 17 weeks, intermediate (4) as an expanded flat so far 13 weeks and incomplete.
If intermediate (4) moves lower for about 3 weeks that leaves 14 weeks for primary 3 to end (it may have a short quick fifth wave), then primary 4 to unfold sideways, then primary 5.
That actually fits better with the target for October.
I am actually starting to also wonder about the possibility of an earlier top. We really are not very far away from SPX 2500. Corrections have been remarkable brief and shallow, and it is entirely possible we could see a completion of an intermediate fourth, and a final wave up completing by the critical upcoming major Bradley turn date of June 20. I think we are starting to see wave compression as we approach this historic top.
I would wager absolutely no one is entertaining that as a possibility.
For those of you who follow it, here is one of the best articles I have read on the Hindenburg Omen. We had a double trigger on May 4 (NYSE and Nasdaq Comp) and another on Wednesday. I personally do not think a top is in, but I think we are getting close, and what comes next is likely to be more than just a correction. The key thing to remember is that although the HO does not necessarily signal an impending large decline in the markets, we have never had a substantial market decline that was not preceded by a HO. This is very much in keeping with the current wave count. The one caveat for me personally is that if we do not get a more meaningful correction before we go on to new ATH, this market could end up topping earlier than expected imho.
https://seekingalpha.com/article/4070634-hindenburg-omen-just-scary-name
Eeeh!….you know…!
A nudder darn wabbit!