
A small inside day saw price move sideways for Friday, remaining within the channel on the hourly chart.
Summary: The target is at 2,440 (Elliott wave target) to 2,448 (classic analysis target). Expect upwards movement to continue. Corrections are an opportunity to add to long positions.
In the short term, a new low now below 2,398.16 would indicate a deeper pullback may be underway.
New updates to this analysis are in bold.
Last monthly and weekly charts are here. Last historic analysis video is here.
MAIN ELLIOTT WAVE COUNT
WEEKLY CHART
Click chart to enlarge.
At the end of this week the wave counts are swapped over.
This wave count has a better fit with MACD and so may have a higher probability. Up until very recently, this was the main wave count.
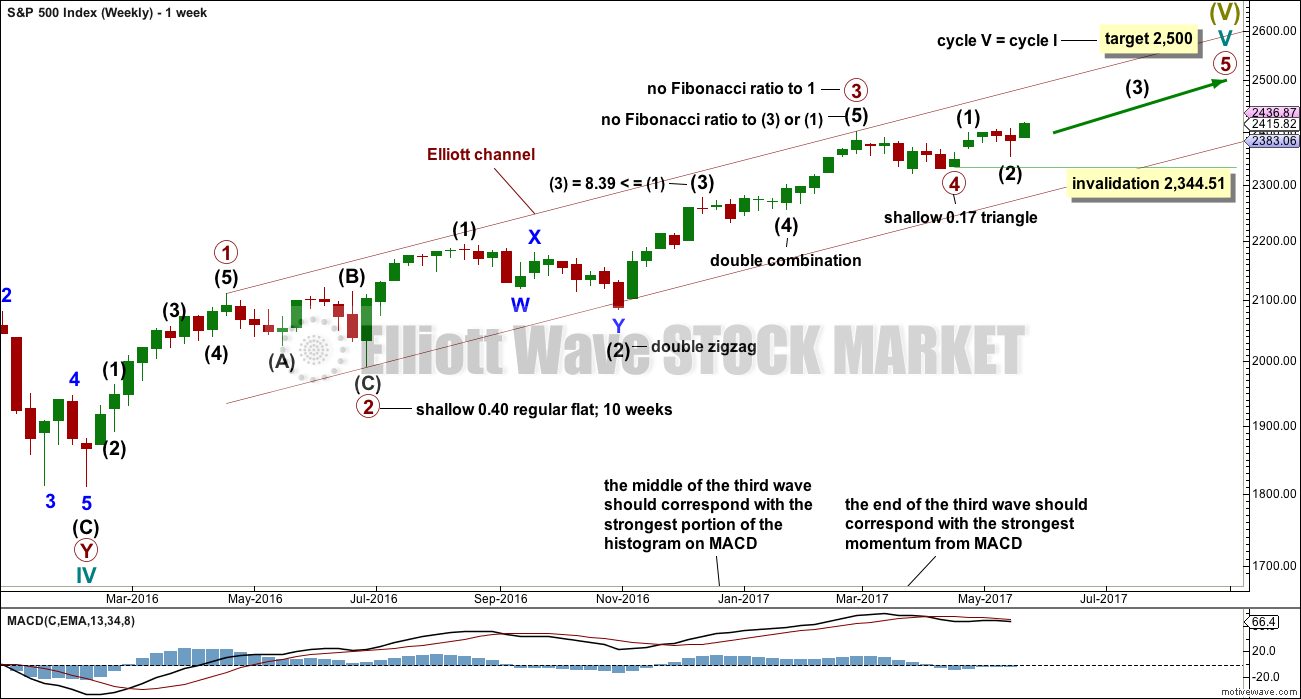
Primary wave 3 may be complete, falling short of 1.618 the length of primary wave 1 and not exhibiting a Fibonacci ratio to primary wave 1. There is a good Fibonacci ratio within primary wave 3.
The target for cycle wave V will remain the same, which has a reasonable probability. At 2,518 primary wave 5 would reach 0.618 the length of primary wave 1. If the target at 2,500 is exceeded, it may not be by much.
There is alternation between the regular flat correction of primary wave 2 and the triangle of primary wave 4.
Within primary wave 3, there is alternation between the double zigzag of intermediate wave (2) and the double combination of intermediate wave (4).
If primary wave 4 is over and primary wave 5 is underway, then within primary wave 5 intermediate wave (2), if it moves lower, may not move beyond the start of intermediate wave (1) below 2,344.51 (this point is taken from the triangle end on the daily chart).
DAILY CHART
Click chart to enlarge.
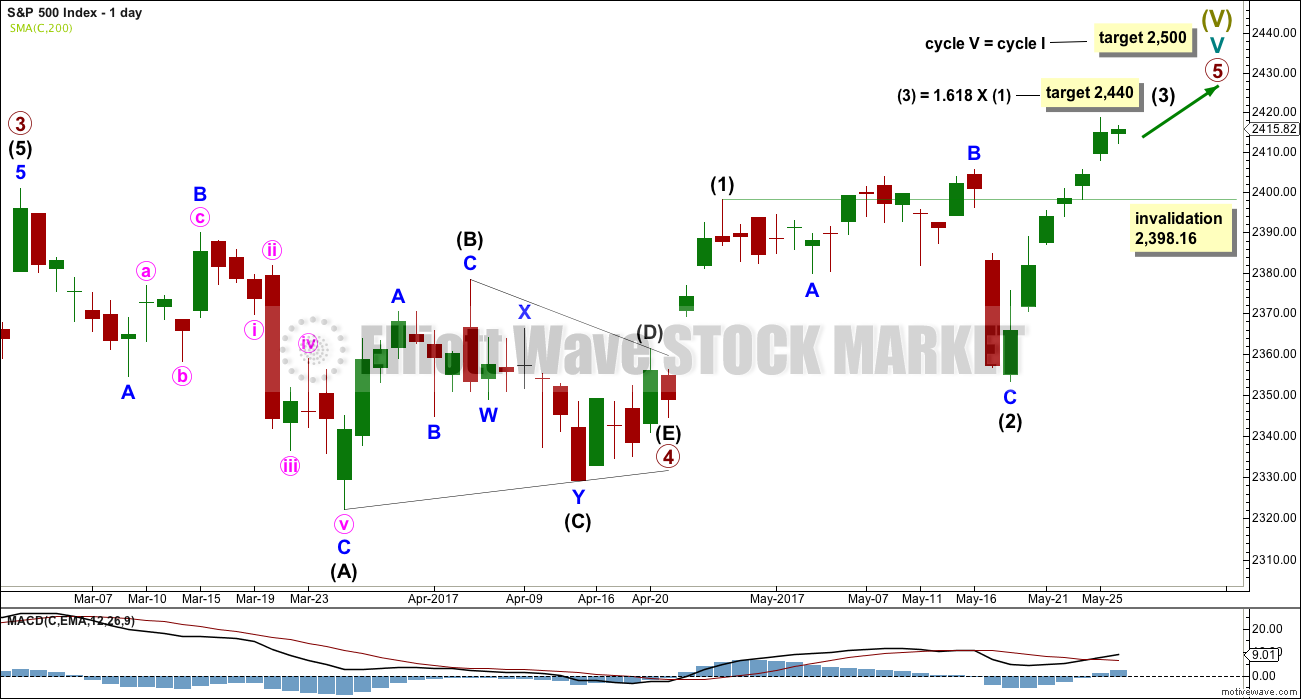
Primary wave 5 must complete as a five wave motive structure, either an impulse (more common) or an ending diagonal (less common). So far, if this wave count is correct, it looks like an impulse.
Intermediate wave (3) is now far enough developed to move the invalidation point up. If intermediate wave (4) begins shortly, it may not move into intermediate wave (1) price territory below 2,398.16.
Intermediate wave (3) may only subdivide as an impulse structure.
HOURLY CHART
Click chart to enlarge.
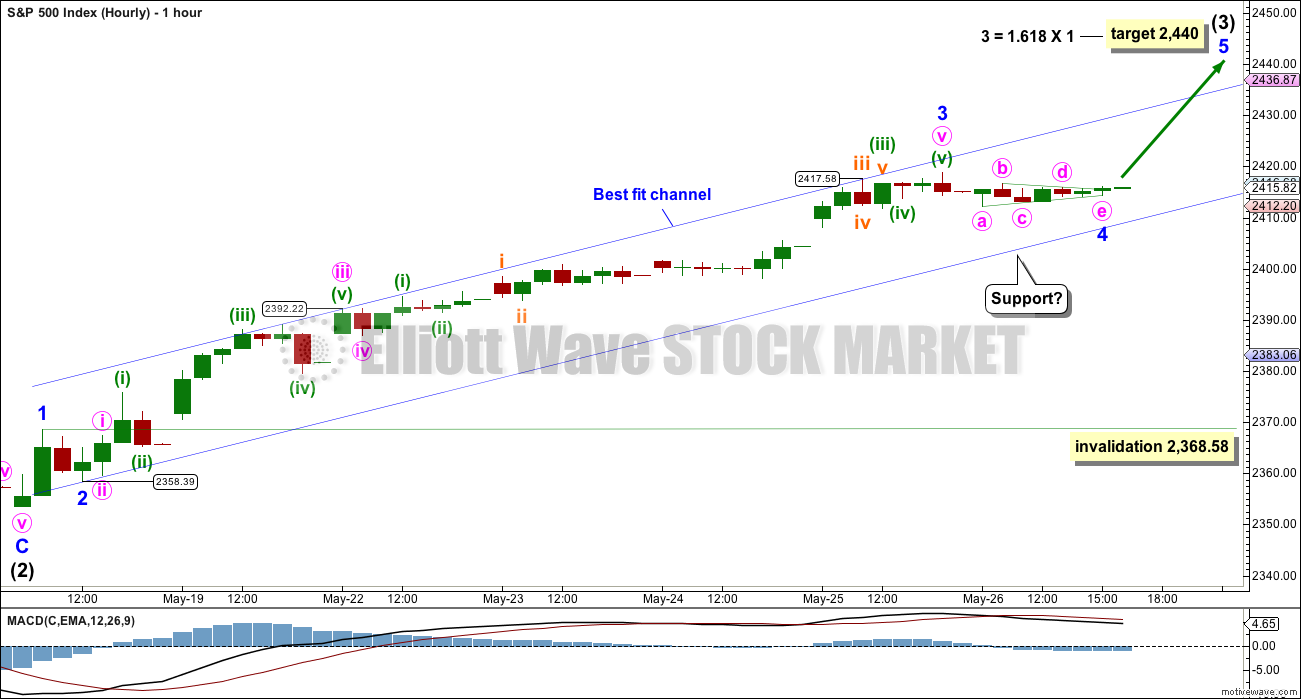
The labelling here is exactly the same as the last hourly chart, with the exception of the degree of labelling being moved all up one degree.
Intermediate wave (3) may only subdivide as an impulse. For the S&P 500, it is most common for third wave impulses to exhibit extended third waves within them. Here, minor wave 3 is just 4.44 points short of 4.236 the length of minor wave 1.
Minor wave 4 may have completed on Friday as a small regular contracting triangle. If this is wrong and minor wave 4 continues further, then it may not move into minor wave 1 price territory below 2,368.58. However, because this invalidation point is lower than the invalidation point on the daily chart, any movement below 2,398.16 would see this main wave count discarded in favour of the alternate below.
Price points are given for the anchor points of the best fit channel. Expect price to keep rising while price remains within the channel. If the channel is breached, then expect that intermediate wave (3) may be over and intermediate wave (4) may have begun, but the channel must be breached by downwards movement for confidence in a trend change, not sideways.
ALTERNATE WEEKLY CHART
Click chart to enlarge.
This alternate is new in response to a member’s suggestion. At this stage, there are several alternate wave counts possible. It is time to consider one more.
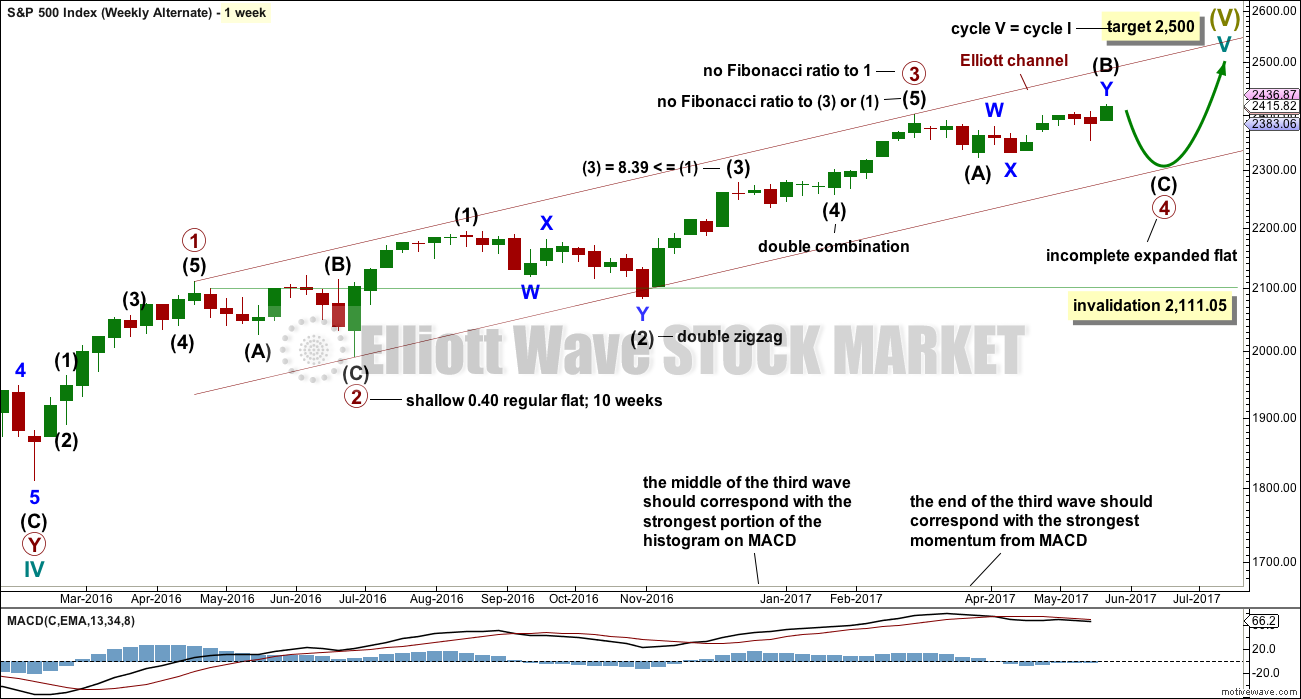
This wave count is identical up to the end of primary wave 3, Thereafter, it looks at the possibility that primary wave 4 may be an incomplete expanded flat correction.
If the expanded flat is primary wave 4, then there is very little alternation with the regular flat of primary wave 2.
Primary wave 4 may not move into primary wave 1 price territory below 2,111.05.
ALTERNATE DAILY CHART
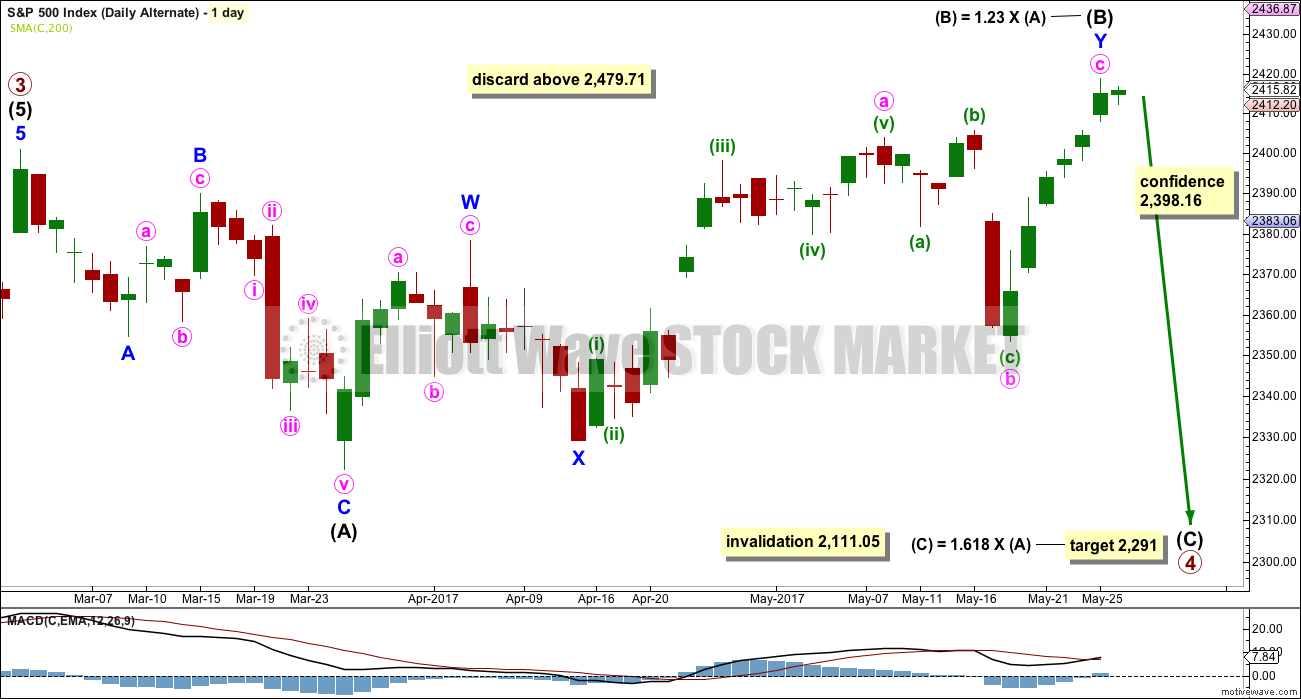
Click chart to enlarge.
Within the possible expanded flat correction, intermediate wave (A) fits as a single zigzag and intermediate wave (B) fits as a double zigzag and is within the normal range for B waves of flats.
If price keeps rising, then when intermediate wave (B) reaches twice the length of intermediate wave (A) at 2,479.71, then the idea of a flat correction continuing should be discarded based upon a very low probability. Unfortunately, this price point is far enough away to be of little use. This alternate may be discarded sooner if structure shows it is unlikely.
ALTERNATE WEEKLY CHART II
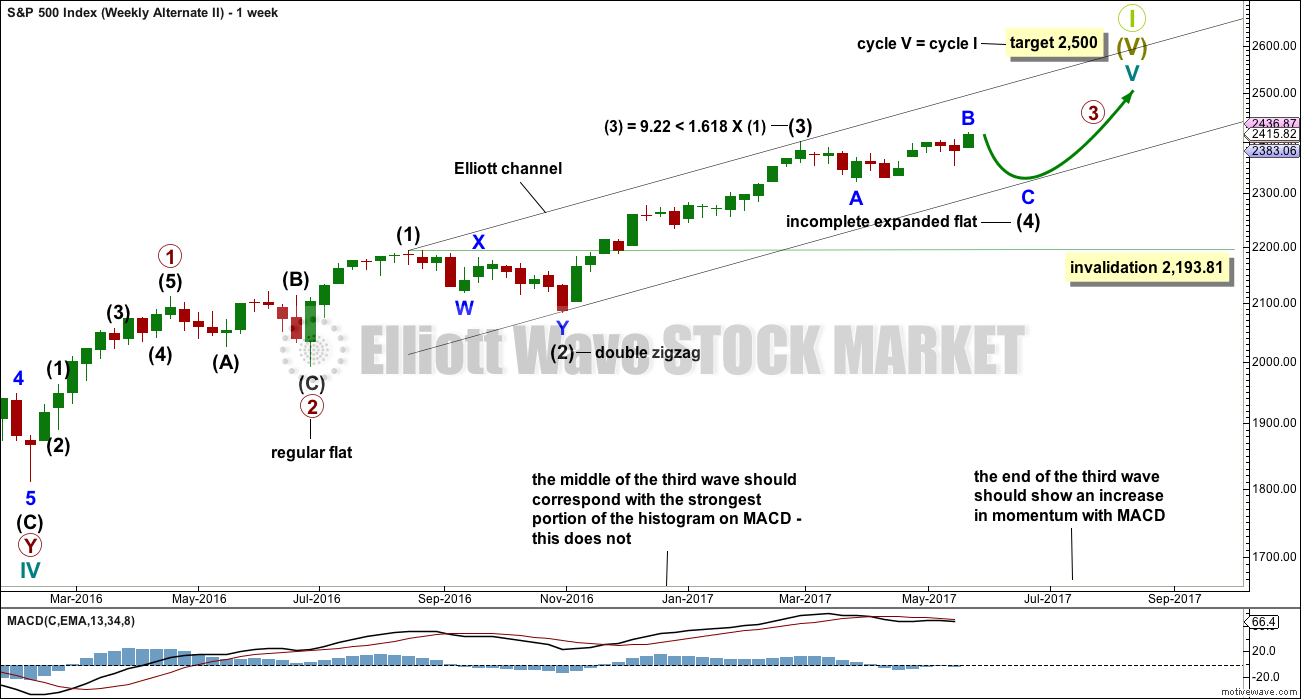
Click chart to enlarge.
This second alternate weekly wave count is also new.
It is possible that an expanded flat is unfolding and that it is intermediate wave (4), not primary wave 4. This would see alternation with the double zigzag of intermediate wave (2).
Intermediate wave (2) lasted 11 weeks. Intermediate wave (4) may so far have lasted 12 weeks. Flats are usually more time consuming than zigzags or even zigzag multiples, so at this stage the proportion looks right.
Between this alternate and the first alternate published above, there is no difference to the final target, expected next direction, or target for the expanded flat to end. This alternate will not be published on a daily basis for this reason. If it begins to diverge from the first alternate, then it will again be published.
It is important to keep the number of charts manageable and the analysis as clear as possible.
TECHNICAL ANALYSIS
WEEKLY CHART
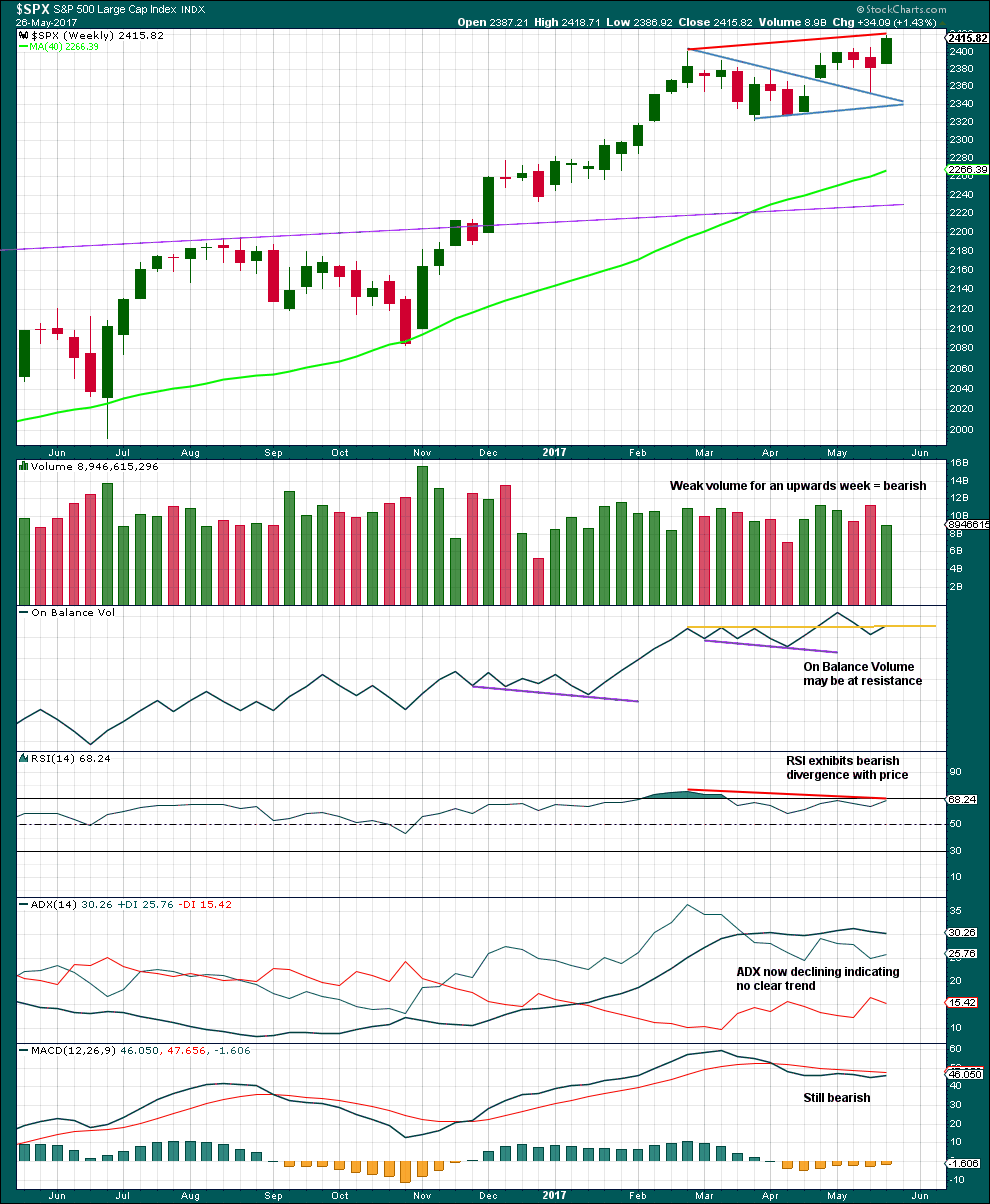
Click chart to enlarge. Chart courtesy of StockCharts.com.
This weekly chart supports the alternate wave counts over the main wave count.
DAILY CHART
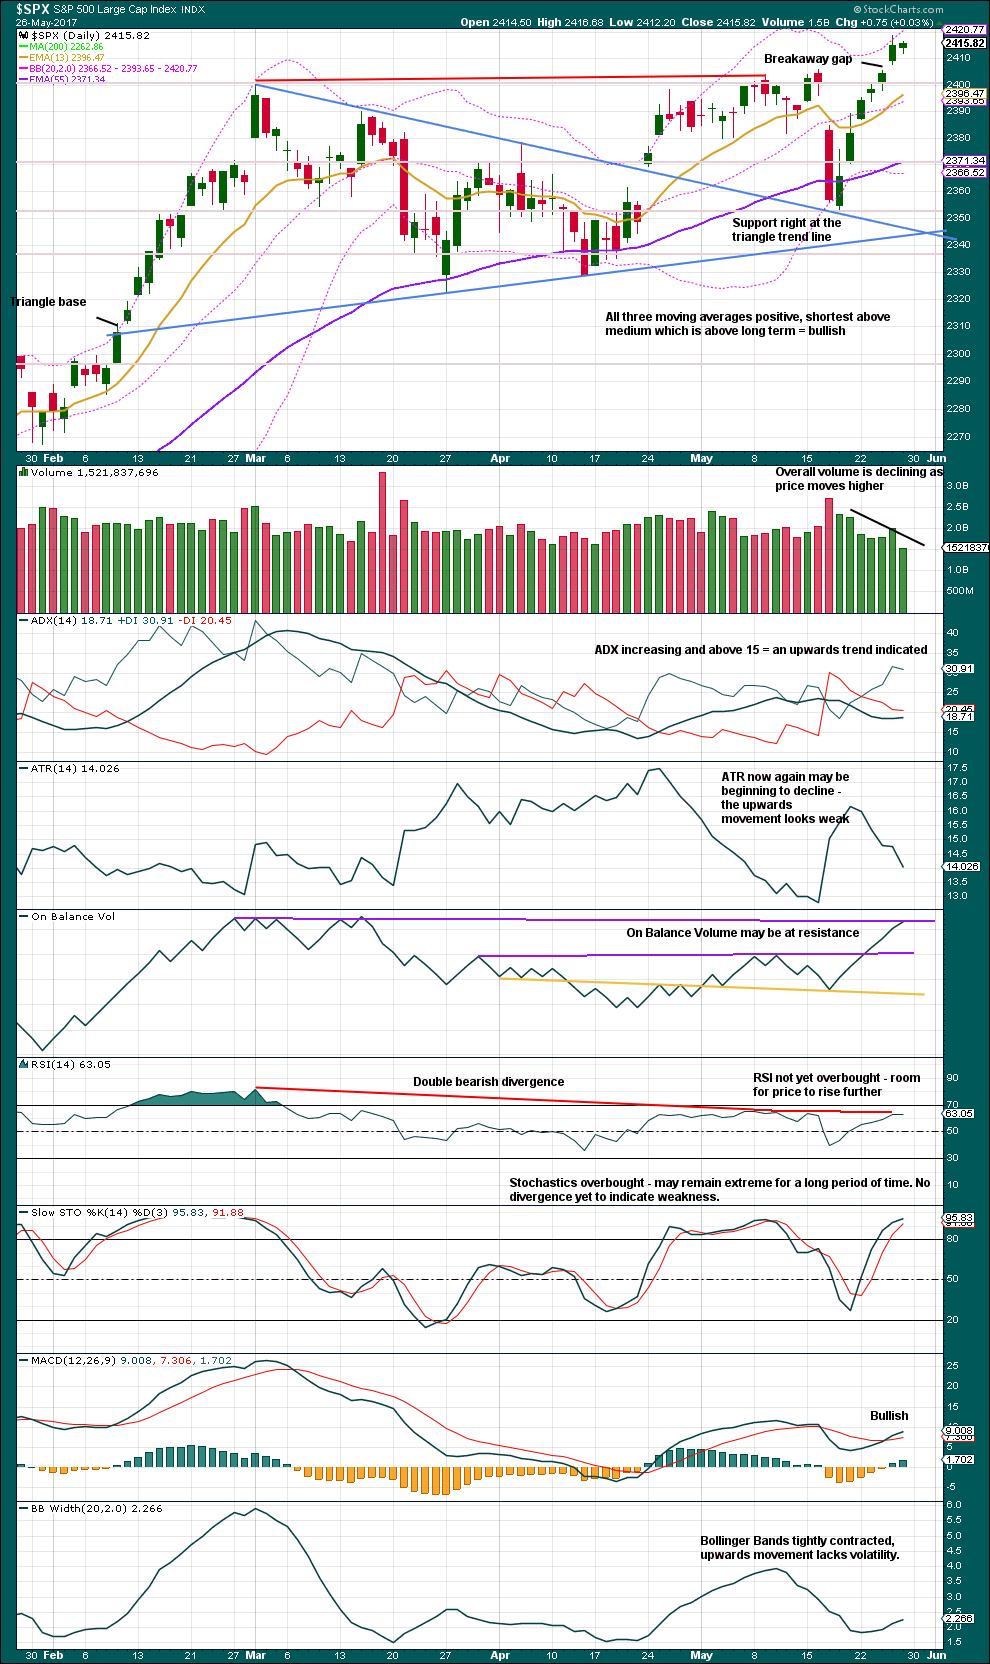
Click chart to enlarge. Chart courtesy of StockCharts.com.
If the widest part of the symmetrical triangle is taken from the high of the 1st of March to the low of the 27th of March, then a measured rule target would be at 2,448. This is just 8 points above the Elliott wave target.
Volume is bearish. On Balance Volume at resistance may also be interpreted now as bearish. Divergence with RSI is bearish. ATR is bearish.
MACD is bullish. Bollinger Bands may be beginning to widen, so this is now slightly bullish.
Overall, this picture is more bearish than bullish.
If there is something wrong with a trend, then it is often a B wave. Classic technical analysis at the end of the week offers more support to the new alternate wave count than the main wave count.
However, we have been here before. Price keeps rising although the trend looks weak. Assume the trend remains the same until proven otherwise.
The breakout from the triangle followed by a curve down and test of support at the prior resistance line looks like very typical price behaviour. It is moving up and away. The target is not yet reached. It seems most sensible to assume it will be, until the alternate Elliott wave count is confirmed by price.
VOLATILITY – INVERTED VIX CHART
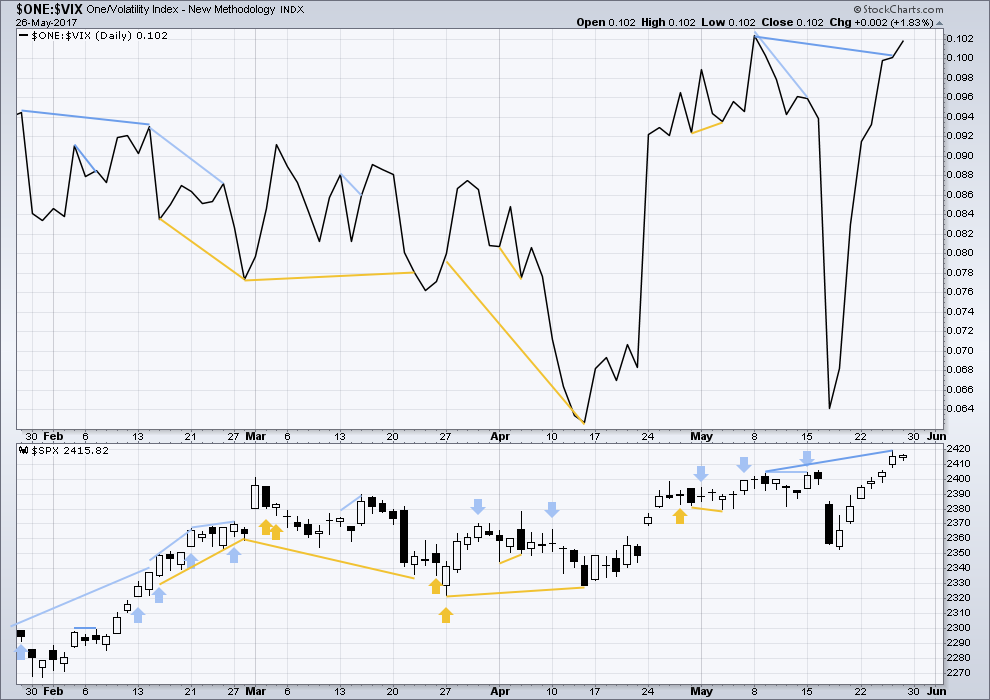
Click chart to enlarge. Chart courtesy of StockCharts.com.
Normally, volatility should decline as price moves higher and increase as price moves lower. This means that normally inverted VIX should move in the same direction as price.
Hidden mid term bearish divergence is still present but now much weaker. It looks like it may just disappear on Monday or Tuesday next week.
BREADTH – AD LINE
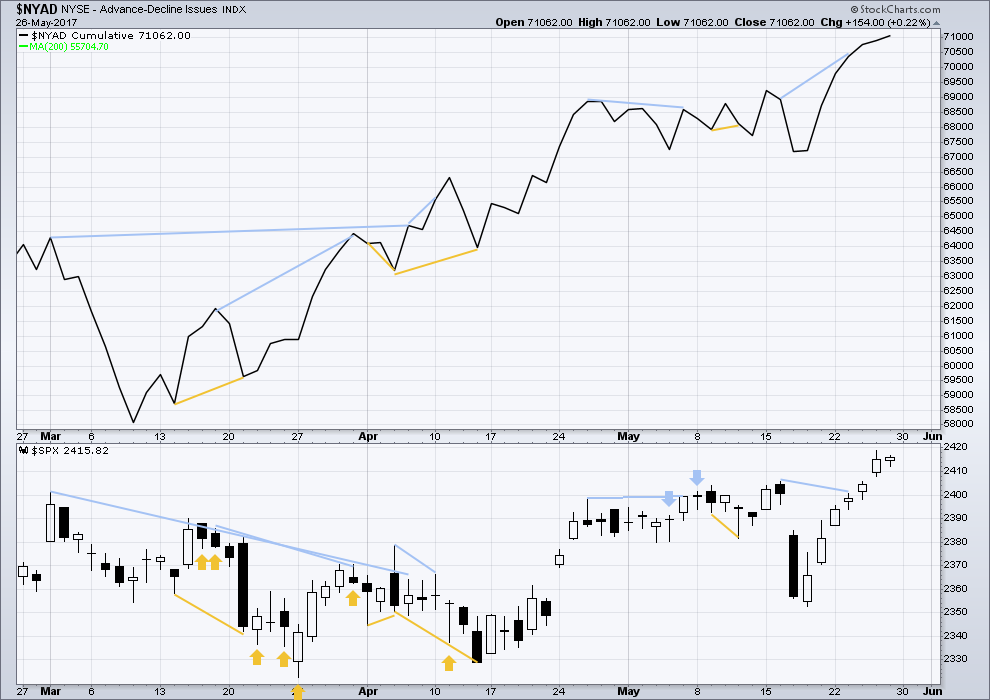
Click chart to enlarge. Chart courtesy of StockCharts.com.
With the last all time high for price, the AD line also made a new all time high. Up to the last high for price there was support from rising market breadth.
There is normally 4-6 months divergence between price and market breadth prior to a full fledged bear market. With no divergence yet at this point, any decline in price should be expected to be a pullback within an ongoing bull market and not necessarily the start of a bear market.
There is no divergence between price and breadth today; both are making new all time highs. Upwards movement in price has support from rising market breadth.
DOW THEORY
The DJIA, DJT, S&P500 and Nasdaq continue to make new all time highs. This confirms a bull market continues.
The following lows need to be exceeded for Dow Theory to confirm the end of the bull market and a change to a bear market:
DJIA: 17,883.56.
DJT: 7,029.41.
S&P500: 2,083.79.
Nasdaq: 5,034.41.
Charts showing each prior major swing low used for Dow Theory are here.
This analysis is published @ 10:50 p.m. EST on 27th May, 2017.
Another very slow quiet inside day.
Minor 4 has invalidated it’s triangle. It looks like the triangle may have been an X wave and minor 4 may be a combination.
Still expecting upwards movement. Still expecting new ATHs this week.
The channel doesn’t look like it will work. The S&P just does that, most annoying.
NYSE is closed this Monday for Memorial Day. So no data on BarChart to analyse.
Next analysis will be tomorrow.
Happy Memorial Day to all members in the USA 🙂
Indeed! Heartfelt thanks to all those who go into harm’s way to protect our way of life. Always mixed feelings at this memorial, and hoping for wisdom and integrity in those sending them.
May we look forward one day to a world in which our strongest young people don’t have to die in war.
And for those that have, remember them.
Lara I had your Alternate II in mind as well. However I had A finishing later at the low on April 17. I wasn’t happy with that as it finished with a truncation. Your version has nailed it. The only difference now is that I have your Alternate II as my main count!
Jef Kennedy, one of the few EWI analysts whose opinion I respect, has often said that in his 25 years experience with EW, wave 4s are nearly always as long in time, if not longer, than their equivalent wave 2s. Particularly at the wave degrees we’re talking about.
With this in mind, there’s been no retracement to match the form and fit of (2) until the price action we’re now seeing, following the high of March 1. Also as you’ve said, the rule of alternation is nicely adhered to by having a double zig zag for (2) and an expanded flat for (4).
Yeah, I could swap them all over…
It does look like a pretty good count.
My concern is it shows us we should expect an imminent strong fall in price. Which has been the case for alternates for some time now, and I’m afraid it’s putting members off entering long and making profit.
Because so far the fact is price has kept going up.
I don’t want perma bearishness to be stopping us from making money.
If the alternate does turn up then setting a stop at a logical place (below the last gap) and managing risk will see either profits taken or a manageable loss.
So my real reason for the main wave count being so is to assume the trend remains up until price proves it isn’t.
Yep fair enough. Kennedy also says the same thing about trend and price.
hidi ho,, first again
Darn those rabbits!
Hey! It wasn’t my fault brudder! I just got here!