New all time highs were expected for this week and that is exactly what has happened this Monday.
Summary: The target remains at 2,459 or 2,469. However, ADX on the weekly chart remains extreme, so extreme caution is still advised. If price closes the gap by moving below 2,376.98, then look out for a deeper pullback.
New updates to this analysis are in bold.
Last monthly and weekly charts are here. Last historic analysis video is here.
MAIN ELLIOTT WAVE COUNT
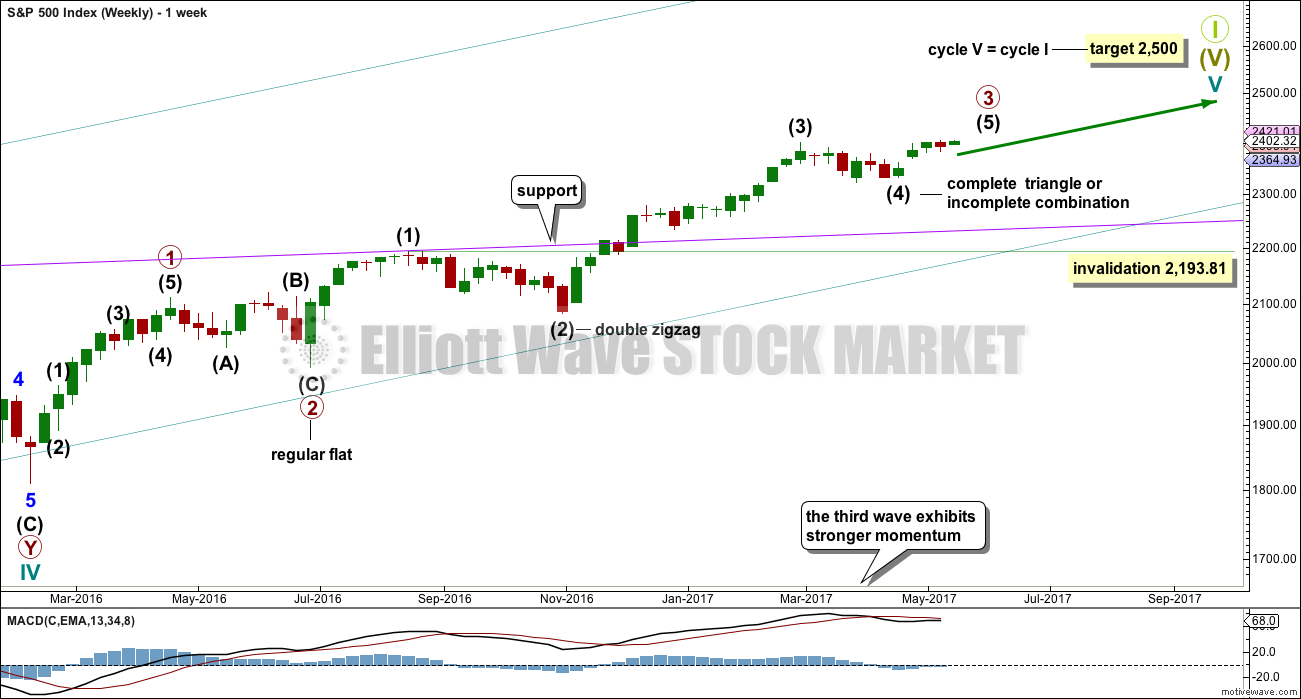
WEEKLY CHART
This wave count sees the middle of primary wave 3 a stretched out extension, which is the most typical scenario for this market.
Primary wave 3 may be incomplete. A target is now calculated for it on the daily chart.
There is alternation within primary wave 3 impulse, between the double zigzag of intermediate wave (2) and the possible triangle or combination of intermediate wave (4).
When primary wave 3 is a complete impulse, then a large correction would be expected for primary wave 4. This may be shallow.
Thereafter, primary wave 5 may be expected to be relatively short, ending about the final target at 2,500.
It is also still possible that primary wave 3 was over at the high labelled intermediate wave (3) (this idea has been published previously) and that would mean that price should currently be within primary wave 4. This idea does not at this stage diverge in terms of expected direction or structure from the daily alternate wave count below, so for clarity and to keep the number of charts manageable it will not be published on a daily basis. I will follow the idea and will again publish it when it begins to diverge from the main wave count.
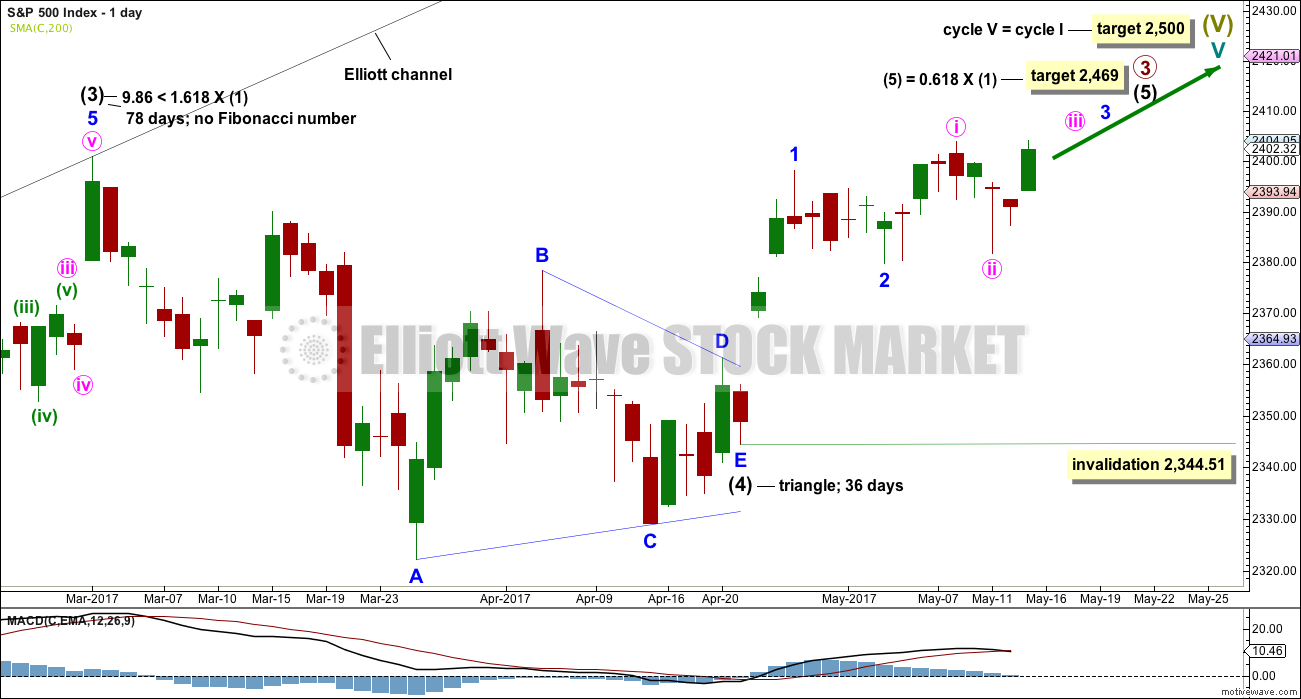
DAILY CHART
Intermediate wave (4) may be a complete regular contracting triangle. It may have come to a surprisingly swift end with a very brief E wave.
There is already a Fibonacci ratio between intermediate waves (3) and (1). This makes it a little less likely that intermediate wave (5) will exhibit a Fibonacci ratio to either of intermediate waves (1) or (3); the S&P often exhibits a Fibonacci ratio between two of its three actionary waves but does not between all three.
Within intermediate wave (5), minor waves 1 and now 2 look to be complete.
Within minor wave 3, no second wave correction may move beyond its start below 2,379.75. However, an alternate idea below at the hourly chart level looks at the possibility that minor wave 2 may not be over and may continue lower. This idea has an invalidation point at the start of minor wave 1 at 2,344.51.
The structure of intermediate wave (5) on the daily chart does not look complete. So far it looks like a possible three up. Minor wave 3 still needs to complete, then minor waves 4 and 5. This may last another couple of weeks at least.
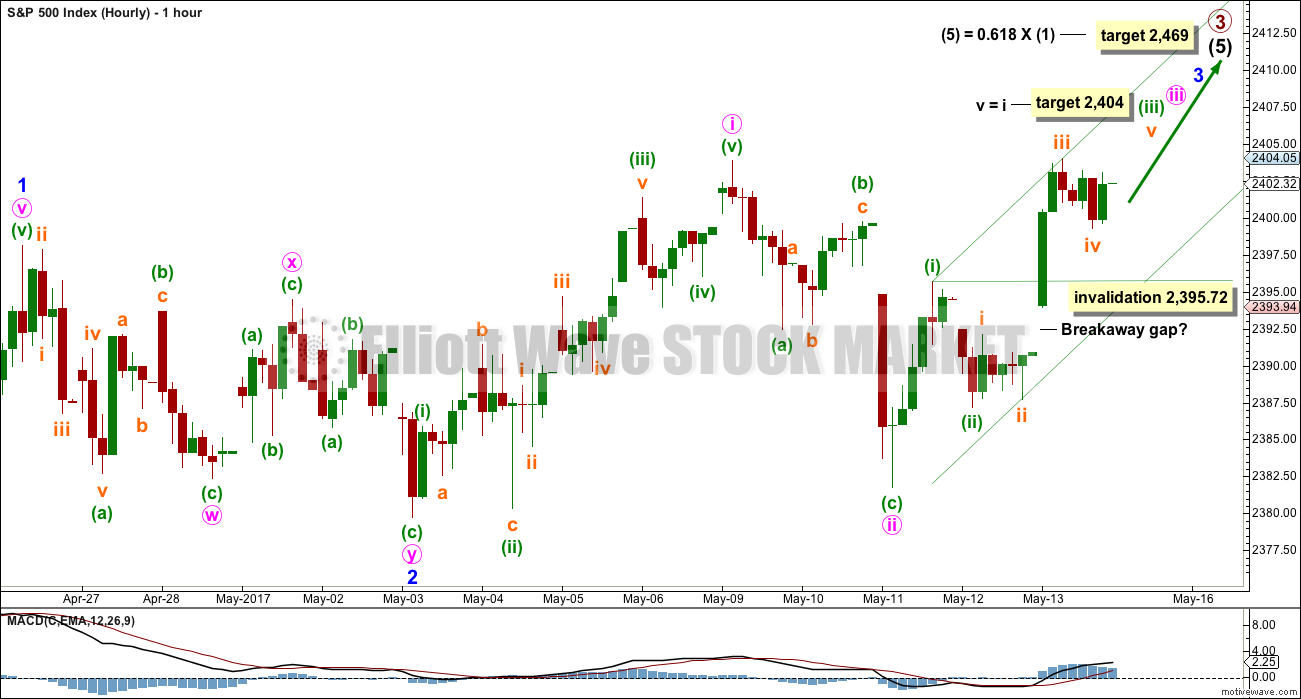
HOURLY CHART
Minor wave 2 may have completed as a double zigzag.
This main wave count still expects to see a further increase in upwards momentum over the next few days.
Minute wave iii may only subdivide as an impulse. Within minute wave iii, minuette wave (iv) may not move into minuette wave (i) price territory below 2,395.72.
The channel drawn about upwards movement is a best fit. When minuette wave (iii) is complete, then the lower edge may show where minuette wave (iv) may find final support.
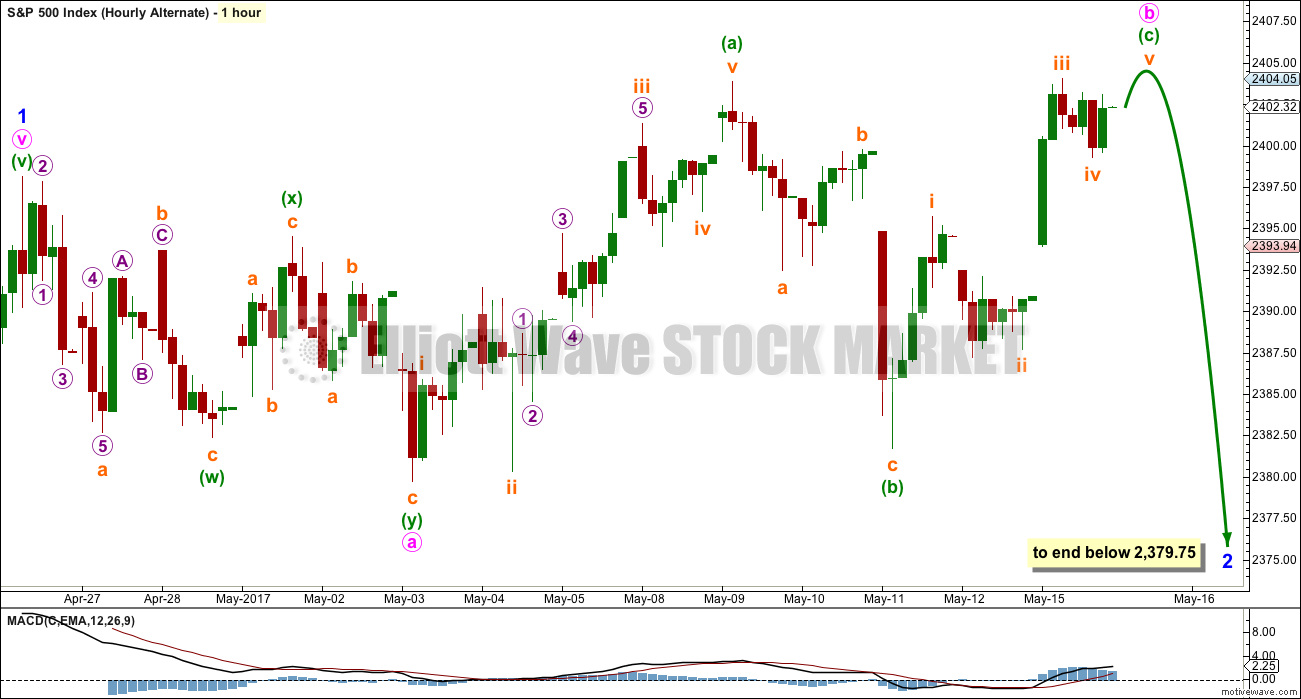
ALTERNATE HOURLY CHART
It is also possible that minor wave 2 is continuing further as an expanded flat correction. Minute wave b may be incomplete.
The normal range for minute wave b within a flat correction is from 1 to 1.38 the length of minute wave a, giving a range from 2,398.16 to 2,405. There is no maximum limit for minute wave b within a flat, but when it reaches twice the length of minute wave a at 2,416.57 the idea of a flat correction continuing for minor wave 2 should be discarded based upon a very low probability.
When minute wave b may be complete with one more small high, then this alternate wave count would require a few days of downwards movement to complete minute wave c. Minute wave c would be very likely to make at least a slight new low below the end of minute wave a at 2,379.75 to avoid a truncation and a very rare running flat.
A new low below 2,395.72 would invalidate the main wave count at the hourly chart level and provide some confidence in this alternate.
ALTERNATE DAILY CHART
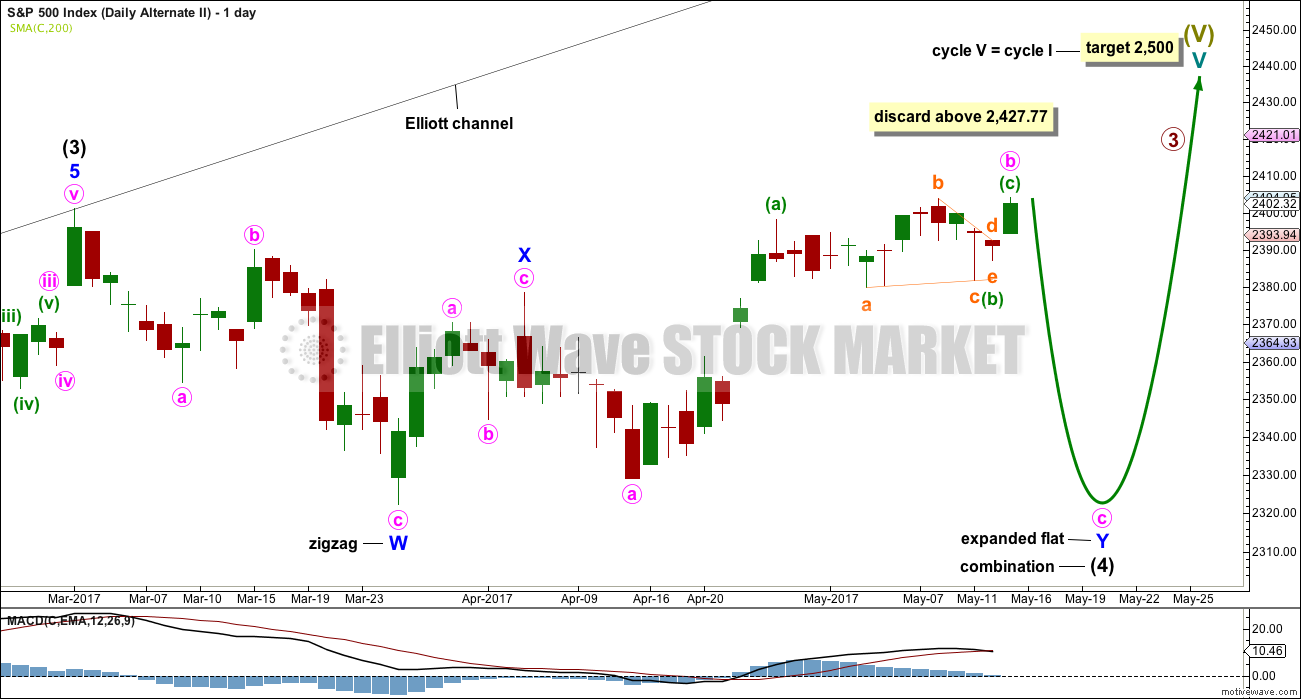
What if intermediate wave (4) was not a complete triangle but is still unfolding as a double combination? The subdivisions of this wave count would be labeled in the same way, with the exception of the degree of labelling, if the correction were to be primary wave 4.
Double combinations are very common structures. This would still provide perfect alternation in structure with the double zigzag of intermediate wave (2). Although double zigzags and double combinations are both labelled W-X-Y, they are very different structures and belong to different groups of corrections.
The purpose of combinations is the same as triangles, to take up time and move price sideways. Intermediate wave (2) lasted 58 days. So far intermediate wave (4) has lasted 52 days. If it continues for another one to two weeks, it would still have excellent proportion with intermediate wave (2).
This alternate wave count still has some support from classic technical analysis, particularly extreme ADX at the weekly chart level.
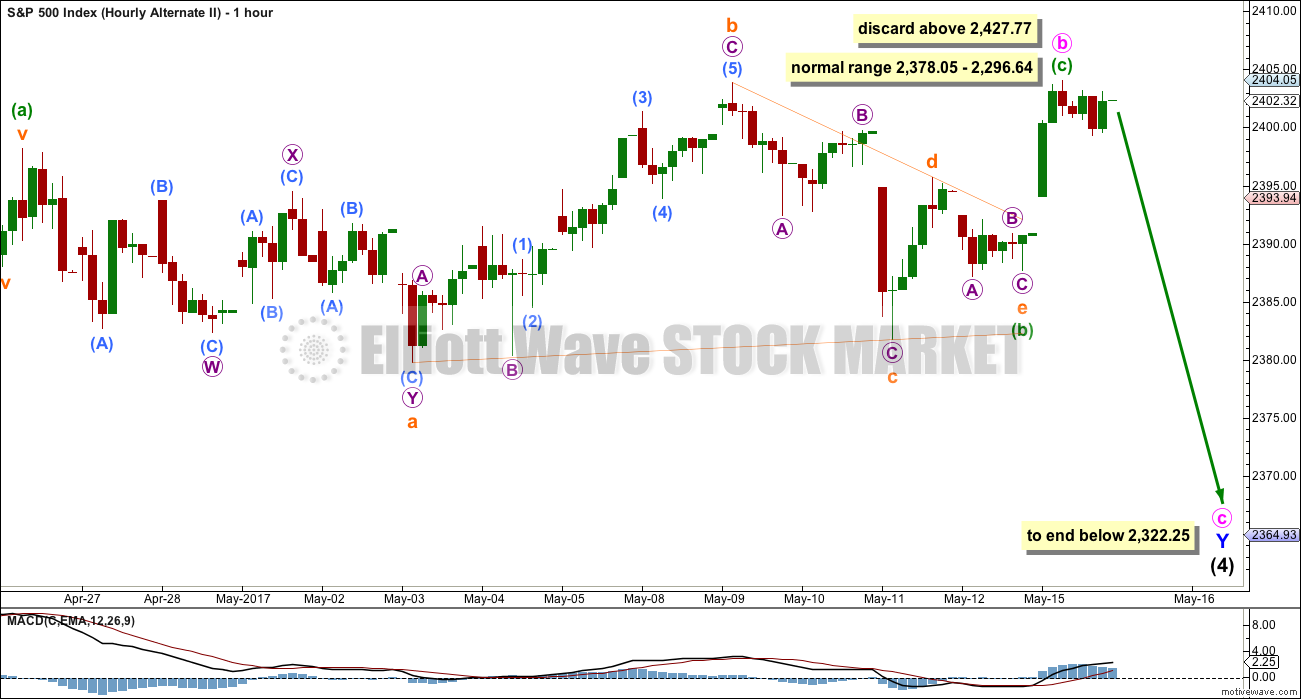
ALTERNATE HOURLY CHART
Minute wave b is longer than the common range of up to 1.38 times the length of minute wave a, but still within allowable limits of up to 2. The higher minute wave b goes the lower the probability that this wave count is correct.
However, I have seen plenty of expanded flat corrections with B waves longer than 1.38 times the length of their A waves. This wave count remains entirely acceptable.
Minute wave c would be very likely to end at least slightly below the end of minute wave a at 2,322.25 to avoid a truncation and a very rare running flat.
TECHNICAL ANALYSIS
WEEKLY CHART
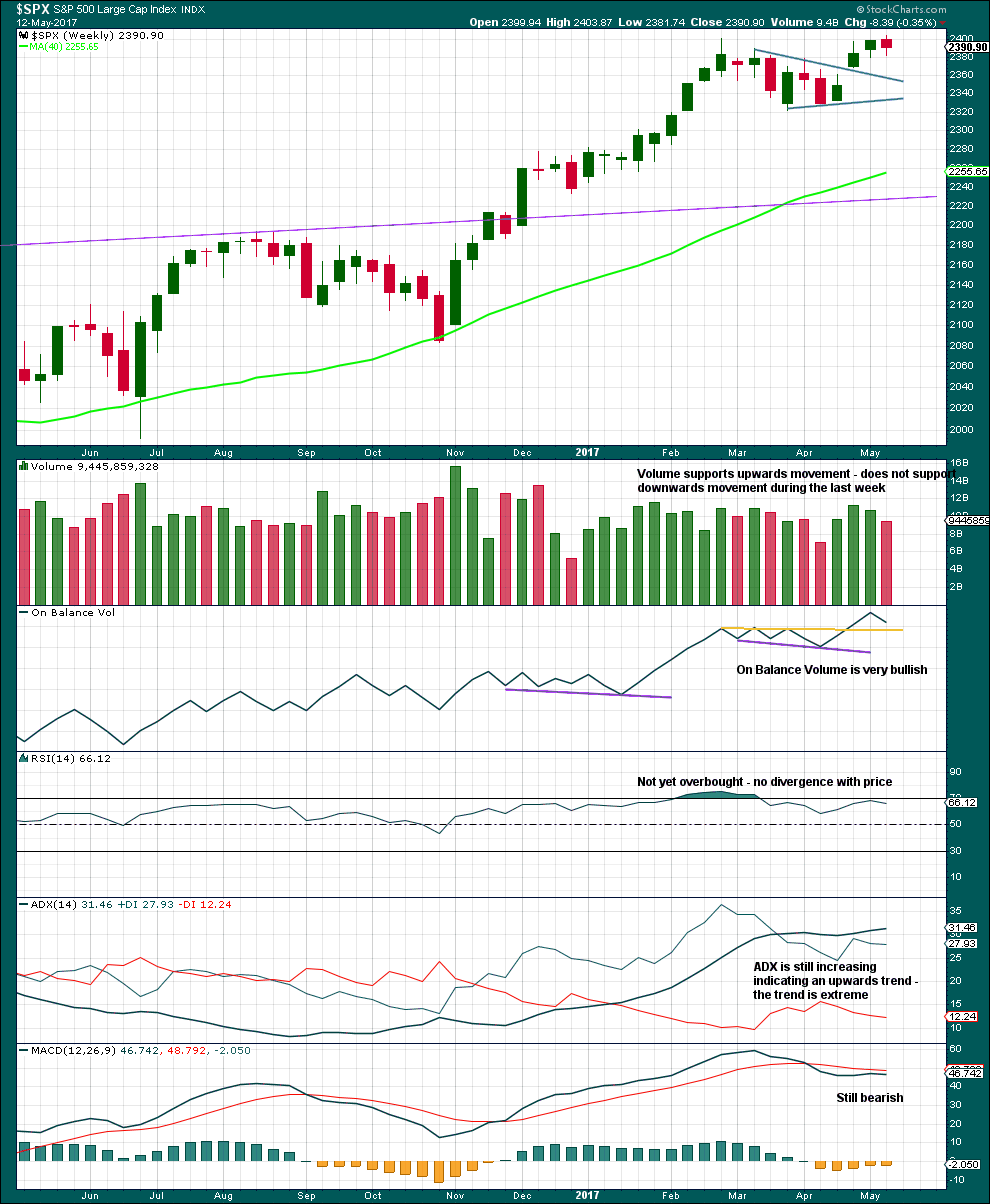
Click chart to enlarge. Chart courtesy of StockCharts.com.
An upwards week is completed but closes red. The balance of volume is down and it shows a decline. Downwards movement during the week did not have support from volume. This looks like a pullback within a larger upwards trend.
ADX is extreme and nearing very extreme. A bigger consolidation or deeper pullback should be expected.
Within this bull market, beginning in March 2009, this has happened at the weekly chart level on four occasions: January 2010, the end of February 2011, early June 2013, and late July 2014. On each occasion it was immediately followed by three to four weeks of downwards movement.
DAILY CHART
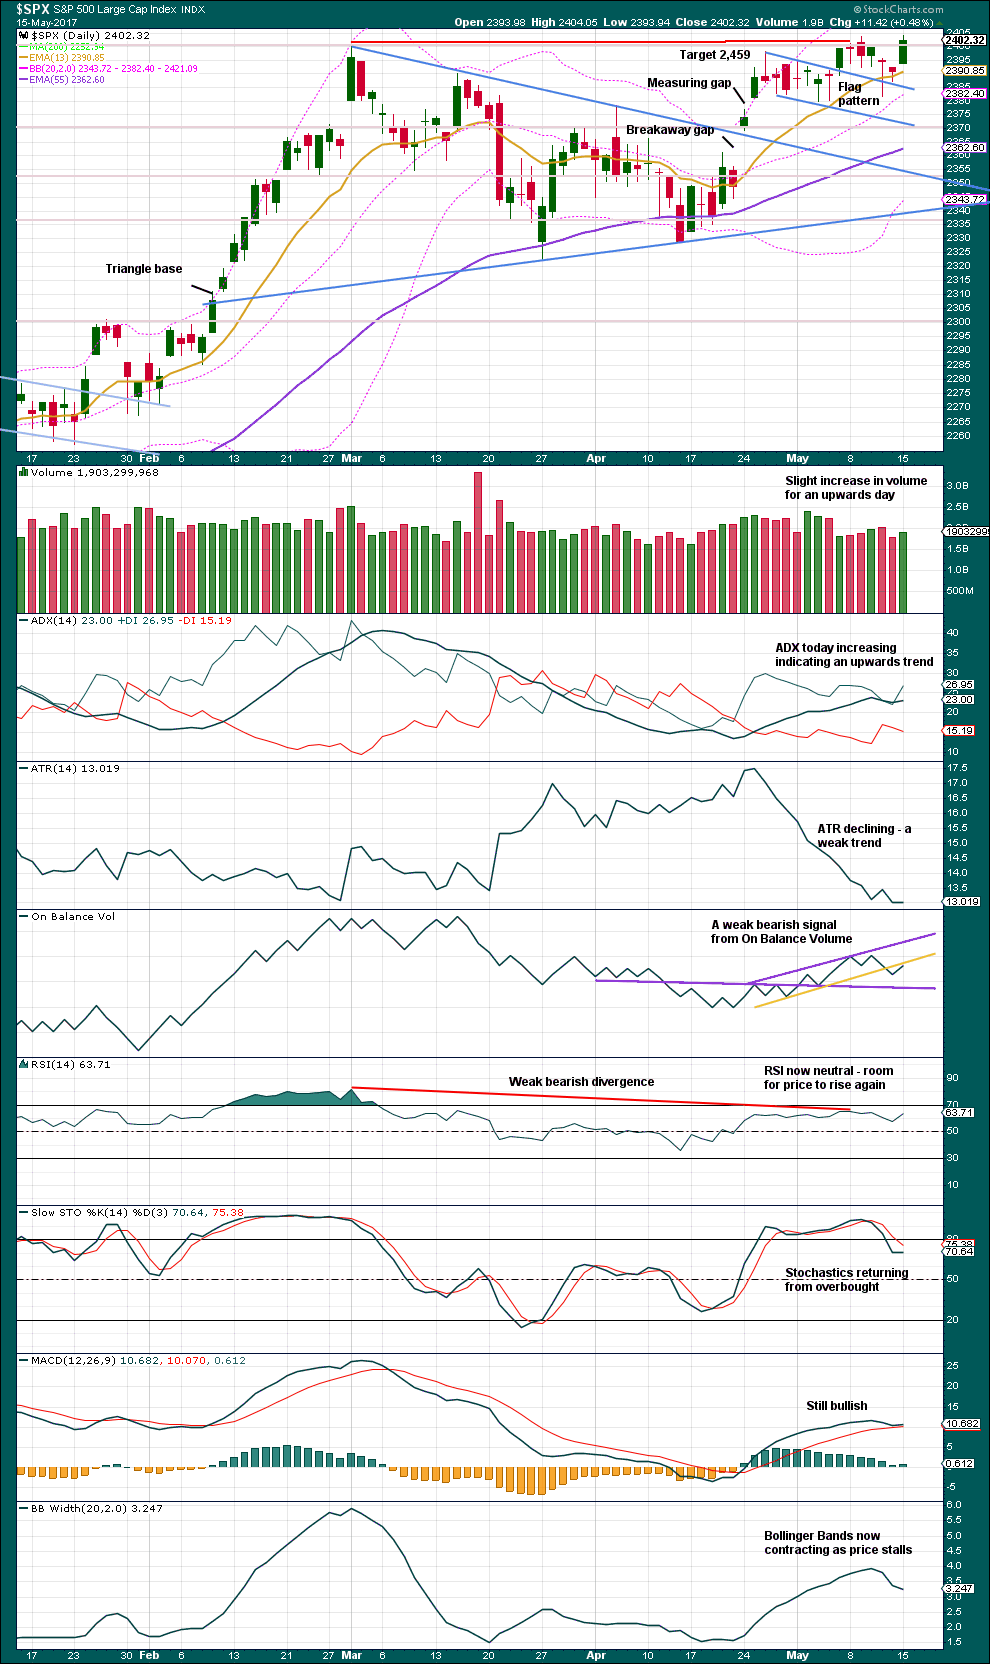
Click chart to enlarge. Chart courtesy of StockCharts.com.
Bullish long lower wicks on five daily candlesticks have now been followed by an upwards day to a new all time high. Today’s green candlestick is bullish and has some support from volume.
However, volume is relatively light. Towards the end of a primary degree third wave this would be expected.
The trend is weak; it lacks range and volatility.
On Balance Volume may find resistance here.
VOLATILITY – INVERTED VIX CHART
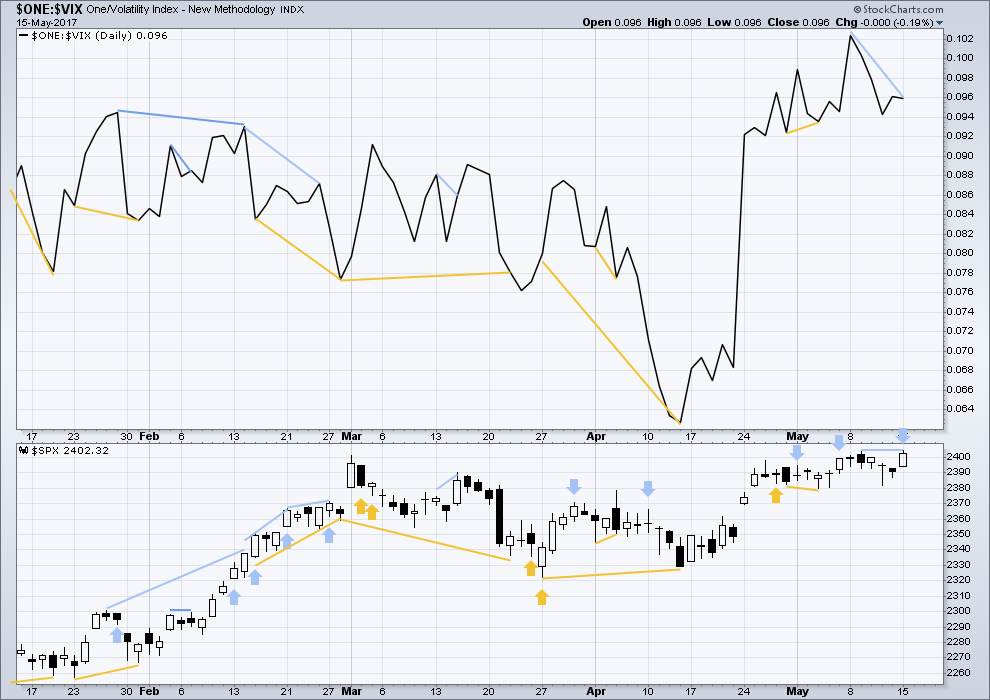
Click chart to enlarge. Chart courtesy of StockCharts.com.
Normally, volatility should decline as price moves higher and increase as price moves lower. This means that normally inverted VIX should move in the same direction as price.
It is noted that there are now six multi day instances of bullish divergence between price and inverted VIX, and all have been followed so far by at least one upwards day if not more. This signal seems to again be working more often than not. It will again be given some weight in analysis.
Price moved higher today, but inverted VIX moved lower. The rise in price today did not come with a normal corresponding decline in volatility; volatility increased. This single day bearish divergence may be followed by one or more days of downwards movement.
There is also short term bearish divergence between price and inverted VIX today.
BREADTH – AD LINE
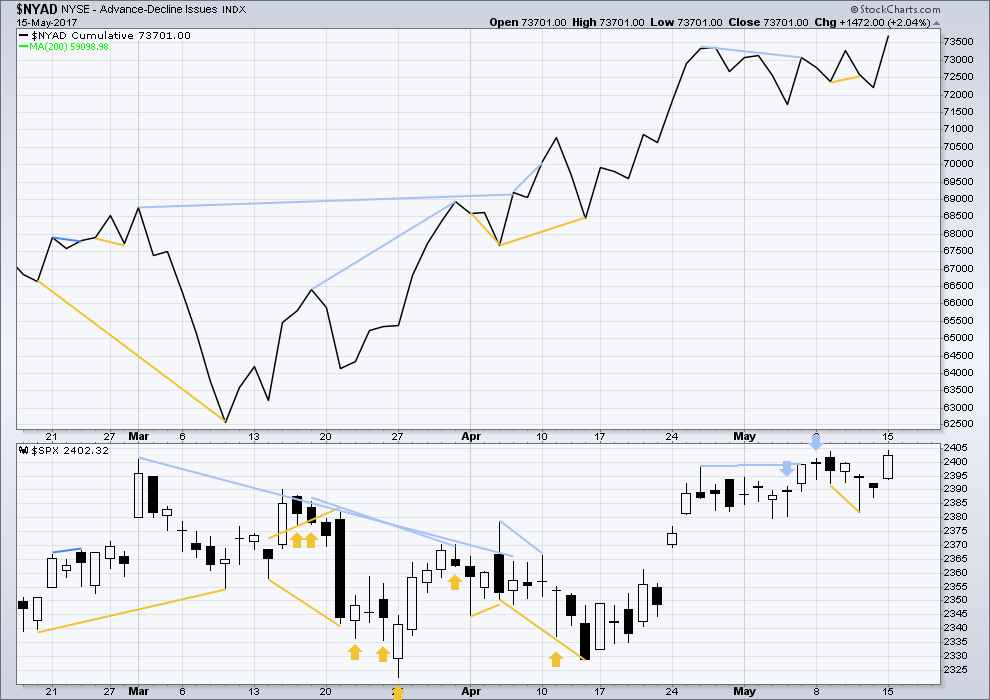
Click chart to enlarge. Chart courtesy of StockCharts.com.
Short term bullish divergence noted in analysis two sessions ago has now been followed by upwards movement. It is considered to have worked.
Price and the AD line both made new all time highs today. Upwards movement has support from an increase in market breadth.
DOW THEORY
The DJIA, DJT, S&P500 and Nasdaq continue to make new all time highs. This confirms a bull market continues.
The following lows need to be exceeded for Dow Theory to confirm the end of the bull market and a change to a bear market:
DJIA: 17,883.56.
DJT: 7,029.41.
S&P500: 2,083.79.
Nasdaq: 5,034.41.
Charts showing each prior major swing low used for Dow Theory are here.
This analysis is published @ 12:02 a.m. EST on 16th May, 2017.

Well…looks like they wanted to keep things propped up during the regular session and let the futures market tell us what next to expect…tomorrow should be most interesting.
what the heck…I see that Verne, futures not happy at all
Market torpidity continues. Looking like some kind of diagonal drifting downwards…*yawn*
Not much to do but watch and wait as narrow trading range still in play..
Market moving like molasses but we could have a series of first and second waves after a five down, three up….if so gap should fill by the close…
Below 2396.05 gives an impulse down from this morning’s highs. That has been of little lasting significance of late. More important is the gap from the 2390.90 close…
“Problem is… all currencies will most likely be outlawed, with little to no exchange at all on printed bills or coinage. Physical gold and silver too. Electronic payments only, regulated harshly like nothing we’ve ever imagined.”
Curtis made this interesting comment on the last thread and I think he is right in that they are going to try.
What will happen to circumvent this is an explosion of the barter trade. They will NEVER be able to outlaw precious metals as currency. They are the only thing that really are. The only option they have would be confiscation, and with Americans armed to the teeth that should go over like a lead balloon. Some folk think they are going to issue new currency akin to what the puppet Moody was instructed to do by way of trial run in India. It has wreaked absolute havoc among small retailers in that country and put a huge number of them out of business.
Russia and China are going in the opposite direction and rumor has it they are both considering gold -backed notes. This makes them a dire threat to the petro-dollar dominance, already waning, and raises serious prospects for conflict with these nations. The bullies in the West would do well to remember that neither Put or Xi is Ghadaffi.
I’m wondering how exactly they could outlaw crypto currencies like Bitcoin.
Not sure they could physically actually do it… but then that field of technology isn’t exactly my specialty.
I’m thinking, they’d need the full cooperation of all countries for it to work. And that’s not going to happen anytime soon.
That is one of the things that makes crypto- currencies so powerful and attractive as an alternative store of value. It does not need government permission to exist and be a viable tool of trade.
The other thing is it cannot be manipulated in the way that Gold and Silver is via a paper market. It will be interesting to see if the gate-keepers of those currencies ever permit demand to be siphoned off via a paper market such as ETFs or derivative instruments. If that happens it would put the banksters firmly back in control so I doubt it will ever happen.
And without that manipulation the Bitcoin market behaves…. like an extreme commodity.
It has whopping huge blowoff tops, all over the place. Extreme Fibonacci ratios between it’s waves. Very extended third waves, even more extended fifths.
Even looking at it on a log scale chart it looks extreme. Normally converting from arithmetic to logarithmic brings the chart to more of a line looking wave, but not Bitcoin.
Which leads me to the conclusion that market manipulation does not necessarily have a material effect on price, but fear and greed has a massive effect. Because it’s just fear and greed that’s driving Bitcoin price.
The inter-market divergence between DJI and SPX is noteworthy. DJI needs a significant rally from here to post new highs and should do so this week to confirm the upward trend. This kind of divergence, if it persists is usually bearish.
Regained the first spot.