Upwards movement continues with a new all time high. Downwards movement at the end of this session remains above stops on long positions.
Summary: The upwards trend has most likely resumed, but a strong warning from ADX at the weekly chart level means members should keep stops on long positions tight and be prepared to take profits more quickly than usual. Stops may remain just below 2,389.38 at this time. The profit target remains at 2,469.
Always remember my two Golden Rules for trading:
1. Always use a stop.
2. Invest only 1-5% of equity on any one trade.
New updates to this analysis are in bold.
Last monthly and weekly charts are here. Last historic analysis video is here.
MAIN ELLIOTT WAVE COUNT
WEEKLY CHART
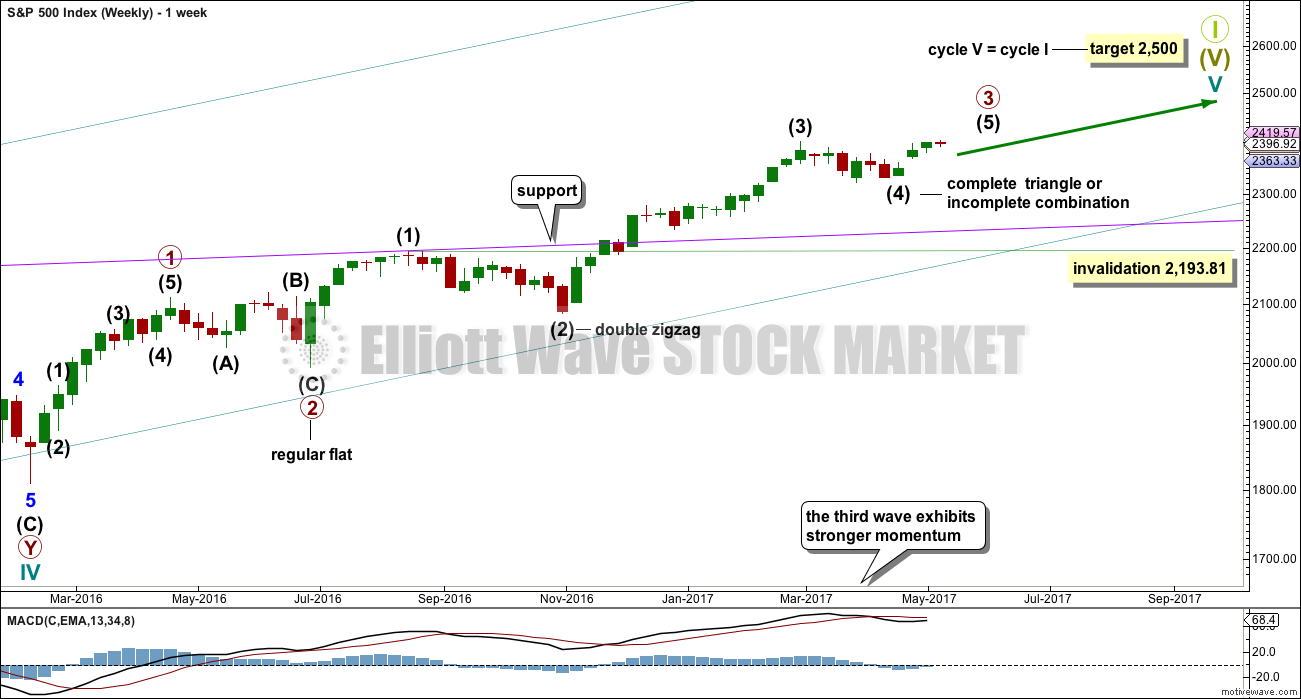
This wave count sees the middle of primary wave 3 a stretched out extension, which is the most typical scenario for this market.
Primary wave 3 may be incomplete. A target is now calculated for it on the daily chart.
There is alternation within primary wave 3 impulse, between the double zigzag of intermediate wave (2) and the possible triangle or combination of intermediate wave (4).
When primary wave 3 is a complete impulse, then a large correction would be expected for primary wave 4. This may be shallow.
Thereafter, primary wave 5 may be expected to be relatively short, ending about the final target at 2,500.
DAILY CHART
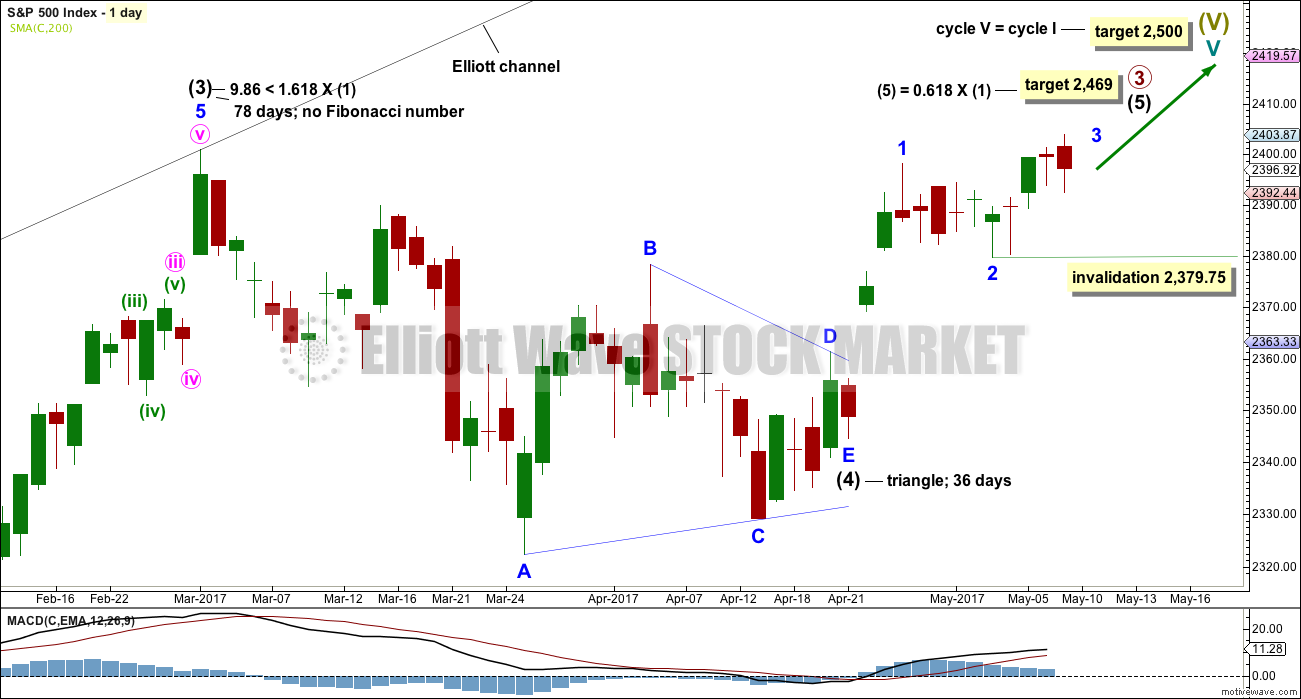
Primary wave (4) may be a complete regular contracting triangle. It may have come to a surprisingly swift end with a very brief E wave.
There is already a Fibonacci ratio between intermediate waves (3) and (1). This makes it a little less likely that intermediate wave (5) will exhibit a Fibonacci ratio to either of intermediate waves (1) or (3); the S&P often exhibits a Fibonacci ratio between two of its three actionary waves but does not between all three.
Within intermediate wave (5), minor waves 1 and now 2 look to be complete.
Within minor wave 3, no second wave correction may move beyond its start below 2,379.75.
The structure of intermediate wave (5) on the daily chart does not look complete. So far it looks like a possible three up. Minor wave 3 still needs to complete, then minor waves 4 and 5. This may last another couple of weeks at least.
HOURLY CHART
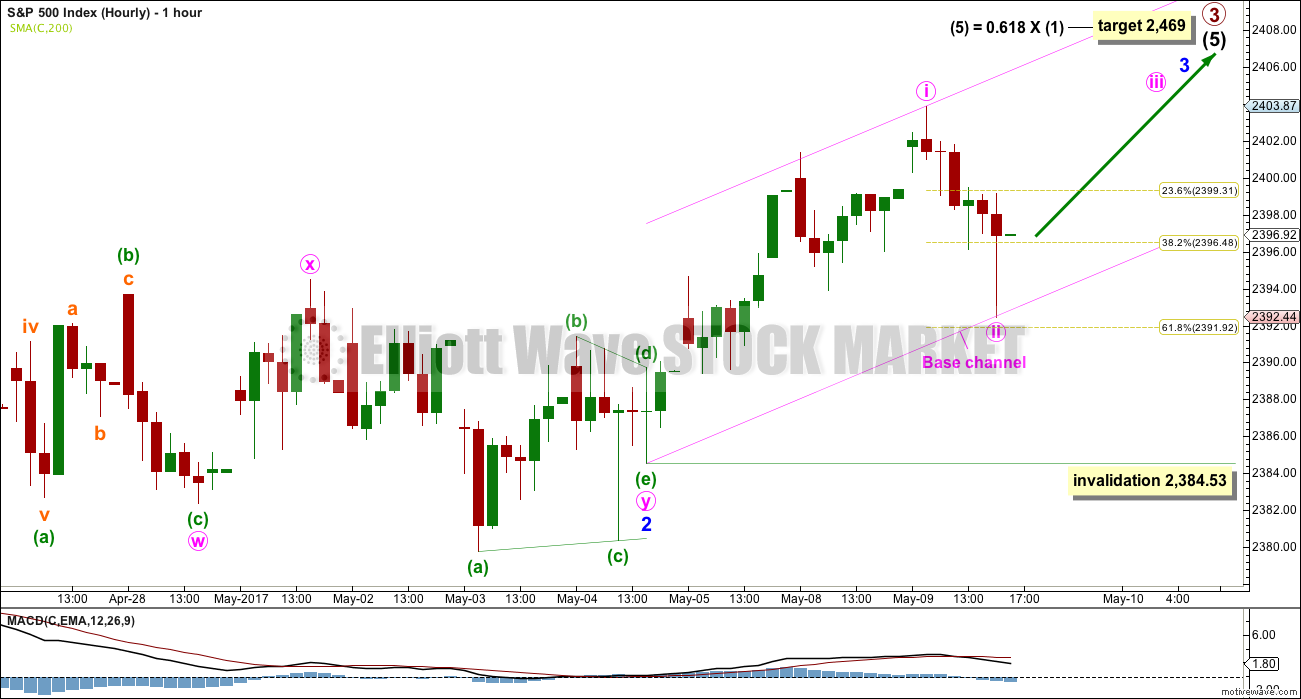
Minor wave 2 may have competed as a double combination: zigzag – X – triangle.
After analysis of minute wave i on the five minute chart, it is possible to see minute wave i over at today’s new high. Minute wave ii may have ended close to the 0.618 Fibonacci ratio.
The very long lower wick on the last red hourly candlestick is very bullish.
A base channel is drawn about minute waves i and ii. Along the way up, if this wave count is correct, lower degree corrections should now find support at the lower edge of this base channel.
Minute wave ii may not move beyond the start of minute wave i below 2,384.53.
ALTERNATE DAILY CHART
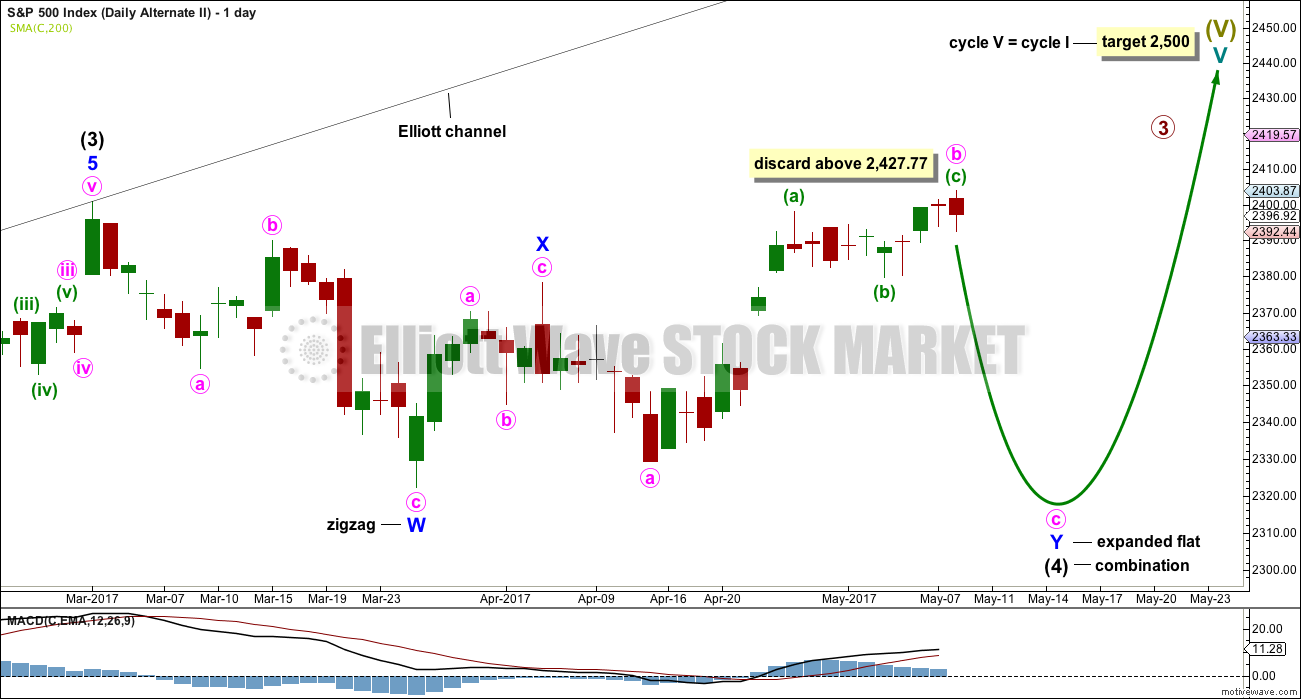
What if intermediate wave (4) was not a complete triangle but is still unfolding as a double combination?
Double combinations are very common structures. This would still provide perfect alternation in structure with the double zigzag of intermediate wave (2). Although double zigzags and double combinations are both labelled W-X-Y, they are very different structures and belong to different groups of corrections.
The purpose of combinations is the same as triangles, to take up time and move price sideways. Intermediate wave (2) lasted 58 days. So far intermediate wave (4) has lasted 48 days. If it continues for another one to two weeks, it would still have excellent proportion with intermediate wave (2).
This alternate wave count now has some support from classic technical analysis, particularly extreme ADX at the weekly chart level. If price suffers a quick reversal, then this would be the new main wave count.
ALTERNATE HOURLY CHART
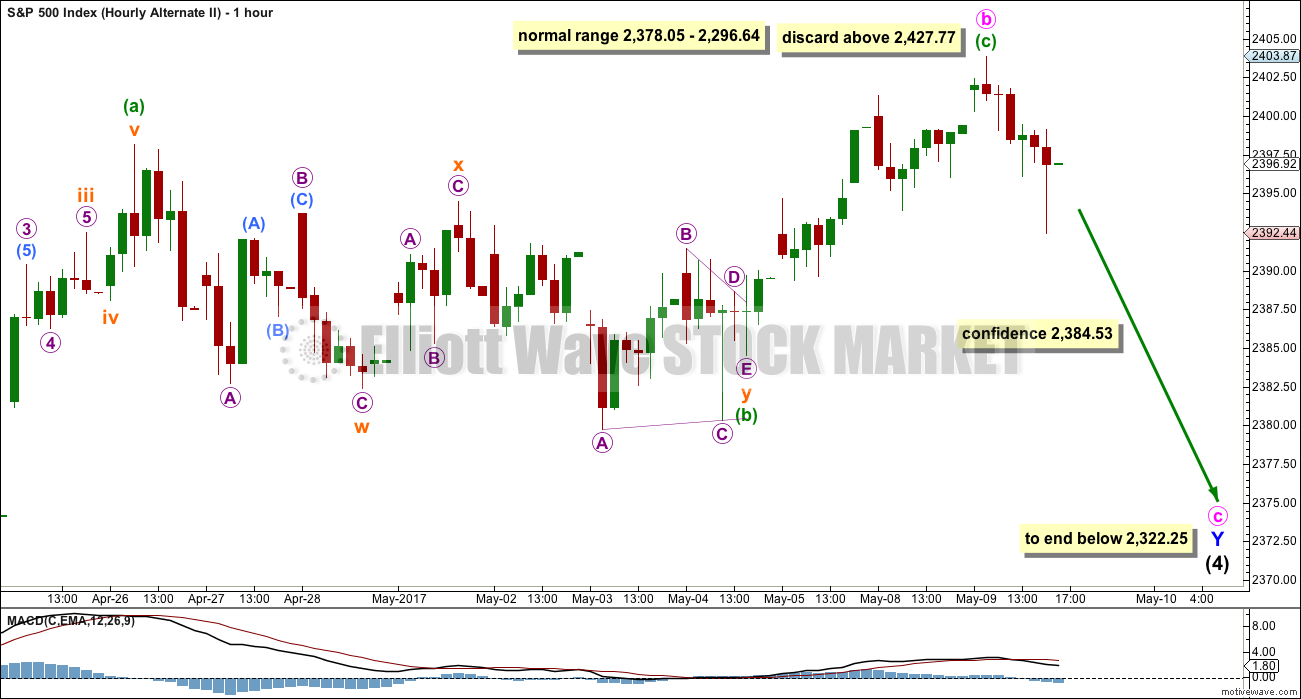
Subdivisions within the correction here labelled minuette wave (b) and the upwards wave here labelled minuette wave (c) are now seen in the same way for both wave counts.
Minute wave b is now a 1.52 length of minute wave a. This is longer than the common range of up to 1.38, but still within allowable limits of up to 2. The higher minute wave b goes the lower the probability that this wave count is correct.
However, I have seen plenty of expanded flat corrections with B waves longer than 1.38 times the length of their A waves. This wave count remains entirely acceptable.
A new low now below 2,384.53 would see the main wave count discarded in favour of this alternate. If that happens, then expect a deeper and sharper pullback to end intermediate wave (4).
TECHNICAL ANALYSIS
WEEKLY CHART
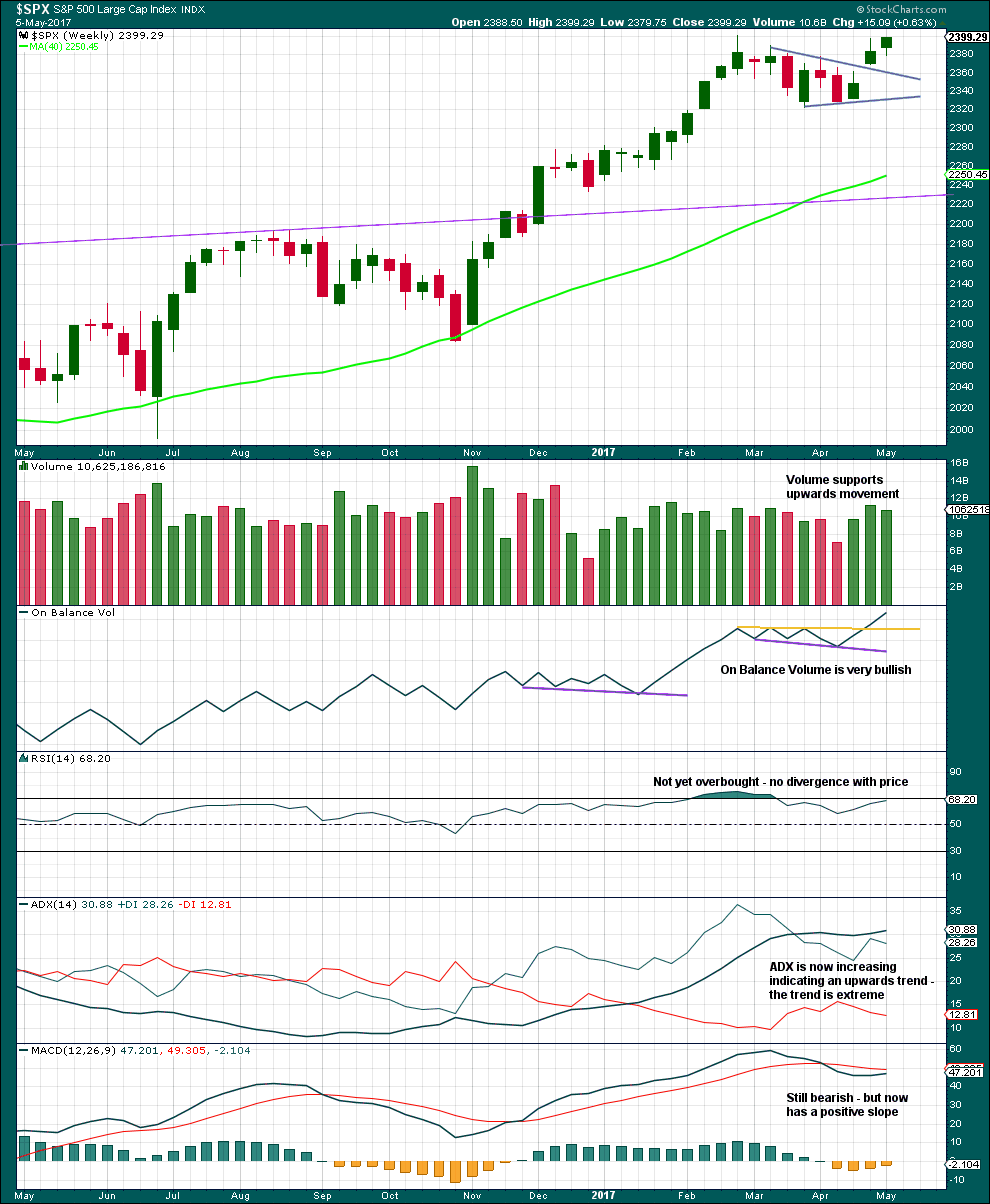
Click chart to enlarge. Chart courtesy of StockCharts.com.
Volume for the last three upwards weeks is all stronger than the two downwards weeks prior. There is more support for upwards movement than downwards. This is bullish.
The only concern here is ADX is extreme. Within this bull market, beginning in March 2009, this has happened at the weekly chart level on four occasions: January 2010, the end of February 2011, early June 2013, and late July 2014. On each occasion it was immediately followed by three to four weeks of downwards movement.
Extreme ADX at the weekly chart level supports the alternate Elliott wave count.
Very bullish On Balance Volume supports the main Elliott wave count.
DAILY CHART
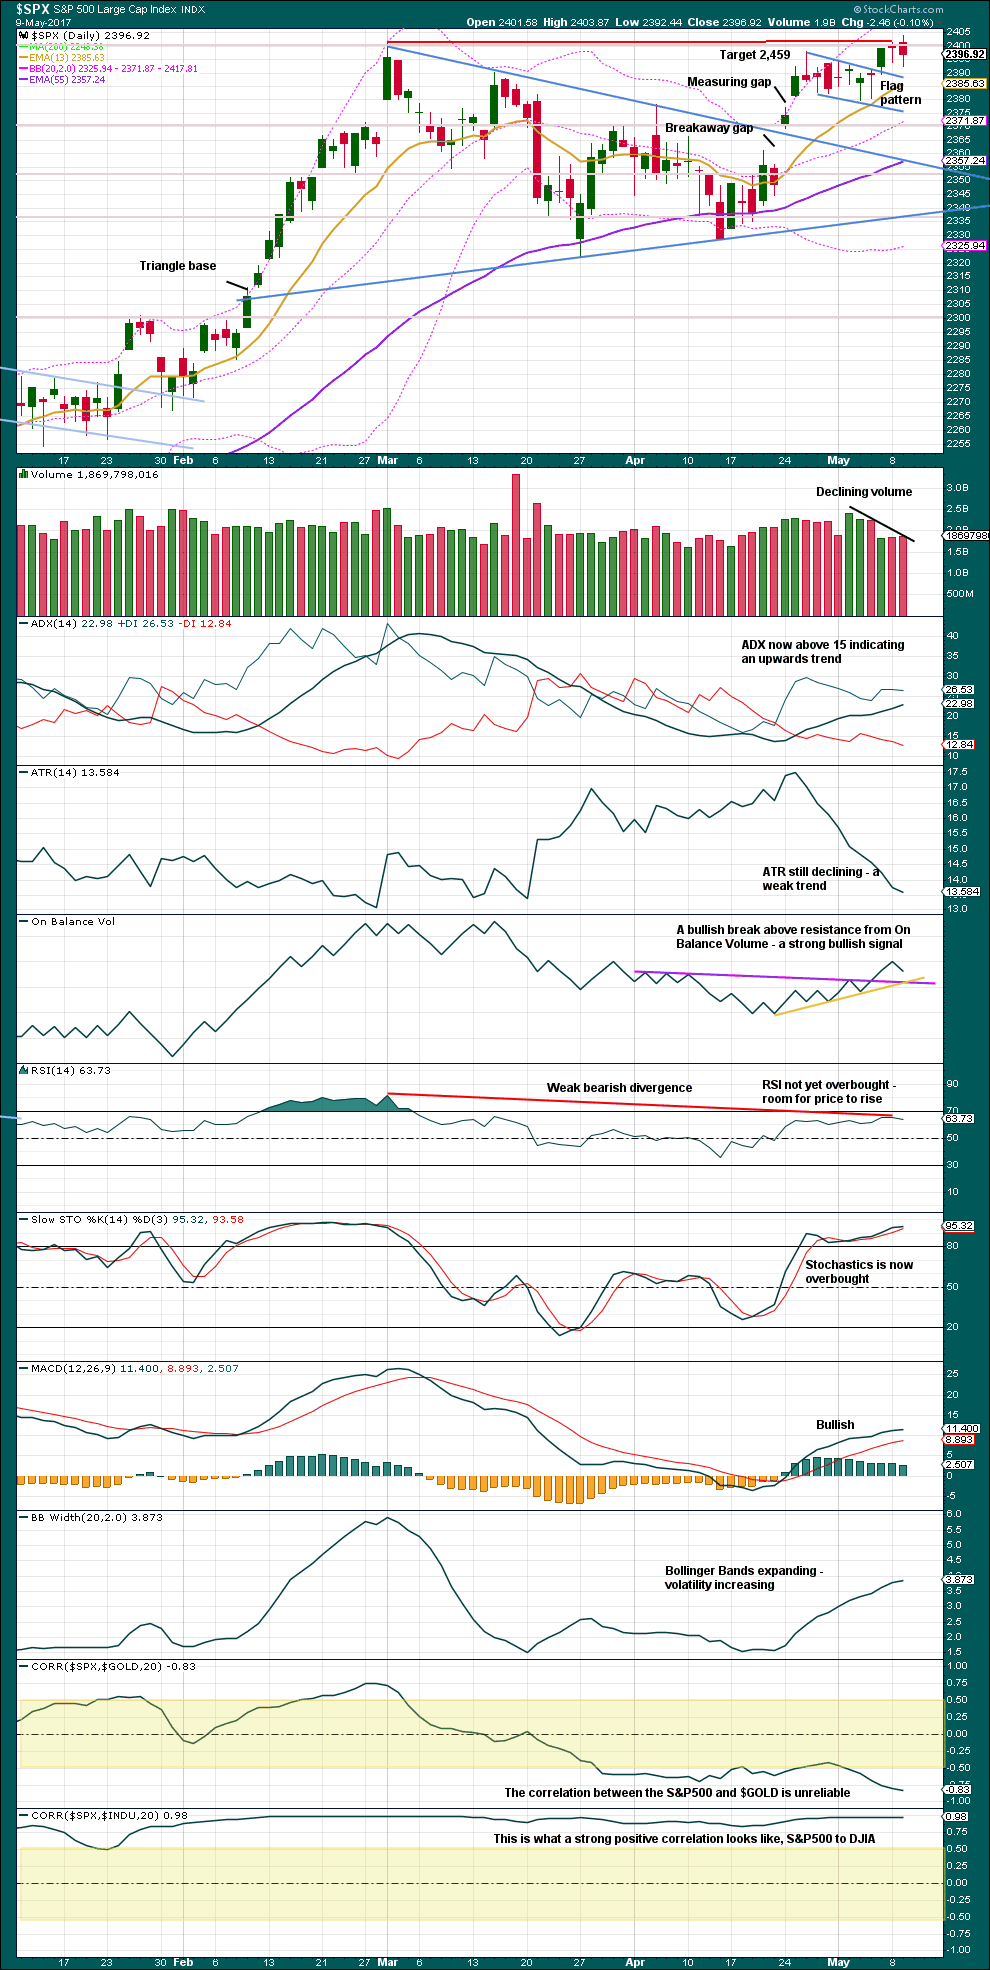
Click chart to enlarge. Chart courtesy of StockCharts.com.
Volume continues to be relatively light and this is concerning for bulls. However, On Balance Volume remains bullish.
The trend does not have support from increasing ATR. Declining ATR indicates bulls are tiring; this is not normal for a third wave. In conjunction with some weak bearish divergence between price and RSI this is concerning for bulls.
Bollinger Band expansion looks normal for a healthy trend. MACD is bullish.
While this chart remains mostly bullish, there is still concern enough to warrant a warning to members to manage risk diligently and be prepared to take profit on long positions more quickly than usual.
VOLATILITY – INVERTED VIX CHART
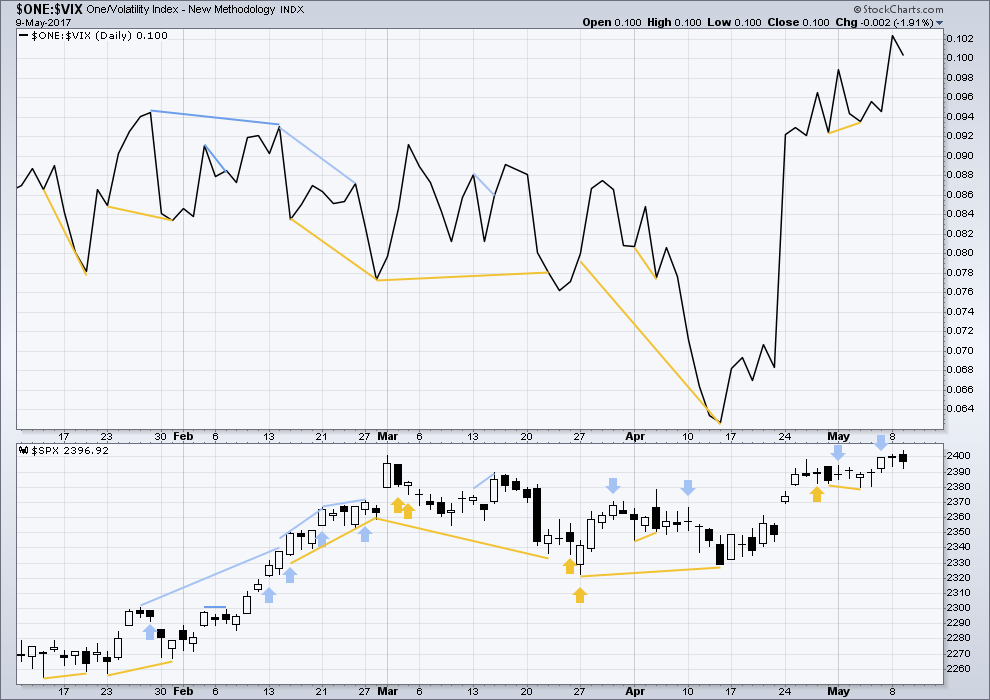
Click chart to enlarge. Chart courtesy of StockCharts.com.
Normally, volatility should decline as price moves higher and increase as price moves lower. This means that normally inverted VIX should move in the same direction as price.
It is noted that there are now six multi day instances of bullish divergence between price and inverted VIX, and all have been followed so far by at least one upwards day if not more. This signal seems to again be working more often than not. It will again be given some weight in analysis.
There is no new divergence today. An outside day had the balance of volume down with an increase in volatility.
BREADTH – AD LINE
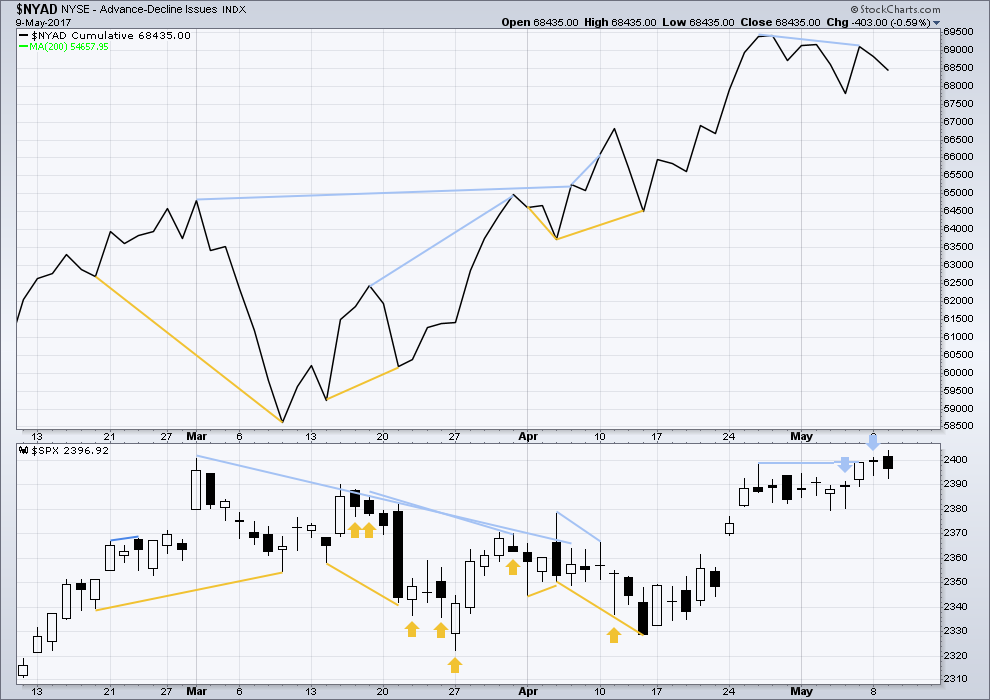
Click chart to enlarge. Chart courtesy of StockCharts.com.
Yesterday’s single day bearish divergence between price and the AD line has been followed by a red daily candlestick, which made a new low. It may be considered to have worked.
There is no new divergence today.
DOW THEORY
The DJIA, DJT, S&P500 and Nasdaq continue to make new all time highs. This confirms a bull market continues.
The following lows need to be exceeded for Dow Theory to confirm the end of the bull market and a change to a bear market:
DJIA: 17,883.56.
DJT: 7,029.41.
S&P500: 2,083.79.
Nasdaq: 5,034.41.
Charts showing each prior major swing low used for Dow Theory are here.
This analysis is published @ 10:57 p.m. EST.

No change with this small inside day to the analysis.
It doesn’t look convincing as either the start of minute iii up (main wave count) or the start of minute c down (alternate).
IKR! 🙂
On the sidelines for now…
Auto bots programmed to sell VIX above 10.00. Nothing to see until we get a clear break above that ceiling it would appear.
Unloaded remaining VIX calls at 1.50. Will buy back with a new 52 week low or a close above 10.00
Cheerio!
Taking another stab at VIX 10.00 strike calls. Proffering a stink bid of 1.20 in hopes of getting filled on a pop higher…
I should be so lucky…! Oh well…win some…loose some.
Opening sell to close on order remaining batch for limit of 2.10 GTC…should fill today if we are ending a second wave up…
It is sure not looking at all like a C wave down. This choppy price action seems corrective. I think we need at least one more wave up before the bigger correction…if indeed we are going to get one anytime soon…
They absolutely refused to sell me back those calls at 1.30….they are onto me! 😀
Despite the almost 3% drop in VIX, those 10.00 strike calls still bid at 1.35.
Somebody not convinced…they should be 1.20, but the ask is still 1.50 …. hmmnn…
VIX reaches 1993 low. Following is a quote of something I read yesterday from an unnamed source I respect greatly:
——————————————————————————————————
When the VIX goes sub 10 it takes several months to a year for equities to top.
——————————————————————————————————-
Another source produced this commentary:
——————————————————————————————————-
At this time, based on all the things I know about the U.S. stock market (current Wave structure implications, U.S. margin debt, insider traders selling stock, overbought warnings from my ***** Index, a rising interest rate environment and the volume of new accounts being opened at brokerage firms in 2017 around the country), THIS is the FIRST TIME since August 2015 that I’m VERY concerned a “Stock Market Crash” is just 1-3 months away.
The two ingredients currently missing from the typical setup for a major market top is volatility (which is normally high at major tops and bottoms) and widespread media coverage. With those two elements absent, the S&P might need to undergo a violent “blow off” in the next 1-2 months. Such behavior will increase volatility and definitely get the attention of the main stream media.
In summary, the S&P is likely to produce a MAJOR MARKET TOP sometime during the next 1-3 months. Keep in mind, during the next 1-3 months, it IS possible the S&P will experience a final 5-10% “explosion” in price. That should be enough to shift public psychology to the bullish side and invoke the kind of reckless speculation typical of a top of this magnitude.
———————————————————————————————————
Just some food for thought.
Thanks for those interesting comments Rod.
It has been slowly dawning on me over the past several months that no one alive today has ever witnessed a top of this immensity. I finally got it that I had to stop complaining about the market not behaving the way it used to and just accept what it was actually doing. For that reason, I am always more than a little amused at analysts who confidently cite this or that statistic about what the market did in the past, to project what it must necessarily do in the future. Remember Yogi Berra? 🙂
The suggestion in the last comment about an absence of bullishness in the current market I find more than a little strange….
Here is a little different take on the price action in VIX from Kimble. Interesting what actually happened to VIX when it hit these levels back in 2007.
Interesting. Thanks for that Rodney.
If the OCO AD line from Lowry’s is to have at leat 4 months of divergence, then with the last high in April the earliest for a top could be August.
Unless of course it makes new highs.
The regular AD line has made new highs.
Incredible! They normally wait until around ten to smash volatility but jumped on it shortly after the open. I’ll happily take another 52 week low in a down market…
How long are they willing to sell volatility to buy a falling market? What happens when they stop?
Filled at 1.50…
Selling to close at the open 150 VIX 10.00 strike calls at a limit price of 1.50
Holding second half and will re-buy if we see a new 52 week low.
Lara, I posted a chart in yesterday’s comments. You may need a magnifying glass!
That’s entirely possible, yes.
It doesn’t make too much difference in terms of expected direction to the alternate here. It makes a slight difference in how low we’d expect the pullback to go; your idea needs it to make a new low below 2,322.25 to avoid a truncation, while the alternate above needs it to only end about that level.
If price starts falling hard then I’ll probably want to publish both alongside each other.
Futures down slightly. VIX down slightly.
The bizarro market behavior continues with lower prices leading to increasing complacency. Hopefully VIX will clear 10 today with this morning’s decline. Volatility is starting to act curioser and curioser….
Aha.