
Price remains range bound again today. The longer price remains coiled between resistance and support, the closer and more violent the breakout will be.
Summary: The main wave count expects an upwards breakout. The alternate expects a downwards breakout. There is a little more support for the alternate, but not enough for reasonable confidence, even though there is more support today for the alternate from divergence between price and the AD line and VIX.
Because the picture is reasonably neutral, it would be my advice at this time to wait for a price breakout or a signal from On Balance Volume before having confidence in the next trend.
If price can close above 2,370 on an upwards day with an increase in volume, then the target is at 2,455. If price can close below about 2,340 on a day with stronger volume, then the target is a range of 2,282 – 2,234.
New updates to this analysis are in bold.
Last monthly and weekly charts are here. Last historic analysis video is here.
MAIN ELLIOTT WAVE COUNT
WEEKLY CHART
Click chart to enlarge.
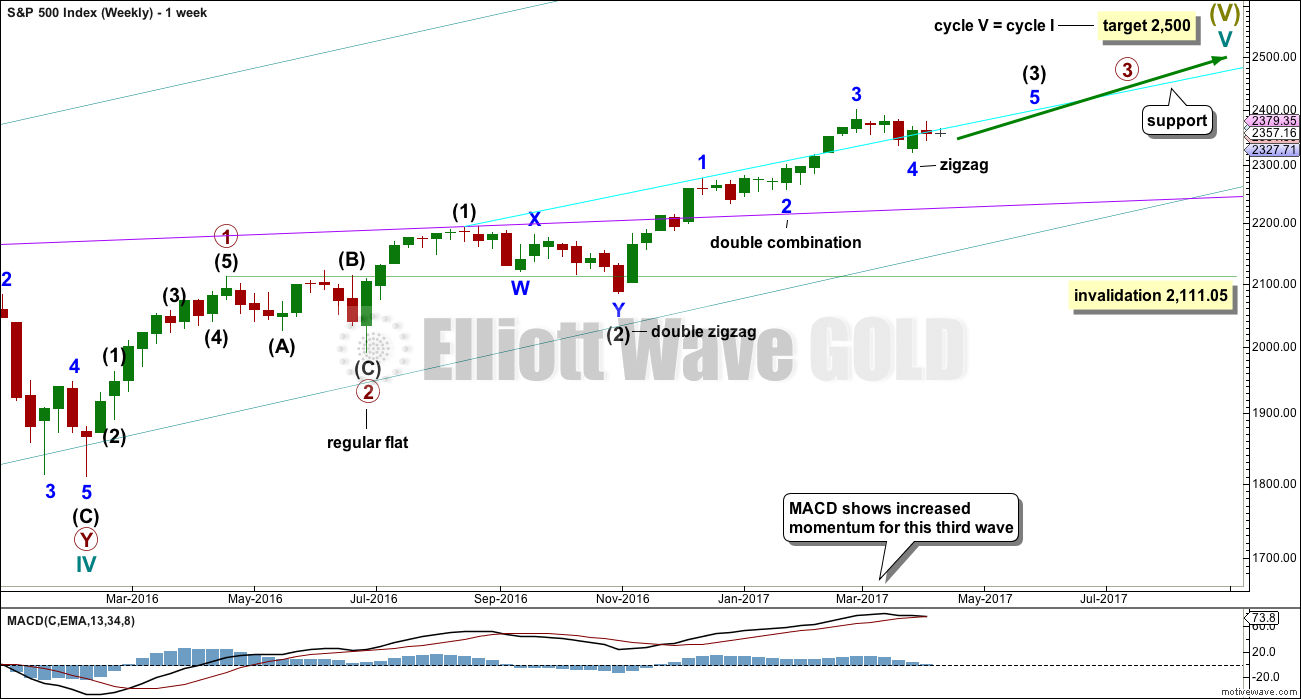
Cycle wave V is an incomplete structure. Within cycle wave V, primary wave 3 may be incomplete or it may be complete (alternate wave count below).
Primary wave 4 may not move into primary wave 1 price territory below 2,111.05.
DAILY CHART
Click chart to enlarge.
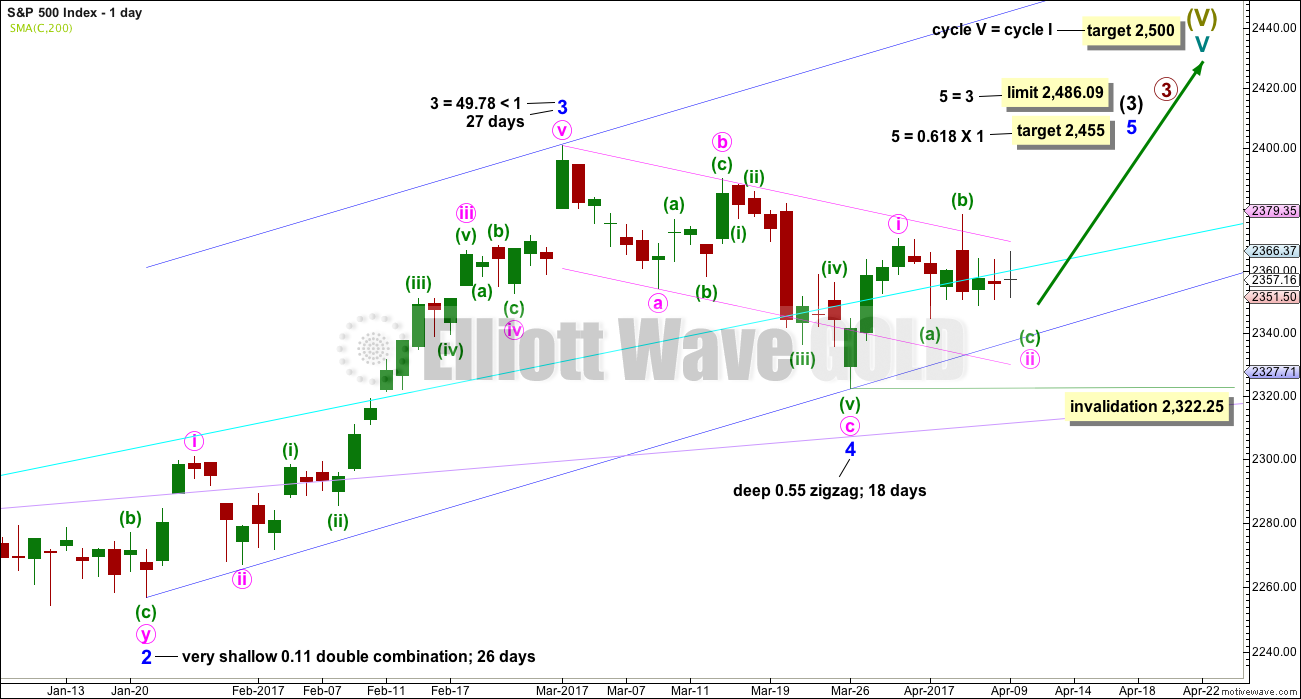
All subdivisions are seen in exactly the same way for both daily wave counts, only here the degree of labelling within intermediate wave (3) is moved down one degree.
This wave count expects the just completed correction is minor wave 4. Within minor wave 5, minute wave ii may not move beyond the start of minute wave i below 2,322.25.
Minor wave 4 is a little below the fourth wave of one lesser degree. Because it has now clearly breached an Elliott channel drawn using the first technique, the channel is now redrawn using Elliott’s second technique. There is good alternation between the very shallow combination of minor wave 2 and the deeper zigzag of minor wave 4.
A target for minor wave 5 is calculated.
The Elliott channel about minor wave 4 is drawn on the daily chart. The upper edge may be providing some resistance. Once price can break above this channel, then upwards momentum may build.
Minor wave 3 is shorter than minor wave 1. So that the core Elliott wave rule stating a third wave may not be the shortest is met, minor wave 5 is limited to no longer than equality in length with minor wave 3.
HOURLY CHART
Click chart to enlarge.
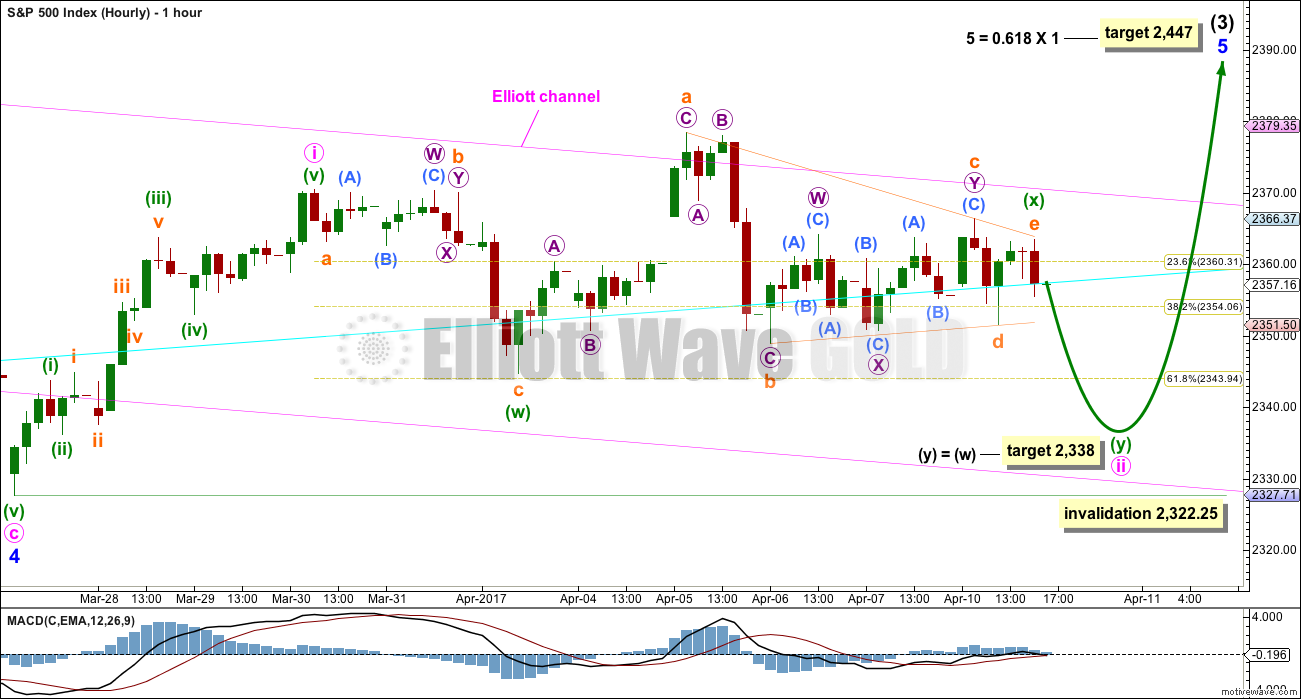
Labelling within minute wave ii is today changed.
Minute wave ii may be an incomplete double zigzag, with minuette wave (x) now a completed running contracting triangle. While part of the triangle makes a new price extreme beyond the start of minuette wave (w), at its end the triangle effects a 0.73 retracement of minuette wave (w). This is not a typical look for an X wave within a double zigzag as they are more often brief and shallow.
Minute wave ii may continue sideways as a double combination. Minuette wave (y) may be a flat correction. If this is the case, then the target would be too low.
The target for a double zigzag is almost the same as yesterday’s target.
Minute wave ii may find strong support at the lower edge of the pink Elliott channel copied over from the daily chart, if it moves below the target.
Minute wave ii may not move beyond the start of minute wave i below 2,322.25.
ALTERNATE DAILY CHART
Click chart to enlarge.
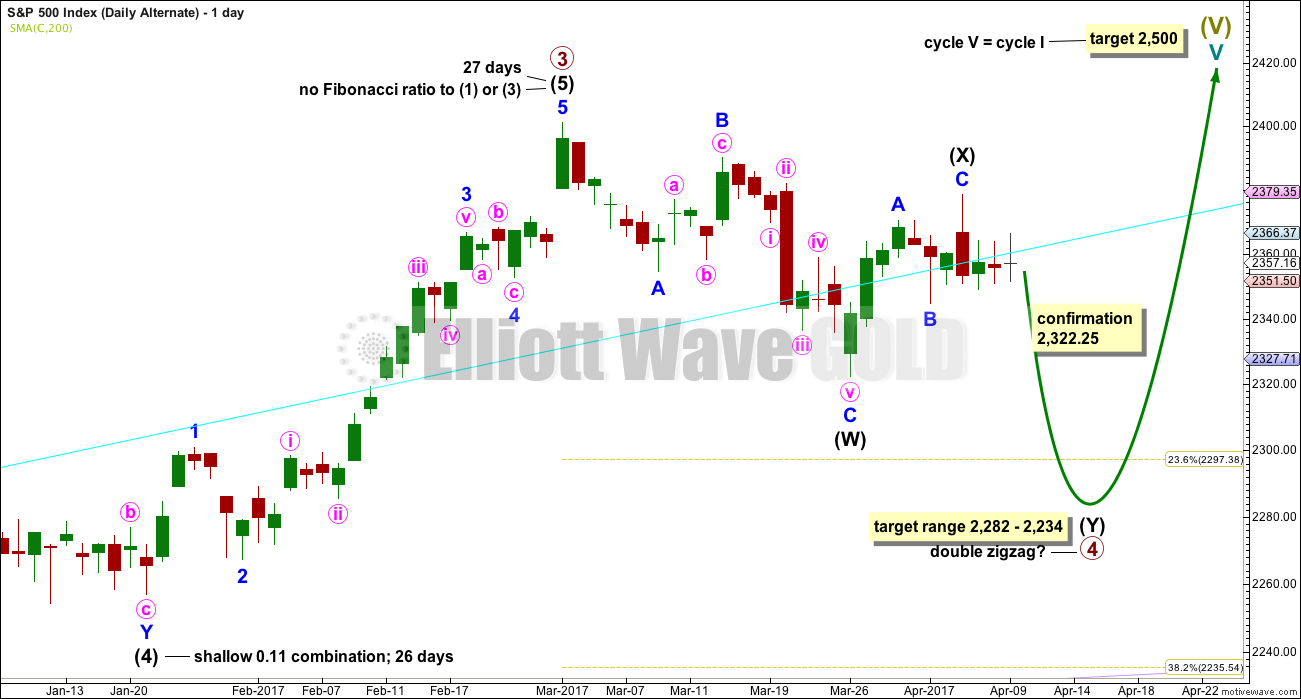
The subdivisions of upwards movement from the end of intermediate wave (2) are seen in the same way for both wave counts. The degree of labelling here is moved up one degree, so it is possible that primary wave 3 could be over.
Primary wave 2 was a flat correction lasting 47 days (not a Fibonacci number). Primary wave 4 may be unfolding as a double zigzag. It may total a Fibonacci 34 or 55 sessions.
Within double zigzags, the X wave is almost always brief and shallow. There is no rule stating a maximum for X waves, but they should not make a new price extreme beyond the start of the first zigzag in the double.
X waves within combinations may make new price extremes (they may be equivalent to B waves within expanded flats), but in this instance primary wave 4 would be unlikely to be a combination as it would exhibit poor alternation with the flat correction of primary wave 2.
For this alternate wave count intermediate wave (X) may now be complete. Both wave counts expect downwards movement: this alternate wave count to new lows for a second zigzag, which would be labelled intermediate wave (Y), and the main wave count for a brief pullback labelled minute wave ii. How low the next wave goes should indicate which wave count is correct. A new low now below 2,322.25 would see the main wave count discarded and this alternate confirmed.
If a new high above 2,400.98 is seen, then this alternate would be discarded.
The correction for primary wave 4 should be a multi week pullback, and it may not move into primary wave 1 price territory below 2,111.05.
TECHNICAL ANALYSIS
WEEKLY CHART
Click chart to enlarge. Chart courtesy of StockCharts.com.
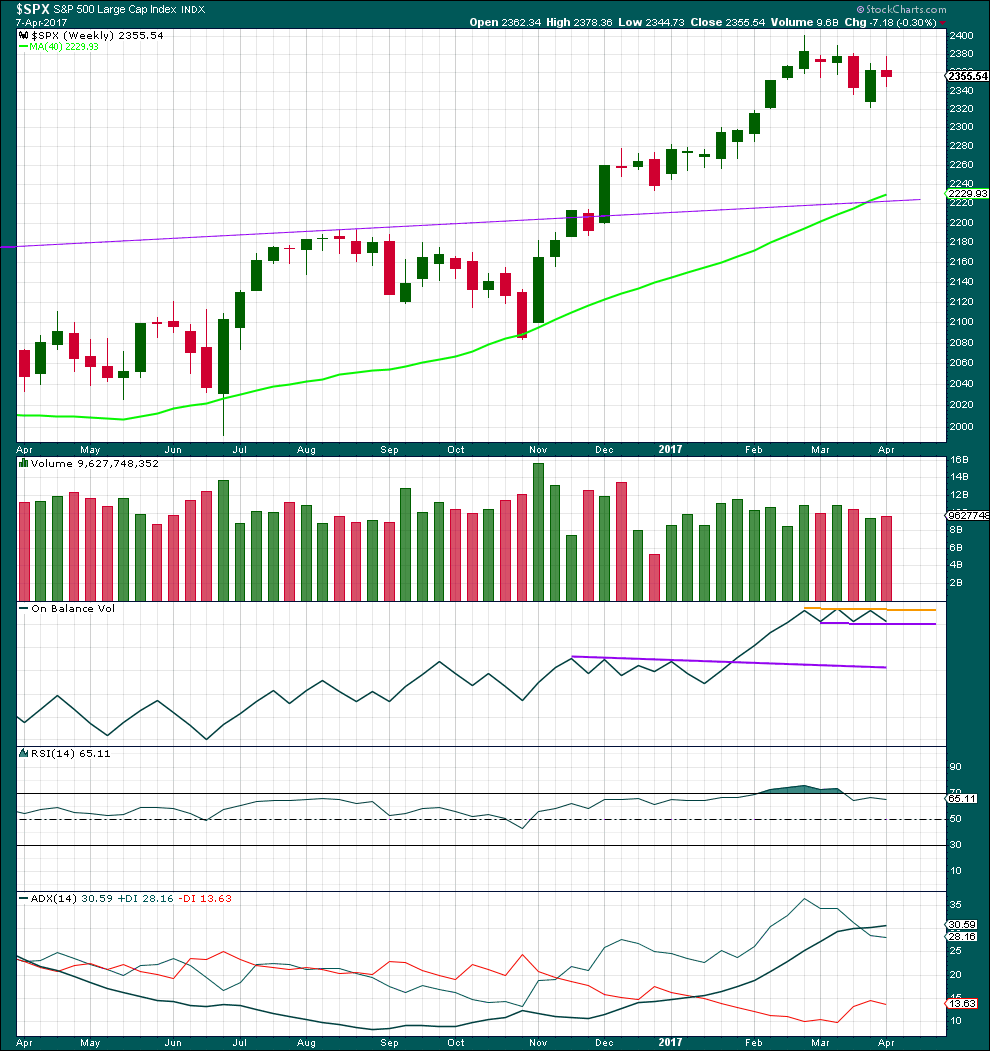
Last week completes an upwards week with a higher high and a higher low, but the week closed red and the balance of volume was down. With some increase in volume last week, the support for downwards movement during the week is bearish.
On Balance Volume remains tightly constrained, not yet offering a signal.
ADX remains extreme. This is most often followed by three or four downwards weeks, but not always. This favours the alternate daily wave count.
DAILY CHART
Click chart to enlarge. Chart courtesy of StockCharts.com.
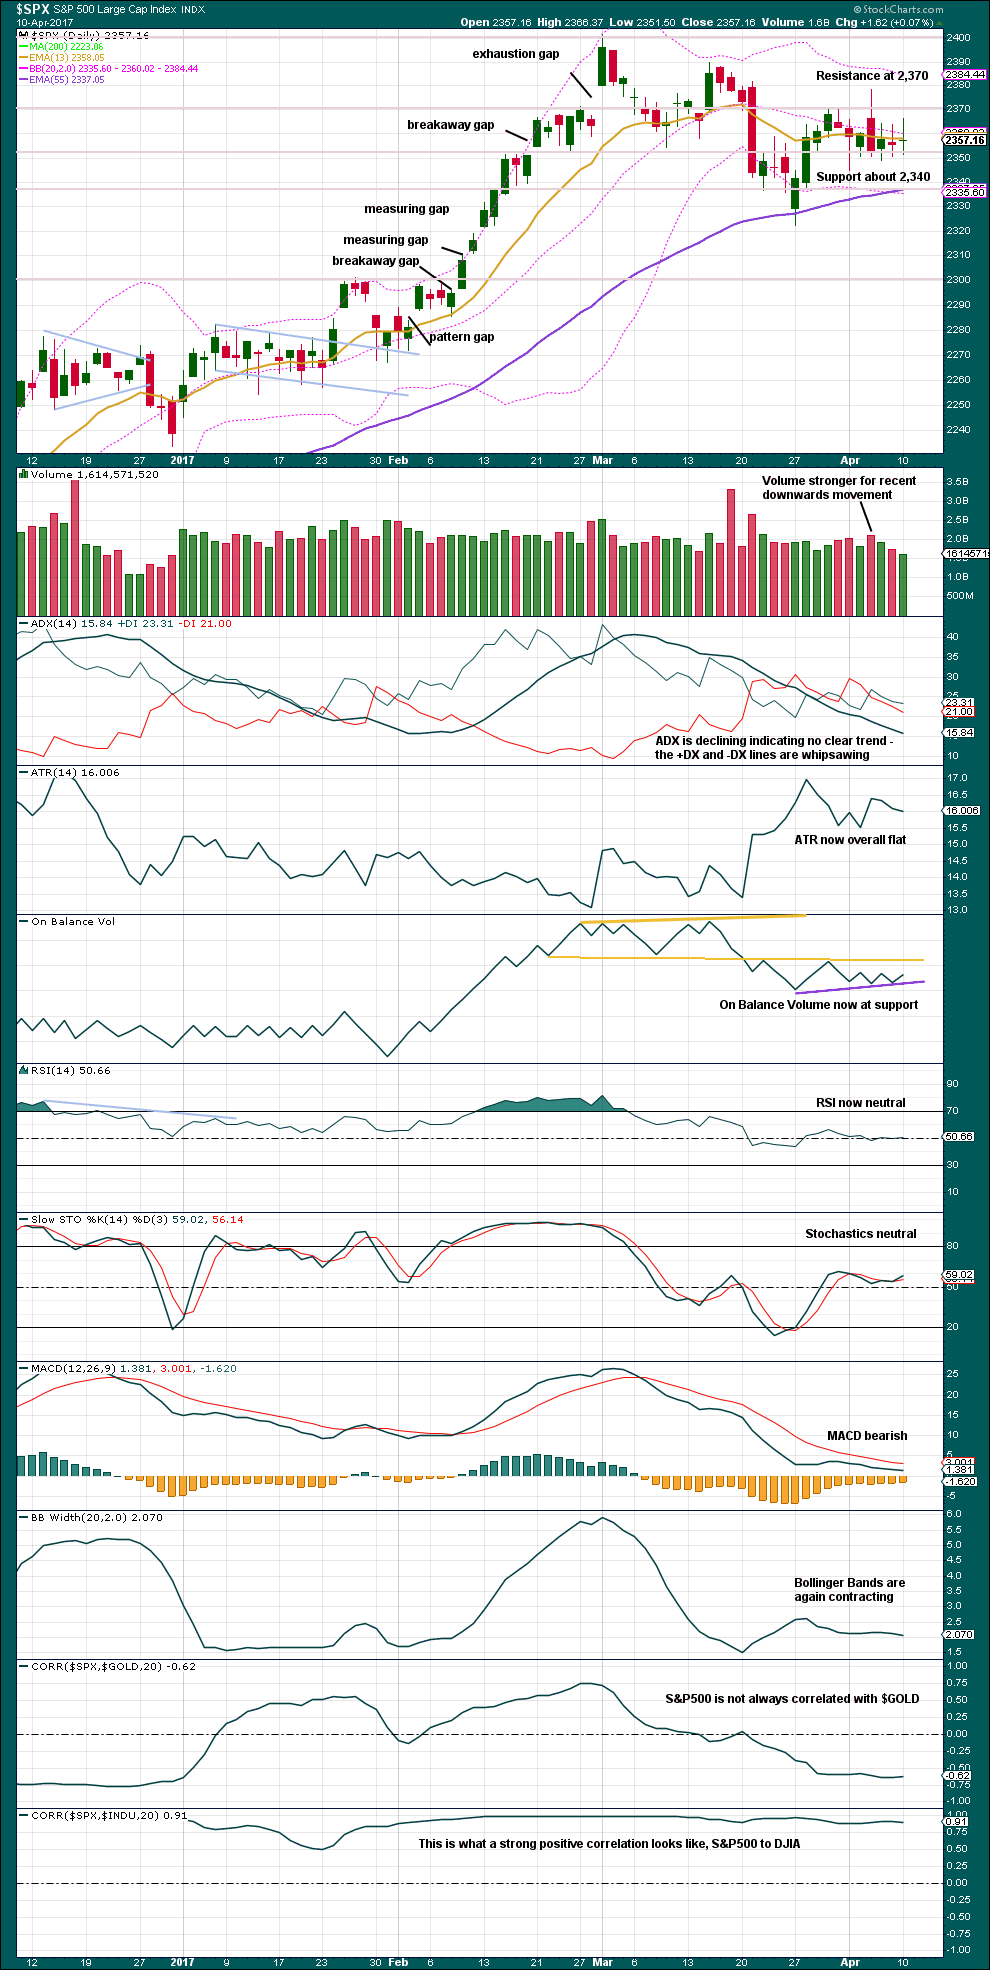
Price remains range bound with resistance about 2,370 and support about 2,340. During this range bound period it remains downwards days which have strongest volume, suggesting a downwards breakout is more likely than upwards.
Bollinger Bands, ADX and ATR agree that price is consolidating.
On Balance Volume at the daily chart level has not yet given a new signal. It is at the new support line while price consolidates. On Balance Volume is also range bound.
RSI and Stochastics are both neutral.
MACD and volume are bearish.
Overall, this analysis is neutral to bearish. It offers a little more support to the alternate Elliott wave count than the main Elliott wave count. The bottom line is price or On Balance Volume need to break out and present a signal before confidence may be had in the next direction for a trend.
VOLATILITY – INVERTED VIX CHART
Click chart to enlarge. Chart courtesy of StockCharts.com.
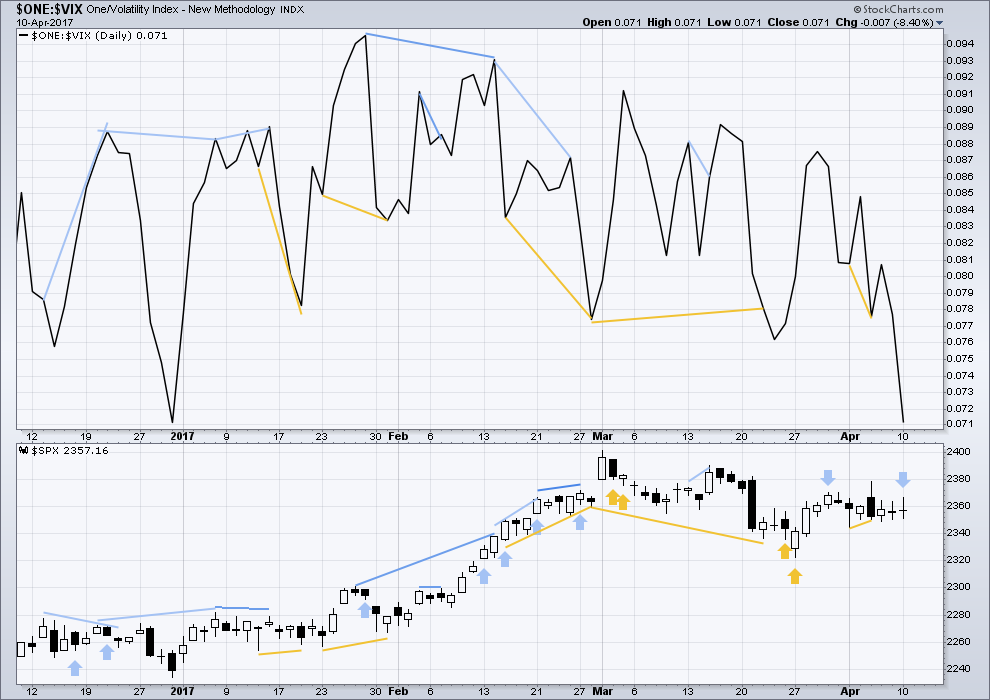
Normally, volatility should decline as price moves higher and increase as price moves lower. This means that normally inverted VIX should move in the same direction as price.
Bearish divergence and bullish divergence spanning a few short days used to be a fairly reliable indicator of the next one or two days direction for price; normally, bearish divergence would be followed by one or two days of downwards movement and vice versa for bullish divergence.
However, what once worked does not necessarily have to continue to work. Markets and market conditions change. We have to be flexible and change with them.
Recent unusual, and sometimes very strong, single day divergence between price and inverted VIX is noted with arrows on the price chart. Members can see that this is not always proving useful in predicting the next direction for price.
Divergence will continue to be noted, particularly when it is strong, but at this time it will be given little weight in this analysis. If it proves to again begin to work fairly consistently, then it will again be given weight.
There is strong single day divergence today with price and inverted VIX. Price today made a higher high and a higher low, the definition of upwards movement, even though it closed neutral. However, inverted VIX shows volatility strongly increased while price moved slightly higher. This indicates weakness within price and is interpreted as bearish. It will be given a little weight today because it is so strong.
BREADTH – AD LINE
Click chart to enlarge. Chart courtesy of StockCharts.com.
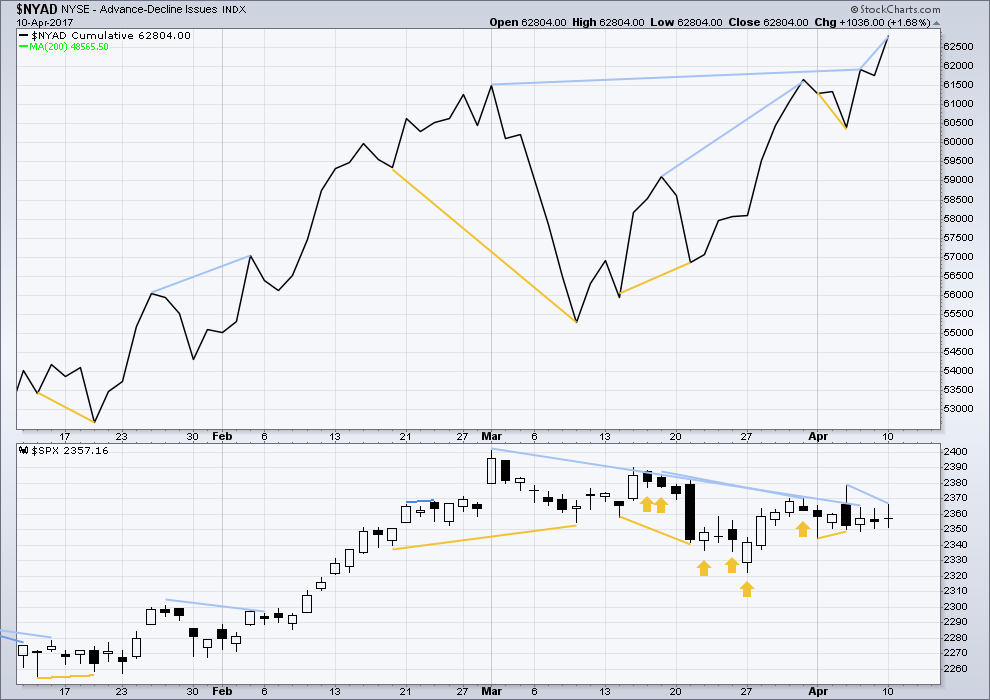
The rise in price has support from a rise in market breadth. Lowry’s measures of market breadth do not at this stage warn of an impending end to this bull market. They show an internally healthy bull market that should continue for at least 4-6 months.
There is new short term bearish divergence today with price and the AD line: the AD line made a new high above its prior high of the 6th of April, but price has failed to make a corresponding new high. This divergence indicates weakness within upwards movement from price; it is bearish.
DOW THEORY
The DJIA, DJT, S&P500 and Nasdaq continue to make new all time highs. This confirms a bull market continues.
This analysis is published @ 10:40 p.m. EST.
I’m going to expect subminuette b to last longer. B waves usually do.
Then I’ll calculate a new target down for subminuette c. The target provided in this analysis has already been met, but the structure of minuette (y) is incomplete. It needs another wave down for subminuette c.
I just had a good laugh that I just have to pass on. I heard an audio of Justice Ginsburg talking about the “Women of the Senate, Senator Diane Feinstein and Lindsey Graham…”
I just about died with laughter. Some of you will know why that is so hysterically funny!
Funny. Funny. Funny. At age 84 years, I’ll give her a mulligan. But it is time for her to move on to new pastures. I wonder what Senator Graham thinks of her comment. Thanks for the smiles.
She….er, I mean he might not object too strenuously! 😀
I think she nailed it!
Are you watching Bells? Gorgeous waves coming through the bowl!!!
Oh yes, have it on all the time on Cesar’s laptop 🙂
I could be wrong about this but I am going to say it anyway. The cretins in the bankster cartel have completely broken this market. This protracted battle around this support shelf around 2350 should have ended long ago with the correction completed and price on the way up in a new sustainable up-trend. Despite the ridiculous amount of money they have spent trying to keep prices in this area I think it will eventually fall away from it and it will then become formidable resistance. We are probably going to see a scary plunge in the index before this all said and done, and hopefully that is all we will see…take care everyone!
I don’t think you’re wrong, but I do think there’s another way to look at it.
Approaching a trend change at Grand Super Cycle degree (once in generations) the market should change. The situation should be extreme, and it should be and feel unprecedented for current players.
All we have known in our lifetimes is a bull market, with short bear markets interspersed. The generation that lived through the Great Depression is mostly passed, and their intimate knowledge of what life was like then has passed too. It’s in history books, but from watching human behaviour (in terms of global foreign policy of nations) we don’t learn from history, I suspect relatively few of us read it.
So IMO at this point in time this market is behaving exactly as it should.
After the massive trend change and huge bear market, then things will begin to resolve. It will become more predictable. At that stage expect revulsion towards markets from almost all players, and that will be exactly the time to invest heavily in companies that survive, for long term profits.
Well said Lara!
Great perspective Lara! Thanks for the input. You are quite right that none of us has traded a market at this historical juncture so we should not be surprised by market characteristics that are new.
I am curious about today’s seeming extreme price move in VIX without a corresponding price extreme in the indices. There is something very strange about this and it frankly has me quite puzzled. I reviewed a few charts and even at the start of an extended run higher (several days), VIX can partially penetrate and even stay pinned to its upper BB. A full candlestick body above the upper BB is usually what happens at the very end of a corrective move. We could see the downward move end or at least take a pause tomorrow.
Looking like a hammer underway. I am thinking the possible B wave is not complete and we have another leg up before a C wave down. After the extended time of compressed volatility it seems unlikely that the tepid decline we have so far seen has done much to return to anything remotely like the mean. I think the March 27 lows need to be taken out before we get a bottom we can trade with confidence…just my two pence… 🙂
Verne, I’m sure you recall the triangle that formed July/August 2015. I do believe this action is it’s corollary; especially if we are to see a true wave 4 down. My target range is 2190-2230 if the wave down is to materialize. An interestingly large amount of shorts have built in Russell futures, and I don’t believe they can be led to panic cover this time….
Yep. The price action is remarkably similar. I think you are right on the money about the intimidation. I noticed last Friday for the first time the predictable 10.00 a.m. VIX smackdown was summarily rejected with VIX continuing higher. I think that beast still has a frighful amount of potential, pent-up energy and I don’t think this upper BB penetration today means what it would normally. Small caps have a really obvious H&S topping pattern and Ithink it is just a matter of time beofore we see that play out. I also agree with your SPX target and think around DJI 19,960.00 is also needed before any sustainable up-trend can resume. Some folk are saying if we break DJI 20K that its all over but I think we have at least one more pop to the upside…time will tell…
The shocking thing is it’s all much ado about 5-7%. You know the market is broken when we are all over analyzing a potential move of such puny magnitude. 🙂
Ordinarily a VIX move above its upper BB would be reversal signal.. This marker however is so screwed up you simply cannot count on things working the way they used to. Despite the move up in VIX, I am moving to the sidelines until we get a clearer picture of what may be ahead…
You got that right. Our reliable signals have not been working including penetration of BB. However, they are still clues worth watching and you cannot get hurt on the sidelines.
Selling to close DIA 206 puts for 1.86
Interesting that SPX is down 7 at the moment off is low for the day. But IWM is positive, up .30% for the day.
We have also broken through the 50 day ema on the SPX. This is an important line in the sand.
Correction, at the time I wrote the above comment it should have said “broken through the 50 day ma.” Not ema.
Currently, we are in between the two. If SPX closes below both of these, it would appear as though the bears are in full control.
Keeping a close eye on 13 dma as well. Right now resting right on top of 50 dma and it will either bounce off it or break below if P4 in play…real uncertainty in the market now and well worth waiting for clarity…
IWM has a long way to fall. It is completely divorced from reality at these level. It could be putting in some kind of H&S top…
go VIX!!! trimmed some vix calls
A primary degree correction should decisively breach the 50 dma. It looks as if that pivot is being furiously defended. If we are in primary four the signal of the start of the final move down will come with a strong breach of that line, and I would expect co-incide with the beginning of a capitulation spike in the VIX.
The chart is from Northman Trader.
Interestingly, nobody has staked out this position yet. First, even though it’s so late.