A breakout was expected for Friday but did not happen. An inside day was completed. Price remains range bound for this market.
Summary: The main wave count expects an upwards breakout. The alternate expects a downwards breakout. There is a little more support for the alternate at this time, but not enough for reasonable confidence.
Because the picture is reasonably neutral, it would be my advice at this time to wait for a price breakout or a signal from On Balance Volume before having confidence in the next trend.
If price can close above 2,370 on an upwards day with an increase in volume, then the target is at 2,455. If price can close below about 2,340 on a day with stronger volume, then the target is a range of 2,282 – 2,234.
New updates to this analysis are in bold.
Last monthly and weekly charts are here. Last historic analysis video is here.
MAIN ELLIOTT WAVE COUNT
WEEKLY CHART
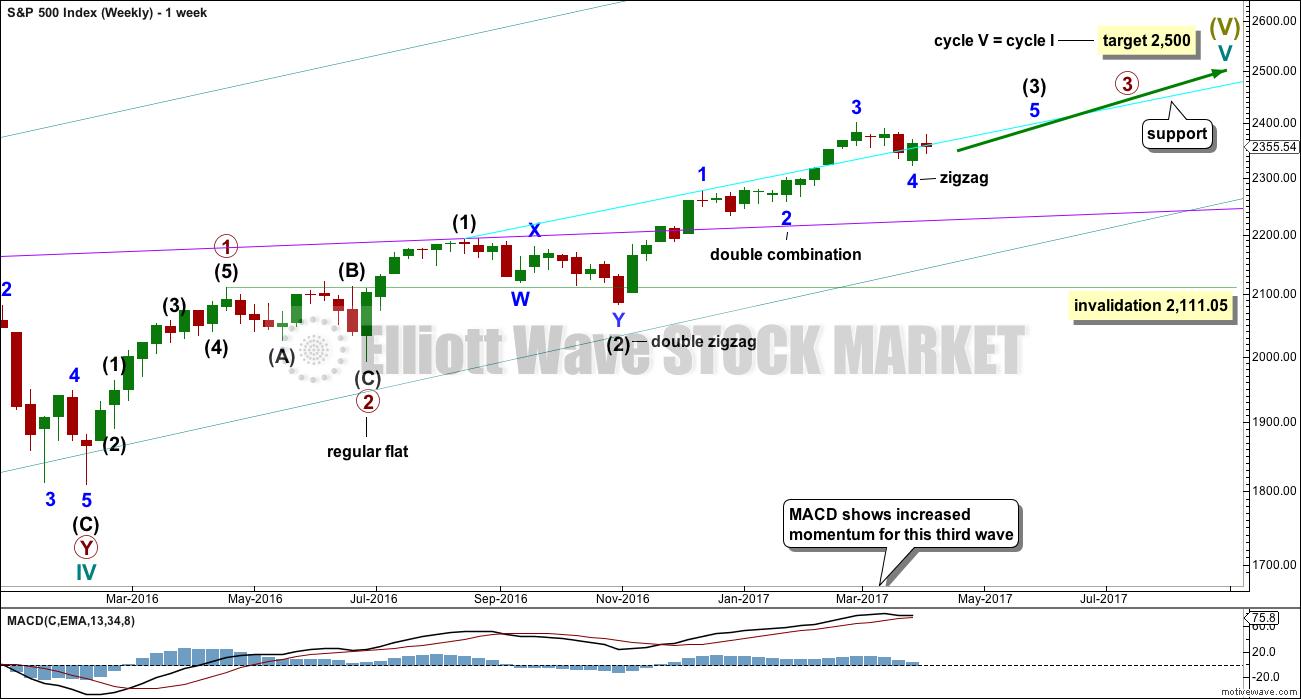
Cycle wave V is an incomplete structure. Within cycle wave V, primary wave 3 may be incomplete or it may be complete (alternate wave count below).
Primary wave 4 may not move into primary wave 1 price territory below 2,111.05.
DAILY CHART
All subdivisions are seen in exactly the same way for both daily wave counts, only here the degree of labelling within intermediate wave (3) is moved down one degree.
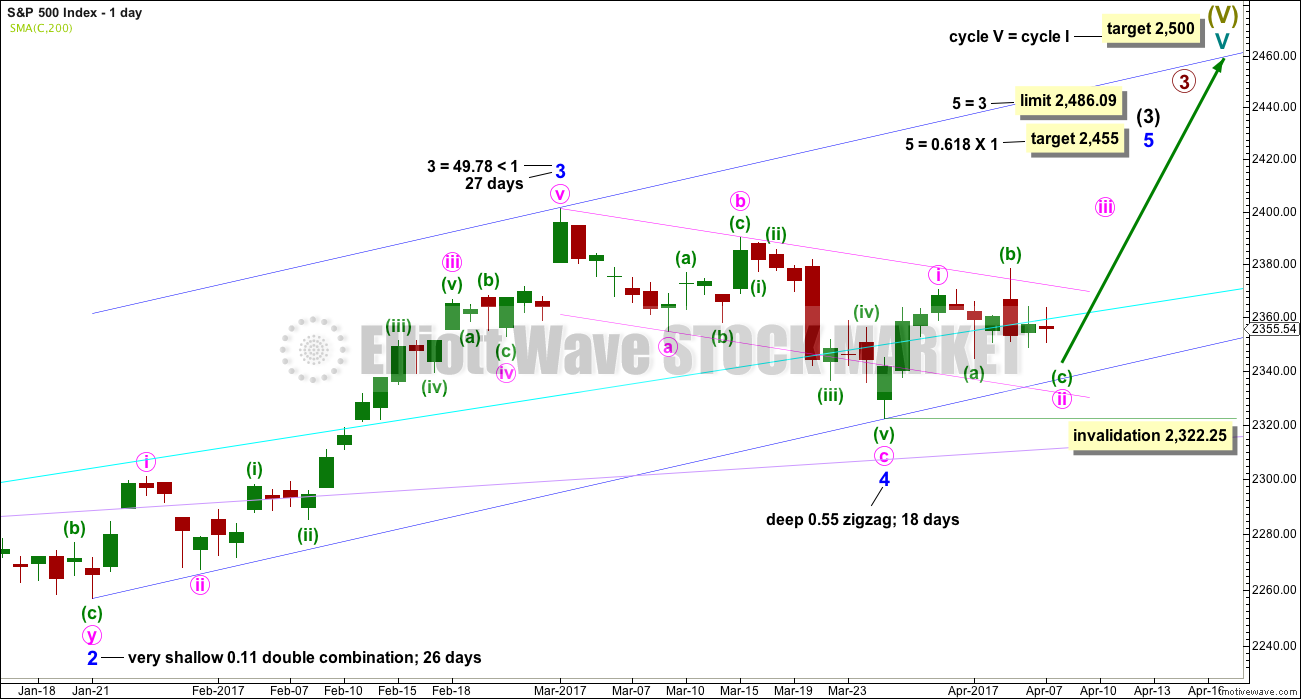
This wave count expects the just completed correction is minor wave 4. Within minor wave 5, minute wave ii may not move beyond the start of minute wave i below 2,322.25.
Minor wave 4 is a little below the fourth wave of one lesser degree. Because it has now clearly breached an Elliott channel drawn using the first technique, the channel is now redrawn using Elliott’s second technique. There is good alternation between the very shallow combination of minor wave 2 and the deeper zigzag of minor wave 4.
A target for minor wave 5 is calculated.
The Elliott channel about minor wave 4 is drawn on the daily chart. The upper edge may be providing some resistance. Once price can break above this channel, then upwards momentum may build.
Minor wave 3 is shorter than minor wave 1. So that the core Elliott wave rule stating a third wave may not be the shortest is met, minor wave 5 is limited to no longer than equality in length with minor wave 3.
HOURLY CHART
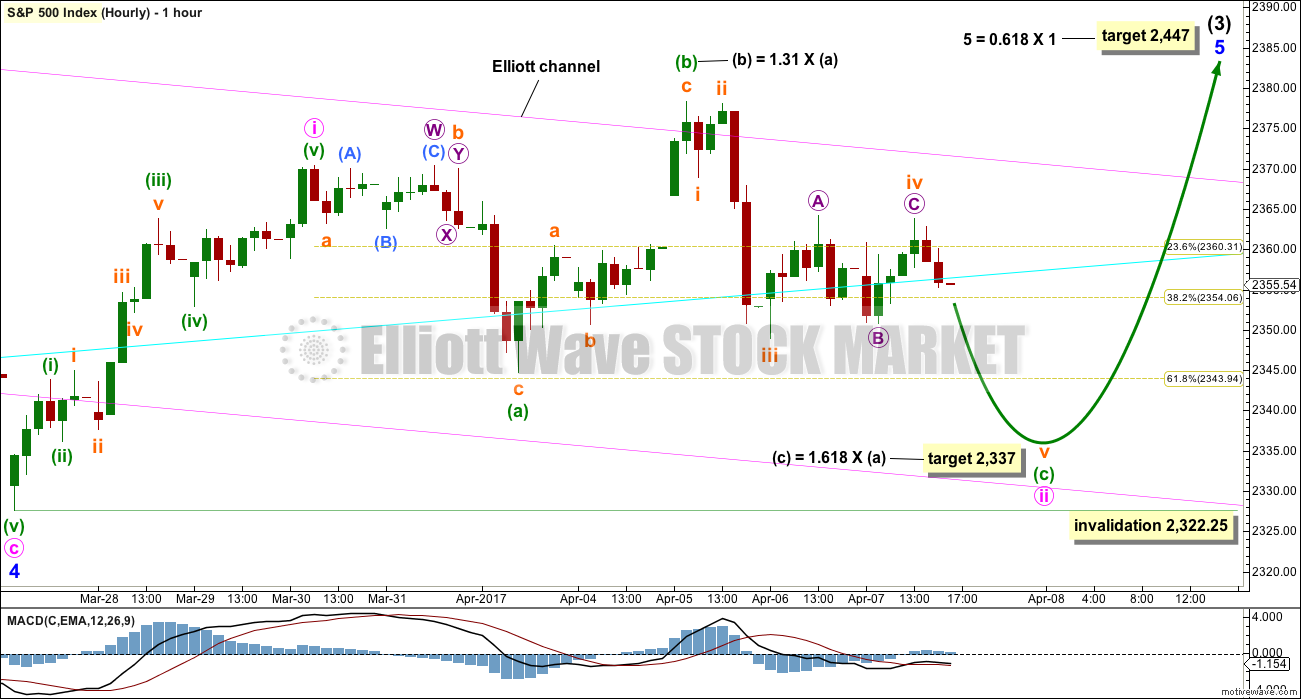
Minute wave ii may be an incomplete expanded flat correction. Within minute wave ii, minuette wave (c) must complete as a five wave structure. At this stage, it may be an almost complete impulse.
Minuette wave (c) would be extremely likely to make at least a slight new low below minuette wave (a) at 2,344.73 to avoid a truncation and a very rare running flat. The target expects the most common Fibonacci ratio to minuette wave (a), so it has a reasonable probability.
Sideways movement for Friday’s session may have been a continuation of subminuette wave iv. It may be a complete zigzag as labelled, or it may continue further to complete as a triangle.
Minute wave i lasted a Fibonacci three days. So far minute wave ii has lasted six days. If it continues for another two days, it may complete in a total Fibonacci eight.
At this stage, the upper edge of the pink Elliott channel may be providing enough resistance to hold down price. Once this channel is properly breached, then upwards momentum may build.
Minute wave ii may not move beyond the start of minute wave i at 2,322.25. A new low by any amount at any time frame below this point would see the main wave count invalidated and the alternate daily wave count below as the only wave count.
ALTERNATE DAILY CHART
The subdivisions of upwards movement from the end of intermediate wave (2) are seen in the same way for both wave counts. The degree of labelling here is moved up one degree, so it is possible that primary wave 3 could be over.
Primary wave 2 was a flat correction lasting 47 days (not a Fibonacci number). Primary wave 4 may be unfolding as a double zigzag. It may total a Fibonacci 34 or 55 sessions.
Within double zigzags, the X wave is almost always brief and shallow. There is no rule stating a maximum for X waves, but they should not make a new price extreme beyond the start of the first zigzag in the double.
X waves within combinations may make new price extremes (they may be equivalent to B waves within expanded flats), but in this instance primary wave 4 would be unlikely to be a combination as it would exhibit poor alternation with the flat correction of primary wave 2.
For this alternate wave count intermediate wave (X) may now be complete. Both wave counts expect downwards movement: this alternate wave count to new lows for a second zigzag, which would be labelled intermediate wave (Y), and the main wave count for a brief pullback labelled minute wave ii. How low the next wave goes should indicate which wave count is correct. A new low now below 2,322.25 would see the main wave count discarded and this alternate confirmed.
If a new high above 2,400.98 is seen, then this alternate would be discarded.
The correction for primary wave 4 should be a multi week pullback, and it may not move into primary wave 1 price territory below 2,111.05.
TECHNICAL ANALYSIS
WEEKLY CHART
Click chart to enlarge. Chart courtesy of StockCharts.com.
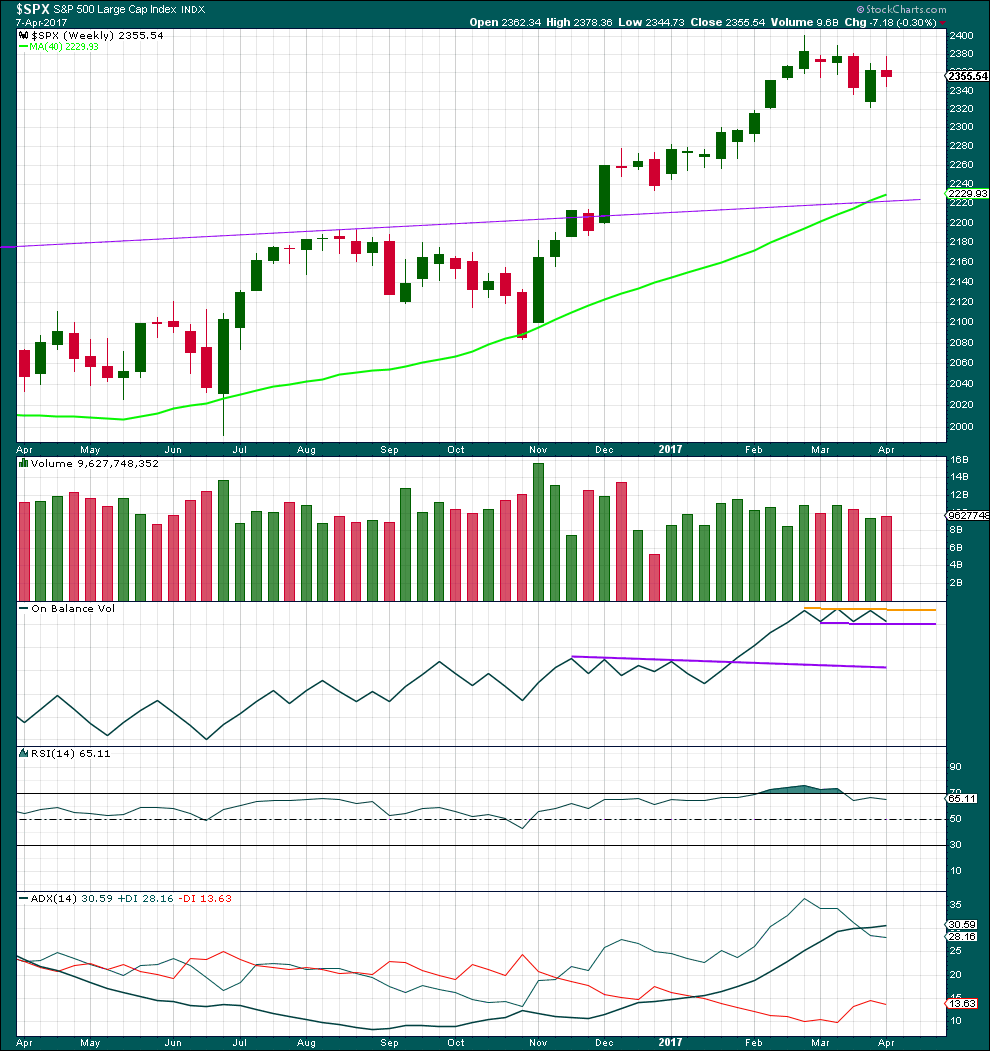
This week completes an upwards week with a higher high and a higher low, but the week closed red and the balance of volume was down. With some increase in volume this week, the support for downwards movement during the week is bearish.
On Balance Volume remains tightly constrained, not yet offering a signal.
ADX remains extreme. This is most often followed by three or four downwards weeks, but not always. This favours the alternate daily wave count.
DAILY CHART
Click chart to enlarge. Chart courtesy of StockCharts.com.
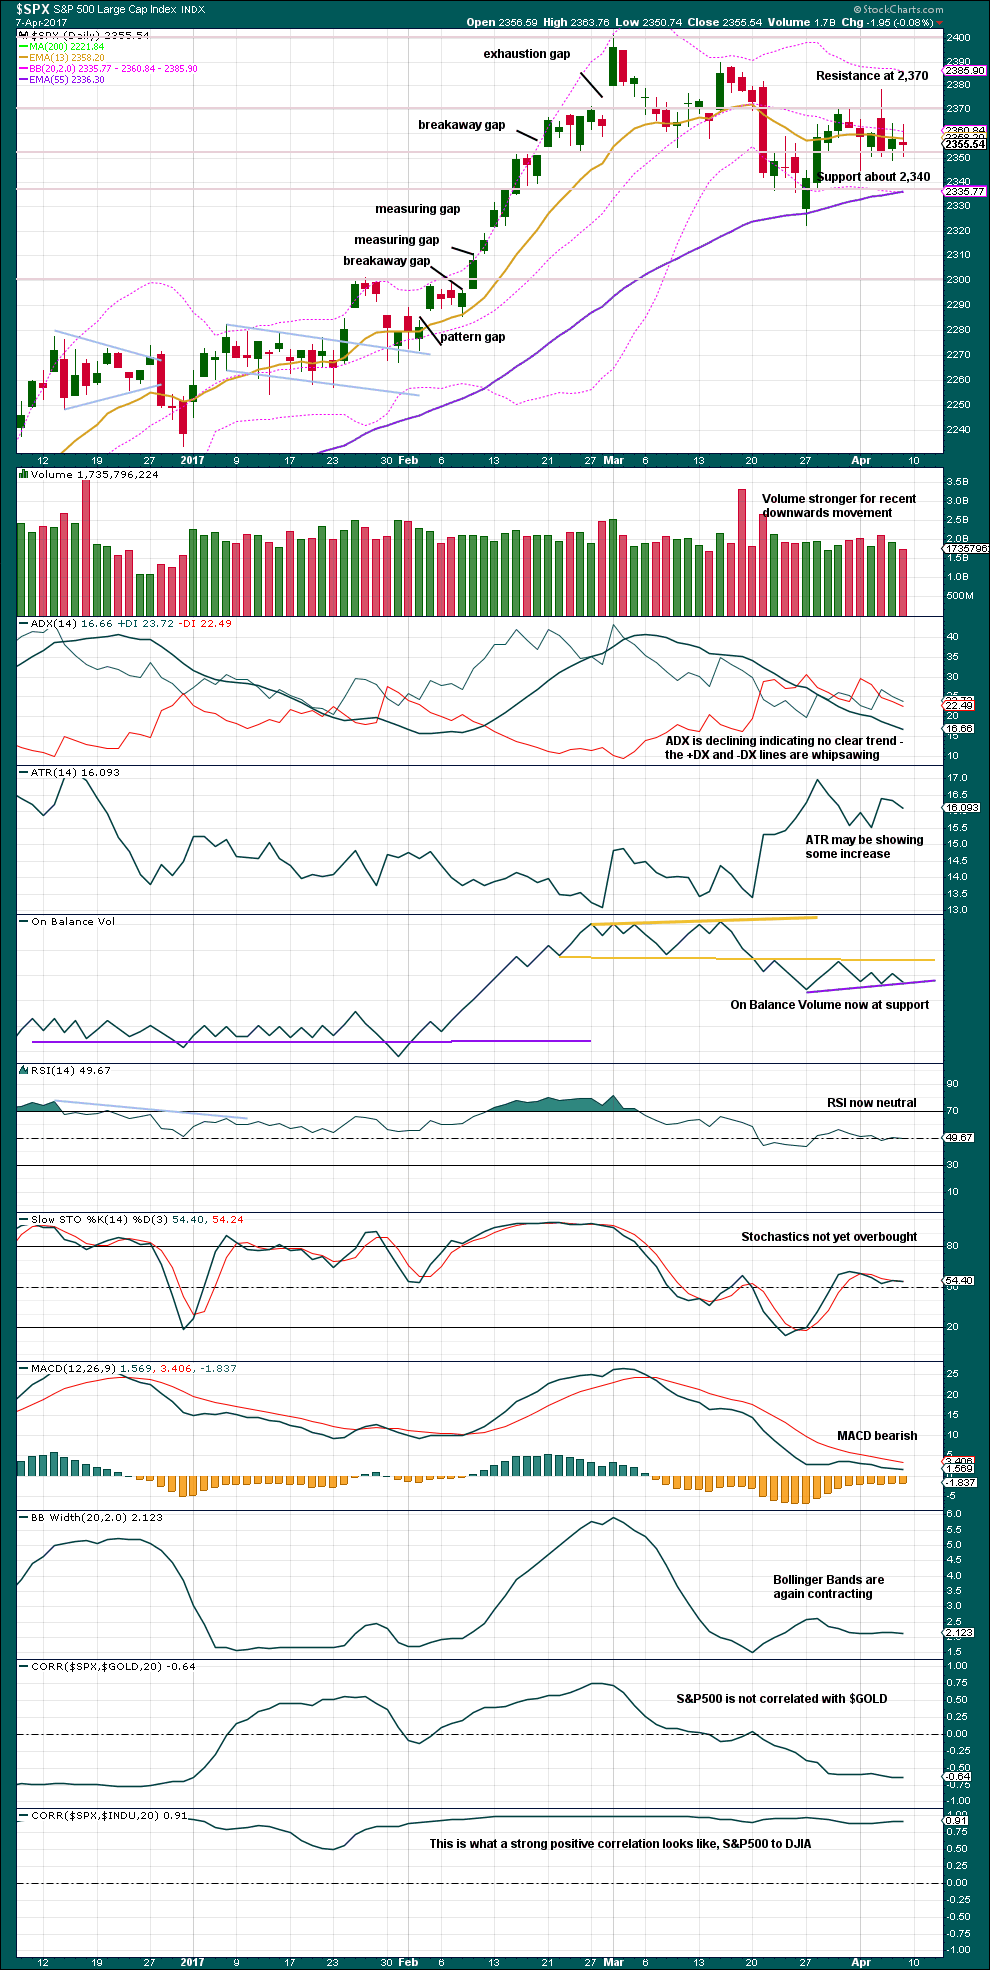
Price remains range bound with resistance about 2,370 and support about 2,340. During this range bound period it remains downwards days which have strongest volume, suggesting a downwards breakout is more likely than upwards.
ADX and ATR mostly agree that price is consolidating.
On Balance Volume at the daily chart level has not yet given a new signal. It is at the new support line while price consolidates. On Balance Volume is also range bound.
RSI and Stochastics are both neutral.
MACD and volume are bearish.
Overall, this analysis is neutral to bearish. It offers a little more support to the alternate Elliott wave count than the main Elliott wave count. The bottom line is price or On Balance Volume need to break out and present a signal before confidence may be had in the next direction for a trend.
VOLATILITY – INVERTED VIX CHART
Click chart to enlarge. Chart courtesy of StockCharts.com.
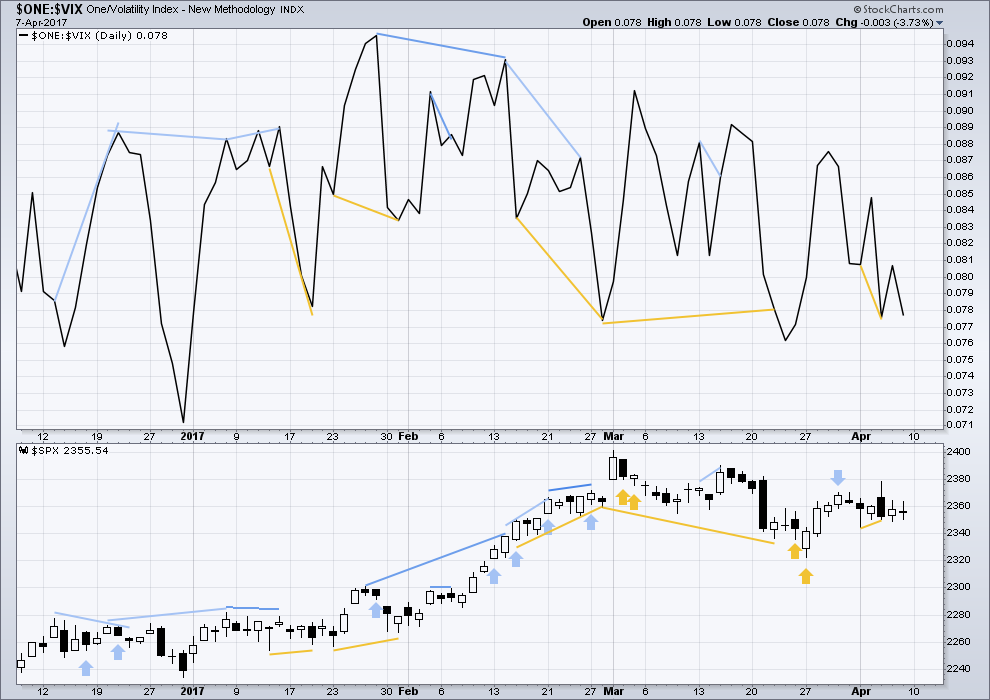
Normally, volatility should decline as price moves higher and increase as price moves lower. This means that normally inverted VIX should move in the same direction as price.
Bearish divergence and bullish divergence spanning a few short days used to be a fairly reliable indicator of the next one or two days direction for price; normally, bearish divergence would be followed by one or two days of downwards movement and vice versa for bullish divergence.
However, what once worked does not necessarily have to continue to work. Markets and market conditions change. We have to be flexible and change with them.
Recent unusual, and sometimes very strong, single day divergence between price and inverted VIX is noted with arrows on the price chart. Members can see that this is not proving useful in predicting the next direction for price.
Divergence will continue to be noted, particularly when it is strong, but at this time it will be given little weight in this analysis. If it proves to again begin to work fairly consistently, then it will again be given weight.
Short term bullish divergence noted remains. So far this has not been followed by upwards movement, but it may still be.
BREADTH – AD LINE
Click chart to enlarge. Chart courtesy of StockCharts.com.
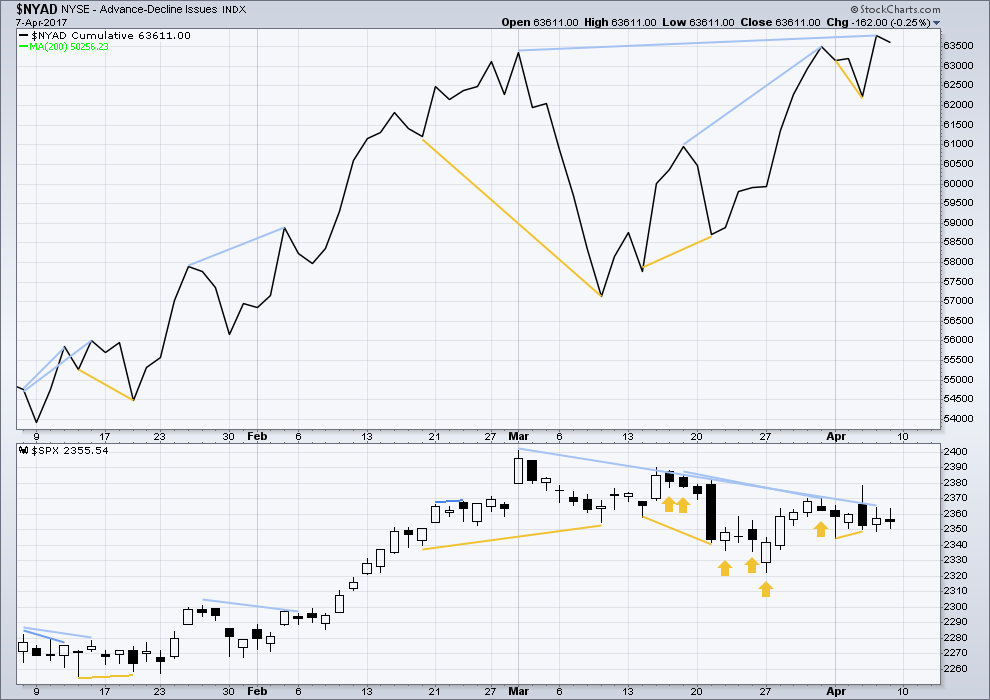
The rise in price has support from a rise in market breadth. Lowry’s measures of market breadth do not at this stage warn of an impending end to this bull market. They show an internally healthy bull market that should continue for at least 4-6 months.
Short term bullish divergence remains, as does mid term bearish divergence. With short term divergence more reliable than mid term divergence lately, it will be given more weight. It supports the main daily wave count.
DOW THEORY
The DJIA, DJT, S&P500 and Nasdaq continue to make new all time highs. This confirms a bull market continues.
This analysis is published @ 03:25 a.m. EST on 9th April, 2017.


According to the charts I am viewing, the SPX weekly MACD shows a bearish crossover. This is not an indicator to use by itself. But it is one among many that the trader is wise to monitor. This supports Lara’s alternate count. I am still SOH.
Why yes, it does.
Yes, that supports the alternate for sure.
Yep. Along with the fact that VIX is rising with price they paint a near-term bearish portrait. The chart looks to me like a big abc zig zag that is not yet done with a c wave down yet to come. I just got done reading the very best treatment I have seen on how algo trading is affecting the market and it was remarkably insightful. It really explains a lot of the price action we have been seeing and also has some very interesting implications. The trading bots of late have pretty much been chasing their own tails The bottom line is the bots have been programmed to trade any put/call ratio that deviates from unity hence the eerie disappearance of volatility from the market. This also underscores how few live players there are also. Weird!! All you can do in this environment is buy the dips and sell the rips, which are going to become increasingly violent…last Friday VIX gave the banksters the finger when they came in with the typical 10.00 am smackdown and continued higher…shot across the bow…
hourly chart updated
sorry it’s a bit late folks, the end of daylight savings has me a bit confused regarding time here in New Zealand. I think I’ve figured it out and should be good from tomorrow.
I don’t like the disproportion here between subminuette waves ii and iv, but then the S&P just doesn’t always have neat looking waves. Will be looking for an alternate idea….
Something going on, and I don’t think it has anything to do with the Yellen speech at 4pm.
Looking for 2337 and then test of 2322. Although I could see a bounce into end of Thursday (Friday holiday).
What if…all the Trump gains since 2100 are in play over the next few weeks???
Volatility looking berry berry good.
Are you volatilized?
If not, why on earth not?
Grab that ten-bagger people! 🙂
Have a great evening all!
good call verne. closing above 200dma should spook some longs. 15 tomorrow possible in vix (as long as we close above 13.5
It is being reported that China now has 150k troops on N. Korean border.
That has always been the thing that absolutely terrifies the Chinese. A stampede into their country in the event of the collapse of DPRK.
They must be expecting trouble.
VIX and market price divergence continues. It seems as if they have given up trying to smash VIX and are not fully engaged in propping the index. A close above 13.25 could see some leveraged longs unwind overnight and that ought to be interesting!
I am praying for our President that he find the strength to resist the blood-thirsty lying, warmongering cretins now surrounding him. I am intensely curious to find out exactly what leverage they are now excrcising over him. There is absolutely no way that Trump is so incredibly daft as to think that Assad would have been so doltish as to put a gun to his head and pull the trigger by using chemical weapons on his own people. It is incredibly painful for me to listen to so many clueless people talking so much hogwash about this. How is it possible that we could have such short memories about the reporting of Semour Hersh’s reporting, as well as the UN’s own investigators, on this exact same incident that took place in 2013 which showed conclusively it was the local rebels that were responsible? I just don’t get it folk. OK now I will shut up about this. It is really all too sad! 🙁
Verne,
Northmantrader had a really good article yesterday regarding trump and war and what is happening. Not sure if you read it
I did. Thanks for the reference. I was reading an article recently about the state of the American public and it concluded that much of our intellectual and cognitive stupor comes from a lack of reading. Interesting. Francis Bacon was right, and we are so NOT ready!!
War cycles are near peaking Verne, nothing we can do about it….Humans will never evolve and will forever repeat history
I am afraid you are right Chris. Cycles showing times of intensifying conflict, both global and civil, directly ahead. I am wondering if we are going to survive it….
This bounce should end at about 2357.54 followed by a some serious droopage…(As Tim Kinght would say) 🙂
Sold UVXY 18.00 strike calls for 1.10…holding DIA and DDS puts….
Awesome! A nice gain for an hour and a half trading period.
A close for VIX above the 13.25 area means all the leveraged longs will be forced to either hedge or unwind. Whatever they do will happen after the close and we could get a gap down tomorrow. Of course they are not worried…the dependable banksters will step right up and eventually put a floor under any developing decline- they always do, don’t they? 🙂
It will be interesting to see how long they wait and if we get a capitulation spike in VIX. We have not seen one for quite some time. The problem here is that there are no short sellers in the market and they are going to have to step in quickly or the fall will be steep with none of the usual braking mechanism due to short covering.
They are going to have to keep VIX from reclaiming its 200 dma. If it does, all the risk mangers are going to have to say a little something about that record margin debt…or are they now too stupid to care?
Buying UVXY 18.00 strike calls expiring this Thursday for 0.73
Took assignment this week-end of 17.50 calls when UVXY closed at exactly 17.50…wassup with that?? 🙂
Buying to open April 21 DIA 206 strike puts for 0.88
Buying April 21 52.50 strike DDS puts for 1.50
Looks like both coasts are going to be pumping! Post some picks and get shacked!
Numero uno.