
Again, upwards movement was expected. The session closed green although it completed with a lower low and a lower high, the definition of downwards movement. Price remains range bound between resistance at about 2,370 and support at about 2,340. The breakout will probably come tomorrow during Non Farm Payroll data release.
Summary: If the main wave count is correct, then tomorrow price should break above resistance at 2,370. The hourly wave count expects to begin with some downwards movement to 2,337 before a trend change.
Reduce position size at this time to only 1-3% of equity due to bearishness in classic analysis.
There is still reasonable concern from classic technical analysis for the main Elliott wave count. ADX at the weekly chart level indicates now the trend is extreme. This is most commonly (not always) followed by a few weeks of downwards movement. On Balance Volume at the daily chart level gives a bearish signal.
The alternate wave count is possible.
New updates to this analysis are in bold.
Last monthly and weekly charts are here. Last historic analysis video is here.
MAIN ELLIOTT WAVE COUNT
WEEKLY CHART
Click chart to enlarge.
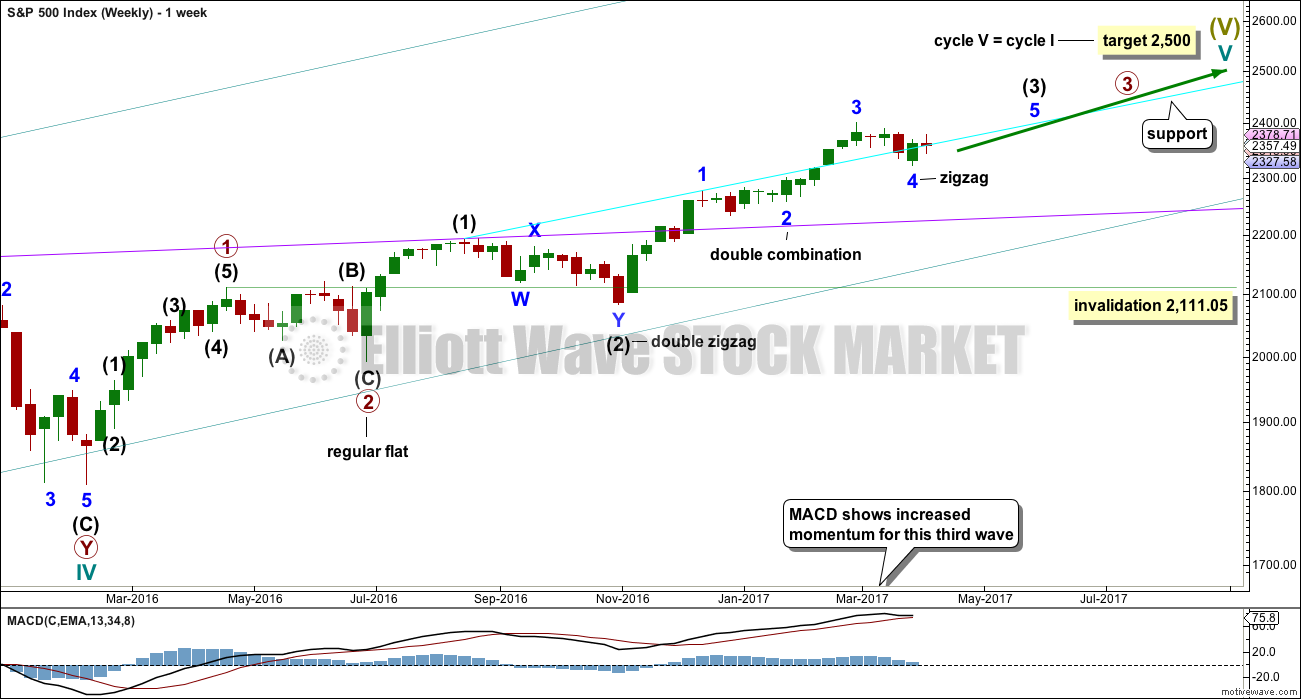
Cycle wave V is an incomplete structure. Within cycle wave V, primary wave 3 may be incomplete or it may be complete (alternate wave count below).
Primary wave 4 may not move into primary wave 1 price territory below 2,111.05.
DAILY CHART
Click chart to enlarge.
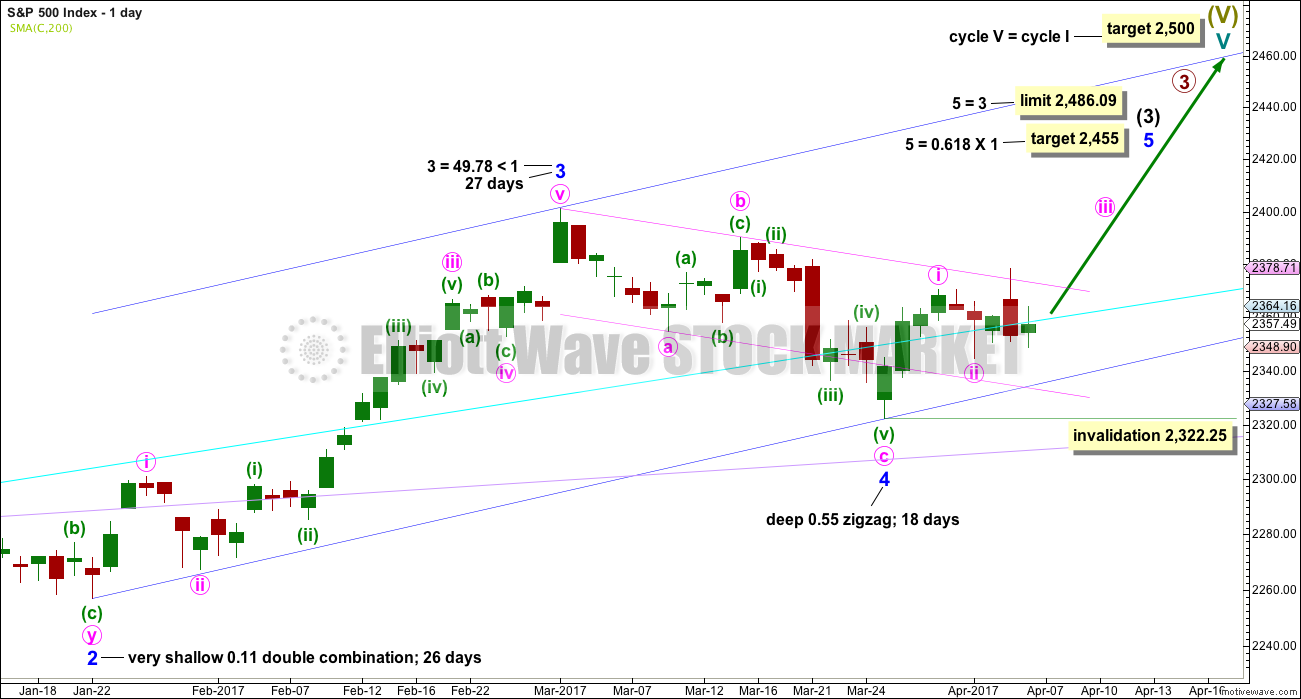
All subdivisions are seen in exactly the same way for both daily wave counts, only here the degree of labelling within intermediate wave (3) is moved down one degree.
This wave count expects the just completed correction is minor wave 4. Within minor wave 5, minute wave ii may not move beyond the start of minute wave i below 2,322.25.
Minor wave 4 is a little below the fourth wave of one lesser degree. Because it has now clearly breached an Elliott channel drawn using the first technique, the channel is now redrawn using Elliott’s second technique. There is good alternation between the very shallow combination of minor wave 2 and the deeper zigzag of minor wave 4.
A target for minor wave 5 is calculated.
The Elliott channel about minor wave 4 is drawn on the daily chart. The upper edge may be providing some resistance. Once price can break above this channel, then upwards momentum may build.
Minor wave 3 is shorter than minor wave 1. So that the core Elliott wave rule stating a third wave may not be the shortest is met, minor wave 5 is limited to no longer than equality in length with minor wave 3.
HOURLY CHART
Click chart to enlarge.
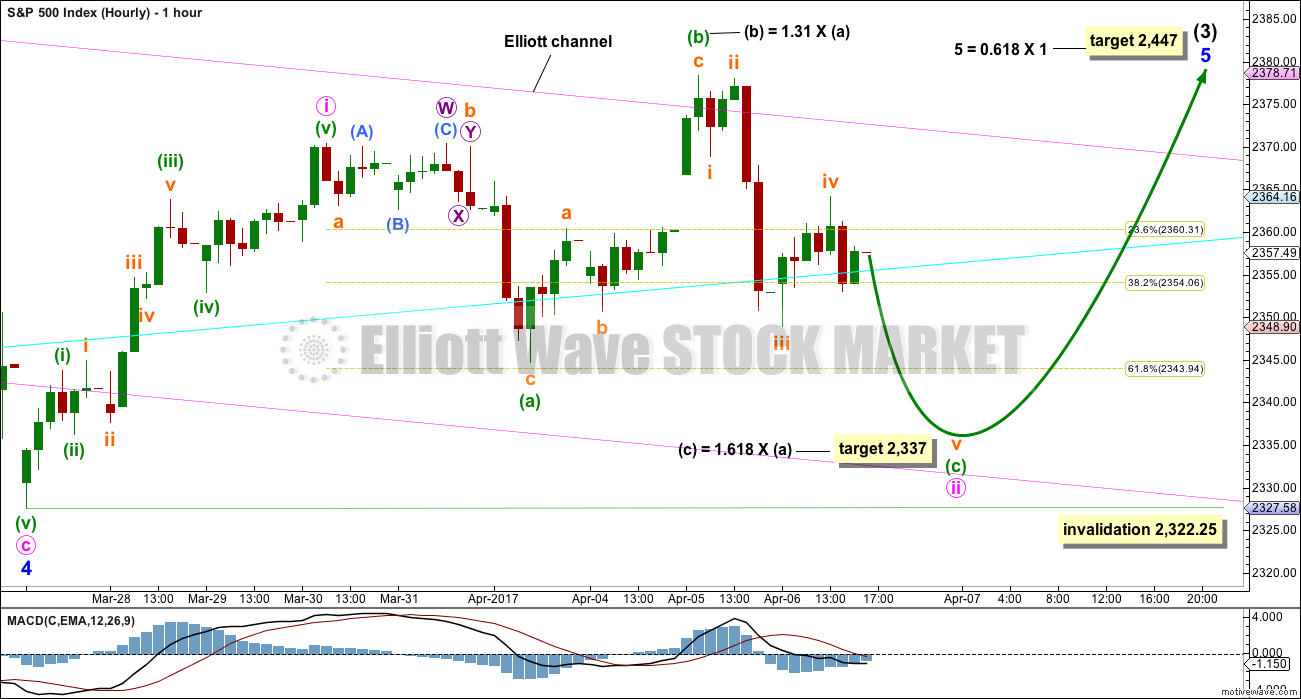
Only one hourly wave count will be provided today. Yesterday’s main hourly wave count does not have the right look.
It is my judgement at this stage that this idea has a better probability.
Minute wave ii may be an incomplete expanded flat correction. Within minute wave ii, minuette wave (c) must complete as a five wave structure. At this stage, it may be an almost complete impulse.
Minuette wave (c) would be extremely likely to make at least a slight new low below minuette wave (a) at 2,344.73 to avoid a truncation and a very rare running flat. The target expects the most common Fibonacci ratio to minuette wave (a), so it has a reasonable probability.
Minute wave ii may not move beyond the start of minute wave i at 2,322.25. A new low by any amount at any time frame below this point would see the main wave count invalidated and the alternate daily wave count below as the only wave count.
ALTERNATE DAILY CHART
Click chart to enlarge.
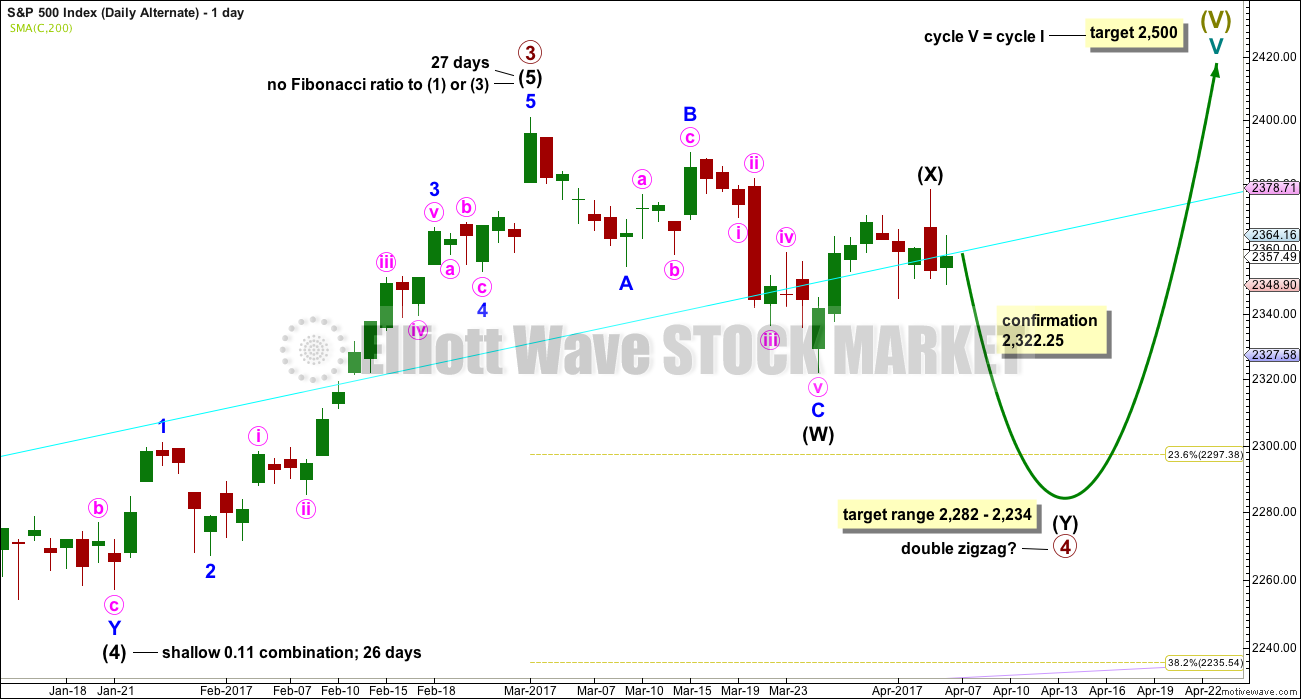
The subdivisions of upwards movement from the end of intermediate wave (2) are seen in the same way for both wave counts. The degree of labelling here is moved up one degree, so it is possible that primary wave 3 could be over.
Primary wave 2 was a flat correction lasting 47 days (not a Fibonacci number). Primary wave 4 may be unfolding as a double zigzag. It may total a Fibonacci 34 or 55 sessions.
Within double zigzags, the X wave is almost always brief and shallow. There is no rule stating a maximum for X waves, but they should not make a new price extreme beyond the start of the first zigzag in the double.
X waves within combinations may make new price extremes (they may be equivalent to B waves within expanded flats), but in this instance primary wave 4 would be unlikely to be a combination as it would exhibit poor alternation with the flat correction of primary wave 2.
For this alternate wave count intermediate wave (X) may now be complete. Both wave counts expect downwards movement: this alternate wave count to new lows for a second zigzag, which would be labelled intermediate wave (Y), and the main wave count for a brief pullback labelled minute wave ii. How low the next wave goes should indicate which wave count is correct. A new low now below 2,322.25 would see the main wave count discarded and this alternate confirmed.
If a new high above 2,400.98 is seen, then this alternate would be discarded.
The correction for primary wave 4 should be a multi week pullback, and it may not move into primary wave 1 price territory below 2,111.05.
TECHNICAL ANALYSIS
WEEKLY CHART
Click chart to enlarge. Chart courtesy of StockCharts.com.
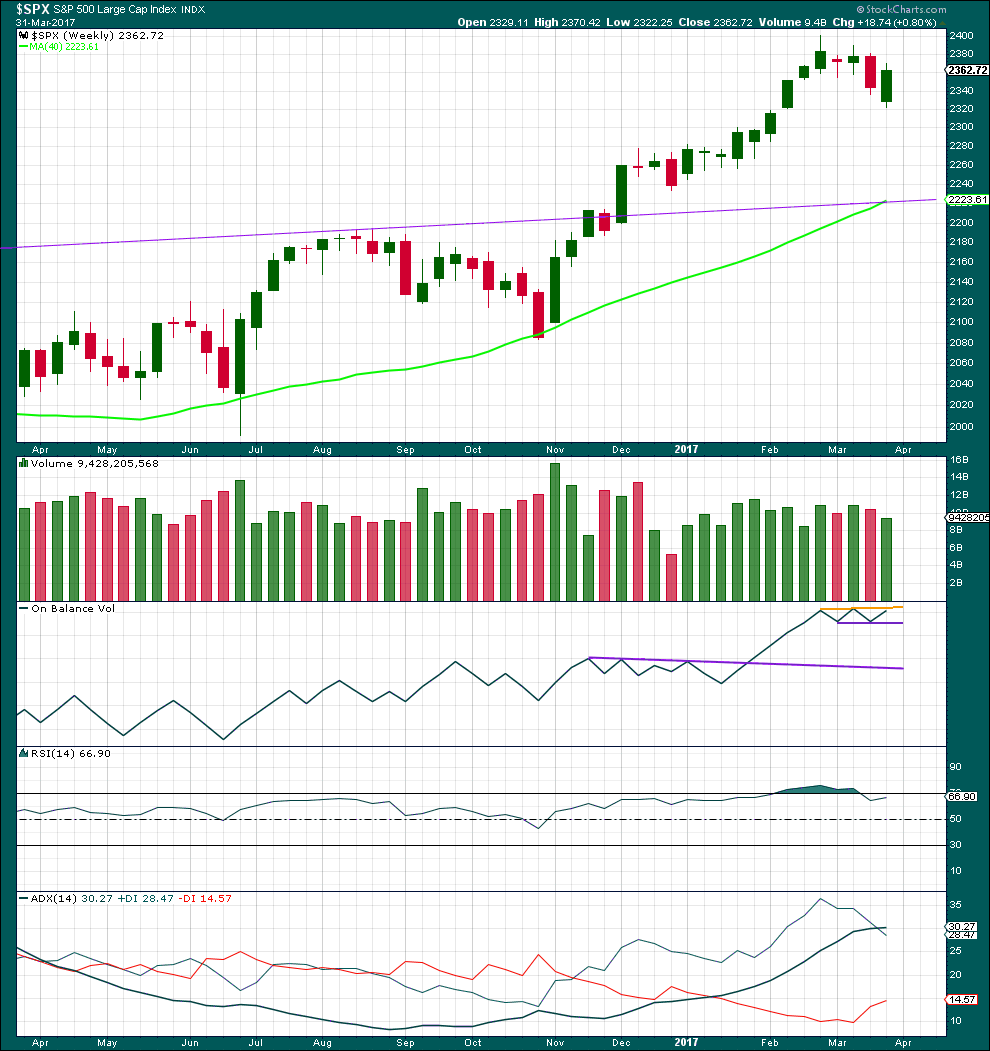
Last week completes a downwards week with a lower low and a lower high, but the week closes green and the balance of volume for the week is upwards. Although price has moved lower, the bulls rallied through to the end of the week to push price up above the open. This is bullish.
On Balance Volume now has a small range and it is constrained within. A breakout above or below would be a reasonable signal.
RSI is not overbought. There is room for price to rise.
ADX is now above both directional lines, so the trend is extreme. Looking back over the last 15 years at instances at the weekly chart level where ADX rose above both directional lines, this was most often followed by at least three or four downwards weeks. In one instance in December 2006 it was not, and this was towards the end of a third wave. In that instance, price continued overall higher for several weeks before a reasonable pullback.
ADX at the weekly chart level favours the alternate wave count, but it does not rule out the main wave count.
DAILY CHART
Click chart to enlarge. Chart courtesy of StockCharts.com.
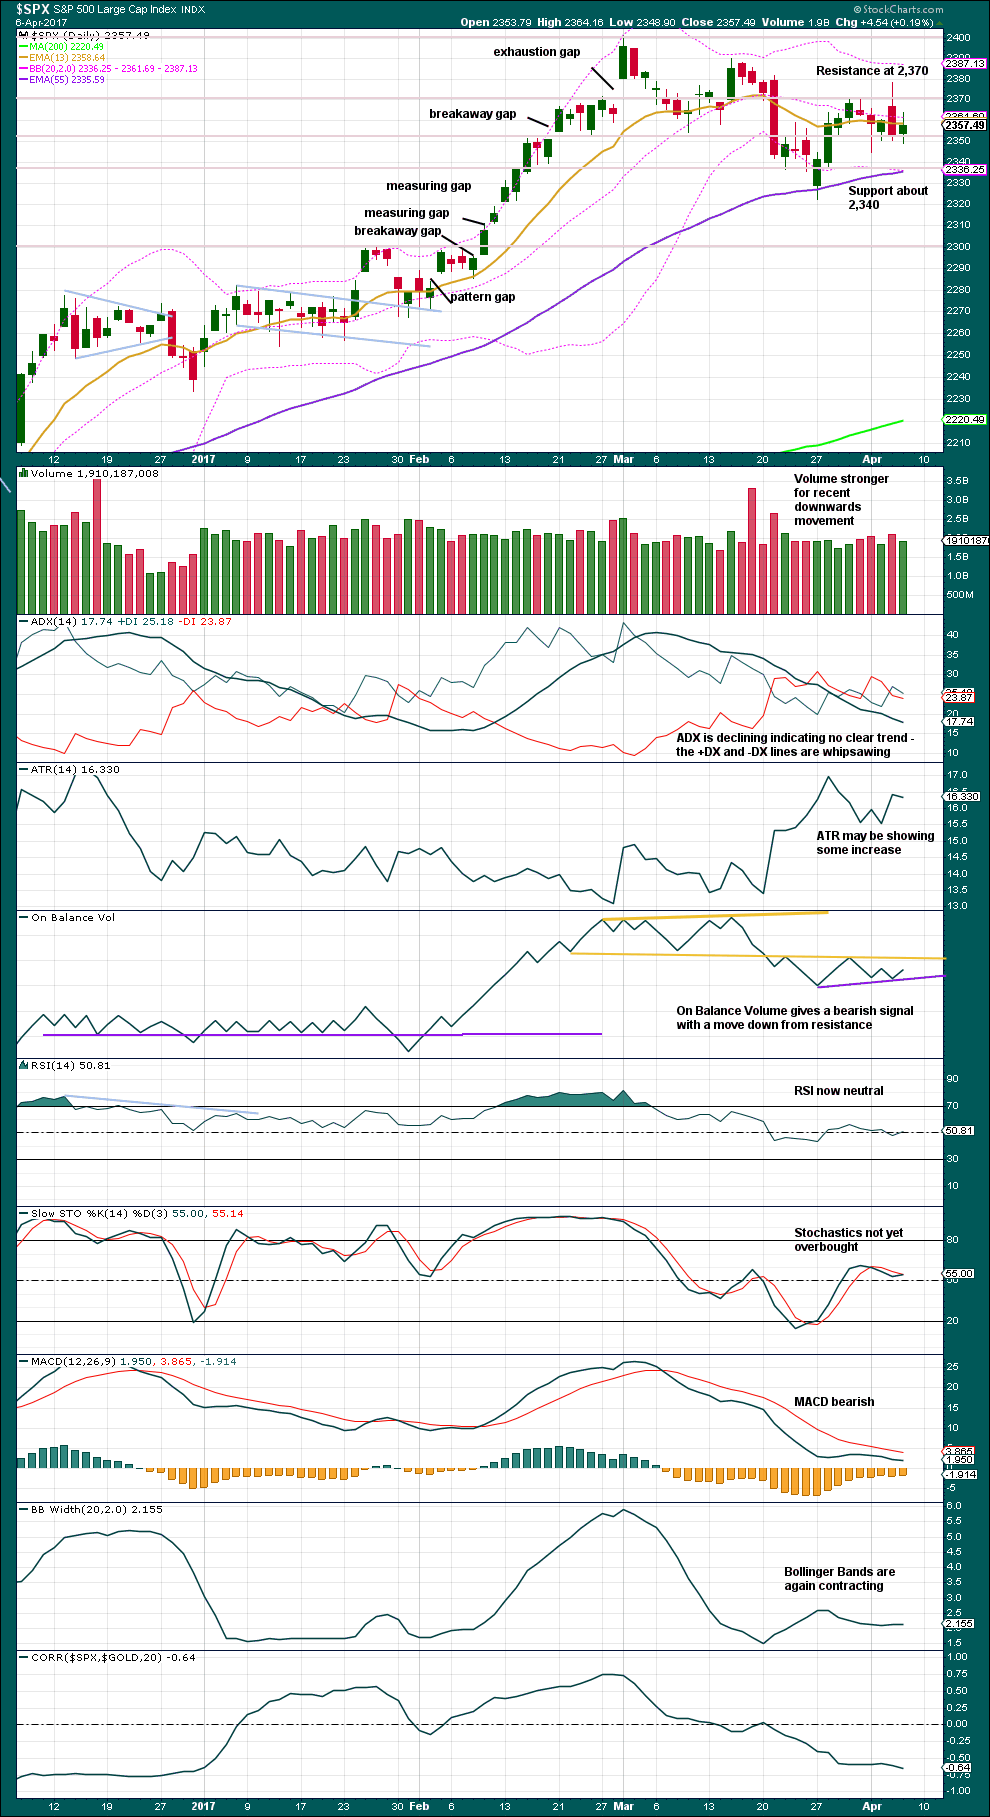
Volume is bearish. On Balance Volume is bearish. These offer reasonable support to the alternate daily Elliott wave count.
A new short term support line is added today to On Balance Volume. This line has very little technical significance at this stage.
The S&P, like Gold, remains range bound. The breakout is very likely to come with a price shock tomorrow, which may be instigated by the release of Non Farm Payroll data. This classic analysis suggests the breakout is more likely to be downwards than upwards.
Overall, this chart at this time offers more support for the alternate daily Elliott wave count.
A correlation to $GOLD is added today. I have been concerned recently that my analysis for both Gold and the S&P expect both to move higher. However, these markets are not always correlated; in fact, they are more often non correlated. It is entirely possible they may move together as they sometimes do.
VOLATILITY – INVERTED VIX CHART
Click chart to enlarge. Chart courtesy of StockCharts.com.
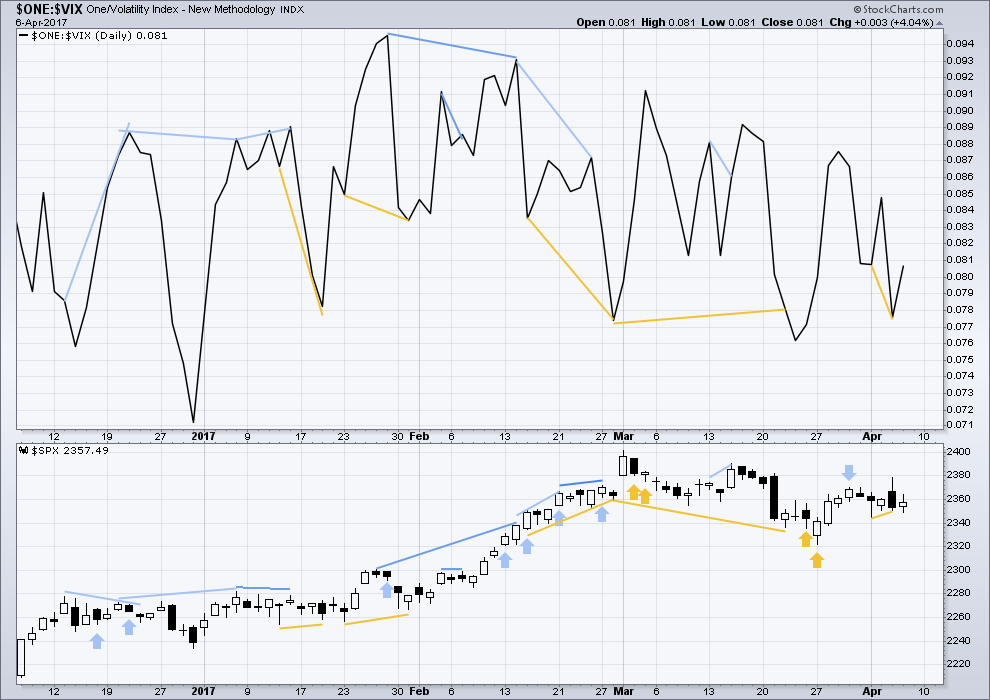
Normally, volatility should decline as price moves higher and increase as price moves lower. This means that normally inverted VIX should move in the same direction as price.
Bearish divergence and bullish divergence spanning a few short days used to be a fairly reliable indicator of the next one or two days direction for price; normally, bearish divergence would be followed by one or two days of downwards movement and vice versa for bullish divergence.
However, what once worked does not necessarily have to continue to work. Markets and market conditions change. We have to be flexible and change with them.
Recent unusual, and sometimes very strong, single day divergence between price and inverted VIX is noted with arrows on the price chart. Members can see that this is not proving useful in predicting the next direction for price.
Divergence will continue to be noted, particularly when it is strong, but at this time it will be given little weight in this analysis. If it proves to again begin to work fairly consistently, then it will again be given weight.
Short term bullish divergence noted yesterday remains, but today is slightly weaker. Today’s session technically completes a day of bullish single divergence: price moved lower, but inverted VIX moved higher. This will be given no weight as during the session price moved higher and closed green.
BREADTH – AD LINE
Click chart to enlarge. Chart courtesy of StockCharts.com.
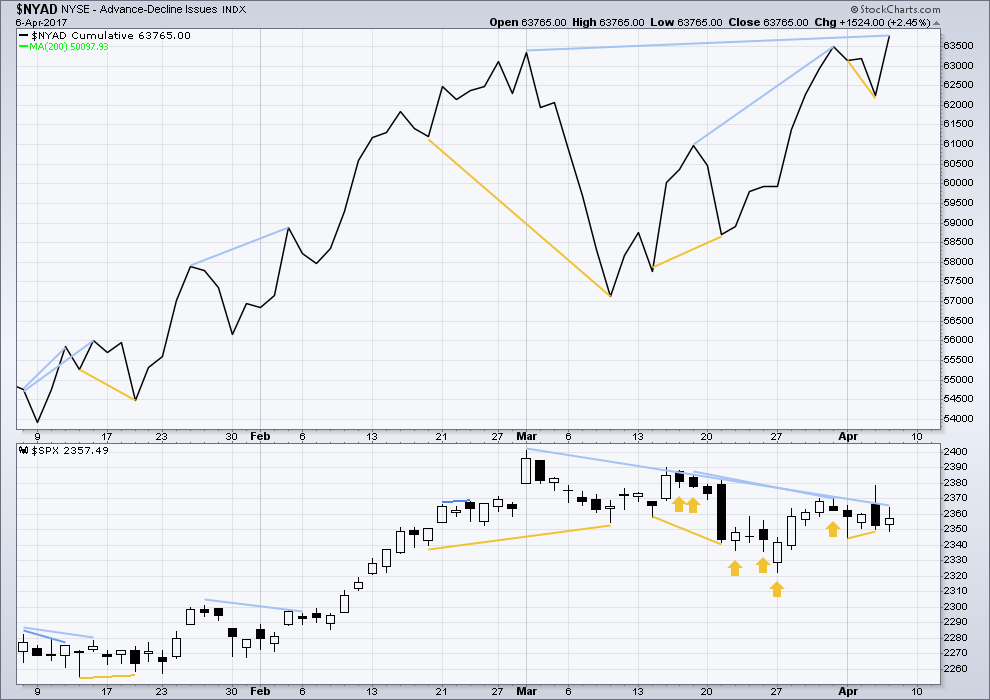
The rise in price has support from a rise in market breadth. Lowry’s OCO AD line also shows new highs along with price. Normally, before the end of a bull market the OCO AD line and the regular AD line should show divergence with price for about 4-6 months. With no divergence, this market has support from breadth.
There is short term bullish divergence between the AD line and price from yesterday’s low to the low of 14th of March (and also back to the 9th of March). Price has not come with a corresponding decline in market breadth while it has made a new low. There is weakness within this downwards movement from price. This supports the main hourly Elliott wave count which sees a low in place.
There is short term divergence still between price and the AD line. The AD line made a new low below the prior low of the 3rd of April, but price has not made a corresponding new low. This divergence is bullish and indicates weakness within downwards movement from price. This divergence remains but today is slightly weaker.
There is now mid term bearish divergence between the new high for the AD line today and the prior high of the 1st of March. While the AD line today made a new high, price has not made a corresponding new high. This indicates weakness in price and supports the alternate Elliott wave count.
DOW THEORY
The DJIA, DJT, S&P500 and Nasdaq continue to make new all time highs. This confirms a bull market continues.
This analysis is published @ 08:15 p.m. EST.
Carrier group on way to Korean peninsula per latest reports. The alternate count may be back in play as things heat up. Scary times folks.
Another sleep making yawn sideways day for the S&P. A small fourth wave moving sideways?
My preferred wave count for the very short term is still this. There’s enough bearishness about for me to still expect a new low below 2,344.72 at least.
Grabbed some weekly 236 calls and flipped for 160% in 15 mins. Holding some $240 calls into the weekend with those profits. Cheers.
Awesome!
Yet another ridiculous rising wedge, all gearing up for an eventual downside break…
she heard you again lol
She must have tapped my wires! 🙂
Gold and Silver tanking so fast it’s pretty incredible.
Massive naked shorts looking to make a break for the exits…lol!
Looks more like ascending triangle to me. If it breaks upper trend line at 2359 could go for a run, potential start/confidence in Lara’s minute wave 3. I’m in to Apr 7 SPY 236 calls at .06. Small 150 contract position.
Coming back to test breakout point. Stop in place at 0.12 just in case.
Stopped out at 0.12…small $600 gain after commission.
Have a nice dinner on the market makers!
Another gunslinger! lol!
Really thought wave 3 was starting and this would have been a good entry. Might still be. But glad I got stopped out, now I can enjoy the rest of Friday! Let’s see, maybe your wedge thesis will still culminate!
Big divergence with VIX and market price. This generally only seen at the end, or begining of big declines…..
it appears it’s trying to make a run above the 200 day. So much manipulation between last night and now it’s making me stomach sick
They are working overtime to try and reverse the downtrend and really burning boatloads of cash. It’s really only a matter of time imho….
Hopefully nugt calls will jump. Kicking self for not buying slv calls as I intended today.
Trump has unfortunately been overcome by the blood-thirsty war-mongering neo-cons in the US. How is it possible that a man of his intelligence cannot recognize a false flag when it comes right up and bites him on the arse!!??? Those disgusting throw-back so called moderate rebels pulled this same stunt back in 2013 but it seems everyone forgets that Assad GAVE UP his chemical weapons.
I have no idea what the spooks threatened him with but he has obviously surrendered his integrity to these malevolent creatures. So now we are going to war with the Russians. Make no mistake. They are going to defend their interests in Syria. I should be happy. I am going to make a lot of money on my short positions and my volatility trades but I am profoundly sad and ashamed of my leaders. Very sad!!! 🙁
I hear you Verne. Unfortunately many will applaud this action. I don’t think the course we are on can be changed at this point and this action just accelerates the process.
Alexis deTocqueville once pointed out that structures of self-governance are insufficient to maintain liberty, and that the destiny of a people will ultimately decided by “habits of the heart”. In other words, a loss of virtue must ultimately result in a loss of freedom, constitution not withstanding. What depesses me more than anything is having to admit that we get the kind of government we deserve. The fact that we as Americans have become so stupid and gullible as to be unable to recognize when we are being manipulated means a complete loss of our freedom is not far off. I am accelerating plans to move my family out of the US. It is truly becoming a very dangerous place.
From my POV way down here at the bottom of Earth (which is actually the top if they all would just put their maps around the right way LOL) the information I get is quite different from what those of you get inside the USA.
Anyway, I’ll not go into my political views here.
I will say though that there have been a few cases of folks interrogated when trying to enter the USA. A recent one of a 70+ Australian woman, a writer of children’s books, is pretty disturbing. I wouldn’t want to go through that. And from my POV the USA is now neither a welcoming place, nor a safe place for me to go.
We have family there, but won’t be visiting them. And I won’t be flying through it en route to anywhere else.
My only political statement here will be my most fervent hope that Trump doesn’t make a “pre-emptive” strike on North Korea. That would likely start WWII, nuclear WWIII. Please please please don’t to that!!
I am praying that he does not! But that is my exact fear. Lord help us if he does. I share your sentiments about US airports. Recent changes in the so-called manual screening process is nothing less than public sexual molestation. I am not kidding folks. What these disgusting perverts are now permitted to do and where they are permitted to grope is absolutely beyond the pale. Thank God I no longer have young children. If I did and one of those skunks posing as a TA screener tried to do the things we see them now doing to young and old alike something was going to get broken (and I would probably go to jail!)
It is sad testimony to the state of the sheeple in this country that they willingly put up with this kind of abuse. I hate those scanners but there is no way any one of those cretins is going to put his hands on me where they do not belong….HELL NO!! 🙂
Nothing to say he gave up all his chemical weapons. Even if he did(doubtful), the Syrian air force have also recently used chlorine bombs on their own people.
Did they? Who provided that informaton? You can go back as far as Woodrow Wilson and WW1 and you will discover we have been repeatedly lied to as a nation, as regards to a reason for sending our young men and women to war.
In fact, I cannot think of single instance of our recent involvement in conflict that has not been subsequently proved to be based on deception, or an outright tissue of lies. The warmongers depend on the gullibility of the American public for their propagada’s success and they are right to consider us morons. I wanted to retch watchig Nikki Haley trot out the dead baby meme once again. Anybody remember Kuwait and the incubator story? My God , what imbeciles we have become buying that load of crap!
It is possible to trace the orgin of chemical weapons. Two things were established about past gas attacks in Syria.
The chemicals were not military grade.
They had their orgin in Turkey and Saudi Arabia.
Of course if your only source of information is that offered by the severely compomised Western media…well, nuff said!
Short list: Lusitania, Gulf of Tonkin, WMD’s. Gotta be a reason to practice our humane non-chemical warfare.
Yep. You don’t have to look far but we Americans have become lazy, fat and gullible, if not outright stupid.
They are now trotting out the terrorist Shajul Islam as an expert on chemical warfare. Have these people no shame??!!!
I am going to have to go back to ignoring the news or my head is going to explode- not a pretty sight I wager…. 🙂
Janet heard you last night Verne….:)
Syria air and naval strike. Futures down 13 handles at the moment
This news looks to make these charts come true!
first