
Upwards movement was expected. Price did move higher to begin the session, but fell strongly in the final hours to close red. An outside day was completed.
Summary: If the main wave count is correct, then price should now begin to move strongly higher. An upwards breakout above resistance at 2,370 should happen tomorrow or very soon. An alternate hourly wave count expects tomorrow to begin with some downwards movement to 2,337 before a trend change.
Reduce position size at this time to only 1-3% of equity due to bearishness in classic analysis.
There is still some concern from classic technical analysis for the main Elliott wave count. ADX at the weekly chart level indicates now the trend is extreme. This is most commonly (not always) followed by a few weeks of downwards movement. On Balance Volume at the daily chart level gives a bearish signal.
The alternate wave count is possible.
New updates to this analysis are in bold.
Last monthly and weekly charts are here. Last historic analysis video is here.
MAIN ELLIOTT WAVE COUNT
WEEKLY CHART
Click chart to enlarge.
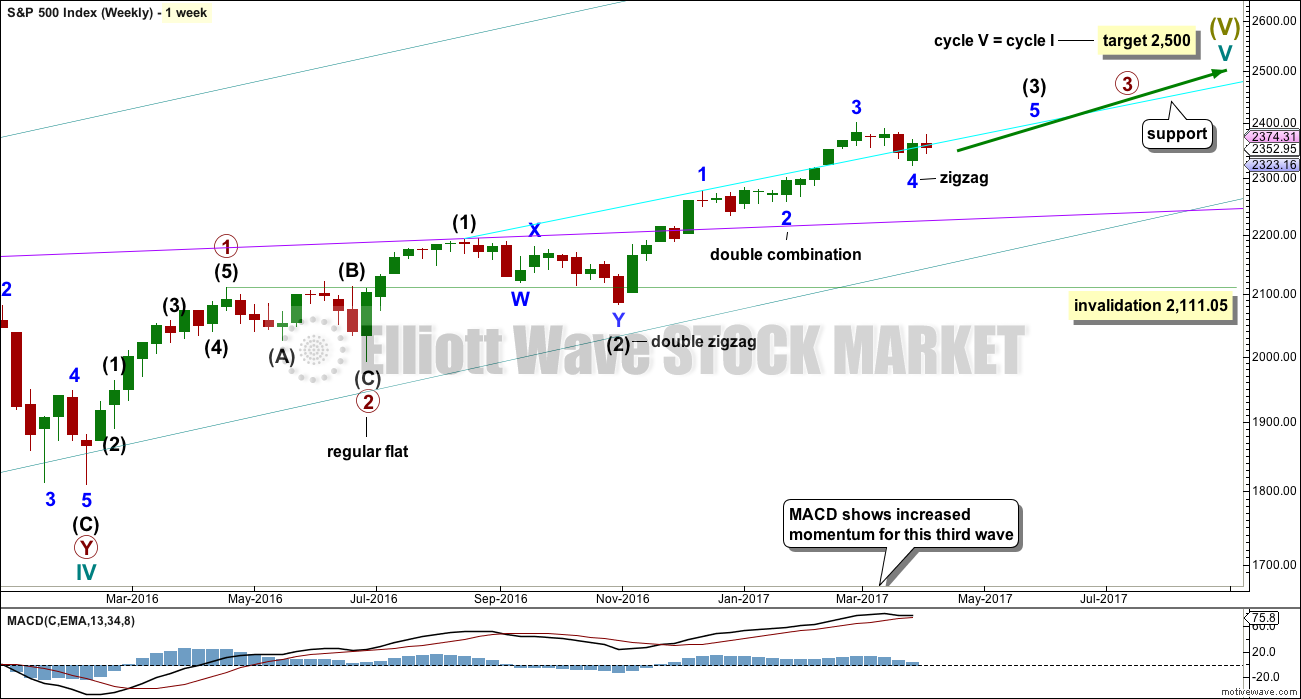
Cycle wave V is an incomplete structure. Within cycle wave V, primary wave 3 may be incomplete or it may be complete (alternate wave count below).
Primary wave 4 may not move into primary wave 1 price territory below 2,111.05.
DAILY CHART
Click chart to enlarge.
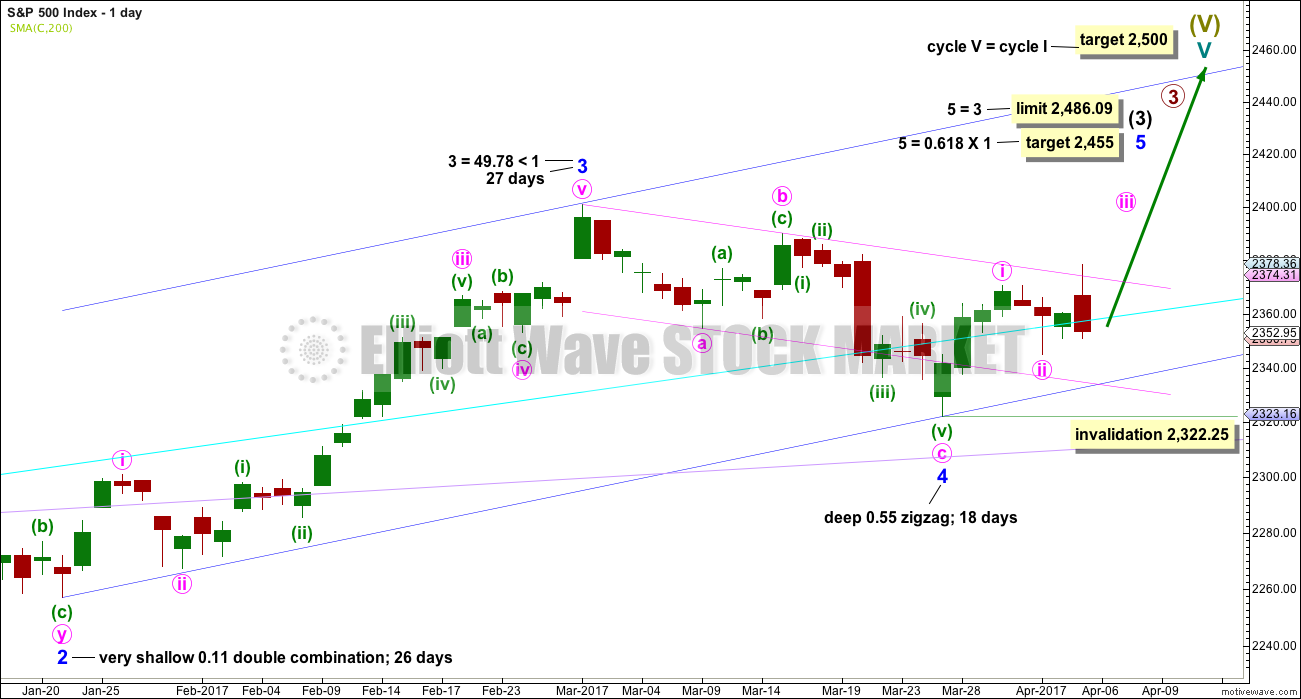
All subdivisions are seen in exactly the same way for both daily wave counts, only here the degree of labelling within intermediate wave (3) is moved down one degree.
This wave count expects the just completed correction is minor wave 4. Within minor wave 5, minute wave ii may not move beyond the start of minute wave i below 2,322.25.
Minor wave 4 is a little below the fourth wave of one lesser degree. Because it has now clearly breached an Elliott channel drawn using the first technique, the channel is now redrawn using Elliott’s second technique. There is good alternation between the very shallow combination of minor wave 2 and the deeper zigzag of minor wave 4.
A target for minor wave 5 is calculated.
The Elliott channel about minor wave 4 is drawn on the daily chart. The upper edge may be providing some resistance. Once price can break above this channel, then upwards momentum may build.
Minor wave 3 is shorter than minor wave 1. So that the core Elliott wave rule stating a third wave may not be the shortest is met, minor wave 5 is limited to no longer than equality in length with minor wave 3.
HOURLY CHART
Click chart to enlarge.
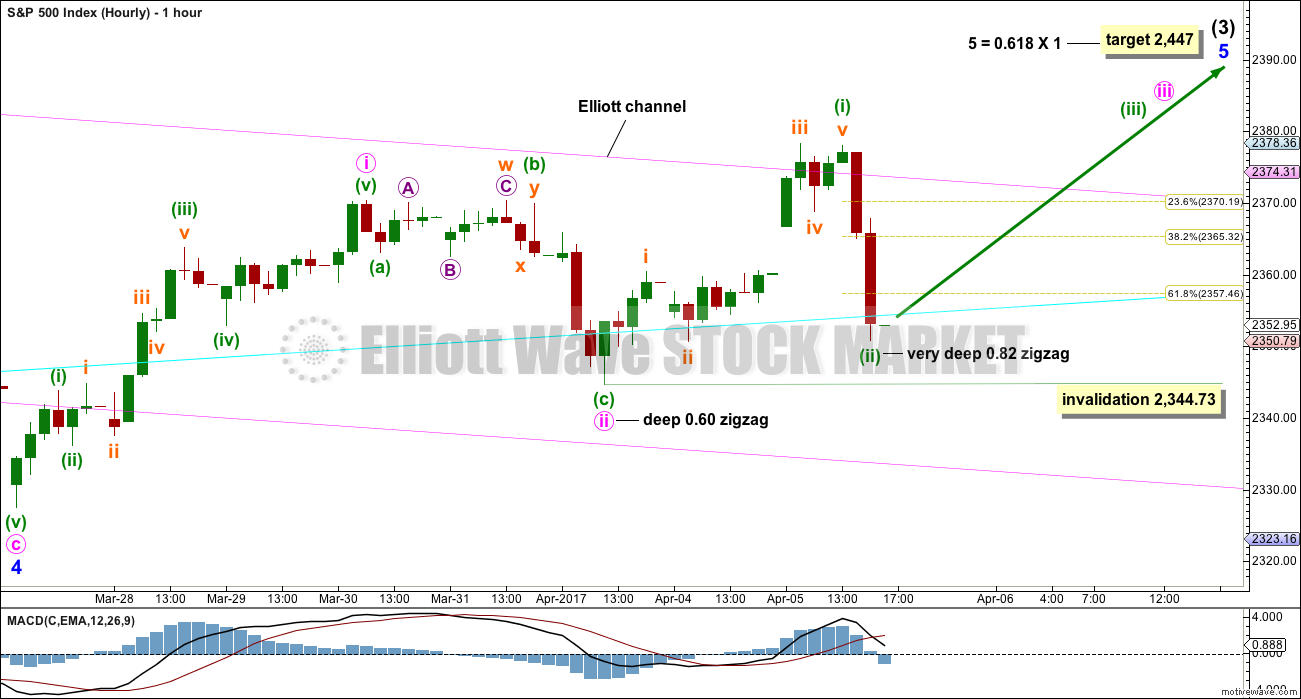
Minute waves i and ii may be complete. Minute wave iii may have begun. If this first hourly chart is correct, then tomorrow should see an upwards breakout.
This wave count must see minuette wave (i) end with a very slightly truncated fifth wave for subminuette wave v. This slightly reduces the probability of this main wave count.
Although this wave count is labelled the main wave count, it would be my judgement today that this wave count may have about an even probability with the alternate below.
Minute wave iii must subdivide as an impulse. Within minute wave iii, minuette wave (ii) may not move beyond the start of minuette wave (i) below 2,344.73.
The upper edge of the Elliott channel, which contained minor wave 4, may be providing resistance. Once price can break above it, then upwards momentum may begin to build.
If price makes a new low below 2,344.73 tomorrow, then this first hourly chart would be invalidated and the alternate hourly chart below should be used.
ALTERNATE HOURLY CHART
Click chart to enlarge.
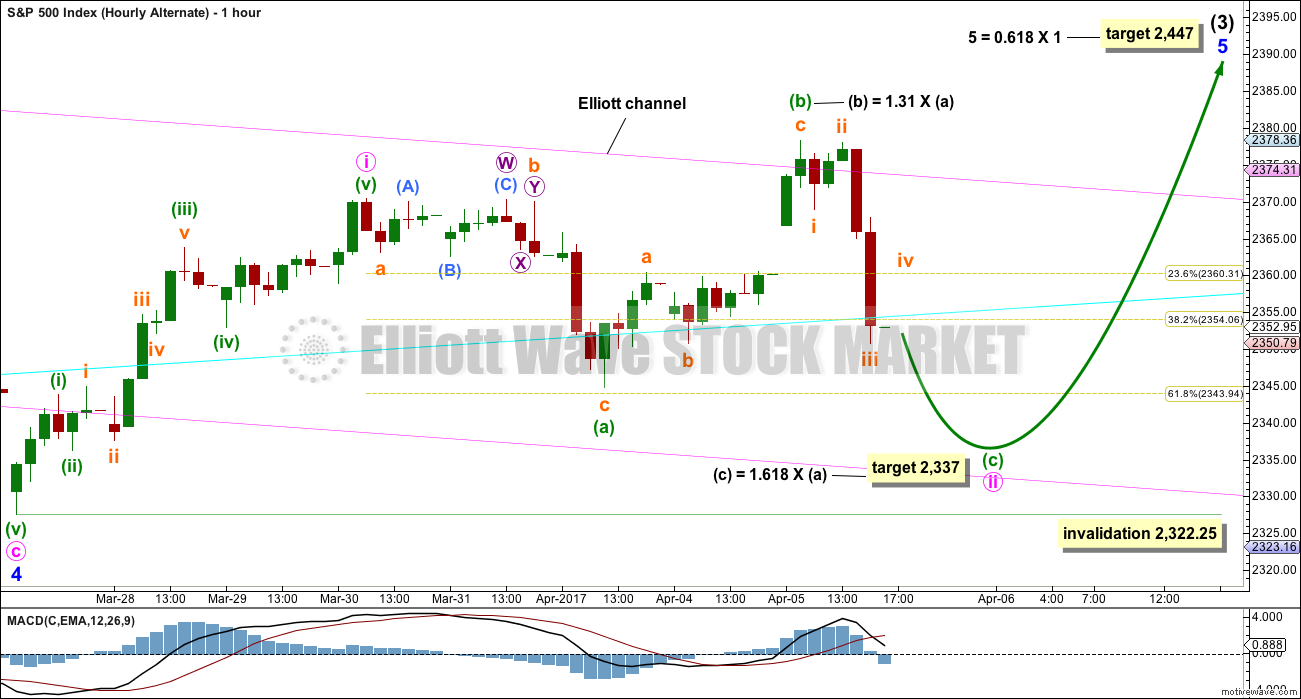
Minute wave ii may be continuing further as an expanded flat correction.
The subdivisions of upwards movement, labelled minuette wave (b), do fit slightly better as a zigzag than an impulse. A truncation is avoided.
Tomorrow’s session may begin with a little more downwards movement. Thereafter, a third wave up would be expected to begin.
Minute wave ii may not move beyond the start of minute wave i below 2,322.25.
ALTERNATE DAILY CHART
Click chart to enlarge.
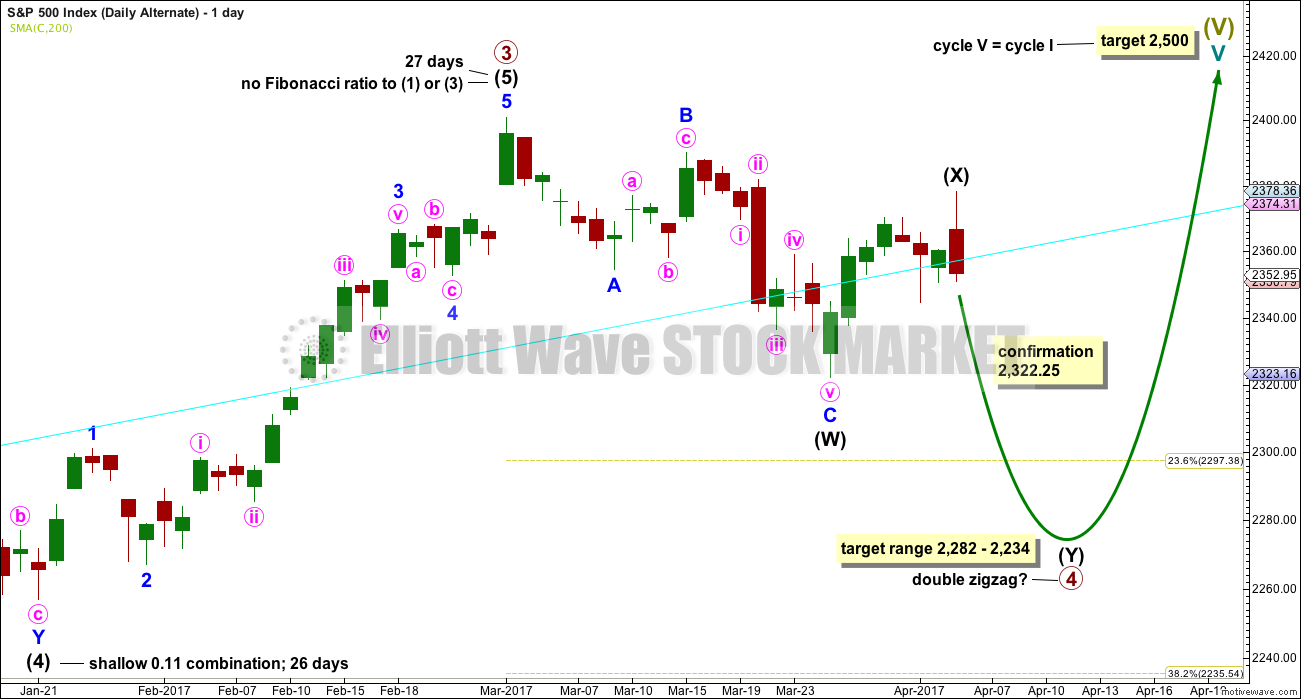
The subdivisions of upwards movement from the end of intermediate wave (2) are seen in the same way for both wave counts. The degree of labelling here is moved up one degree, so it is possible that primary wave 3 could be over.
Primary wave 2 was a flat correction lasting 47 days (not a Fibonacci number). Primary wave 4 may be unfolding as a double zigzag. It may total a Fibonacci 34 or 55 sessions.
Within double zigzags, the X wave is almost always brief and shallow. There is no rule stating a maximum for X waves, but they should not make a new price extreme beyond the start of the first zigzag in the double.
X waves within combinations may make new price extremes (they may be equivalent to B waves within expanded flats), but in this instance primary wave 4 would be unlikely to be a combination as it would exhibit poor alternation with the flat correction of primary wave 2.
For this alternate wave count intermediate wave (X) may now be complete. Both wave counts expect downwards movement: this alternate wave count to new lows for a second zigzag, which would be labelled intermediate wave (Y), and the main wave count for a brief pullback labelled minute wave ii. How low the next wave goes should indicate which wave count is correct. A new low now below 2,322.25 would see the main wave count discarded and this alternate confirmed.
If a new high above 2,400.98 is seen, then this alternate would be discarded.
The correction for primary wave 4 should be a multi week pullback, and it may not move into primary wave 1 price territory below 2,111.05.
TECHNICAL ANALYSIS
WEEKLY CHART
Click chart to enlarge. Chart courtesy of StockCharts.com.
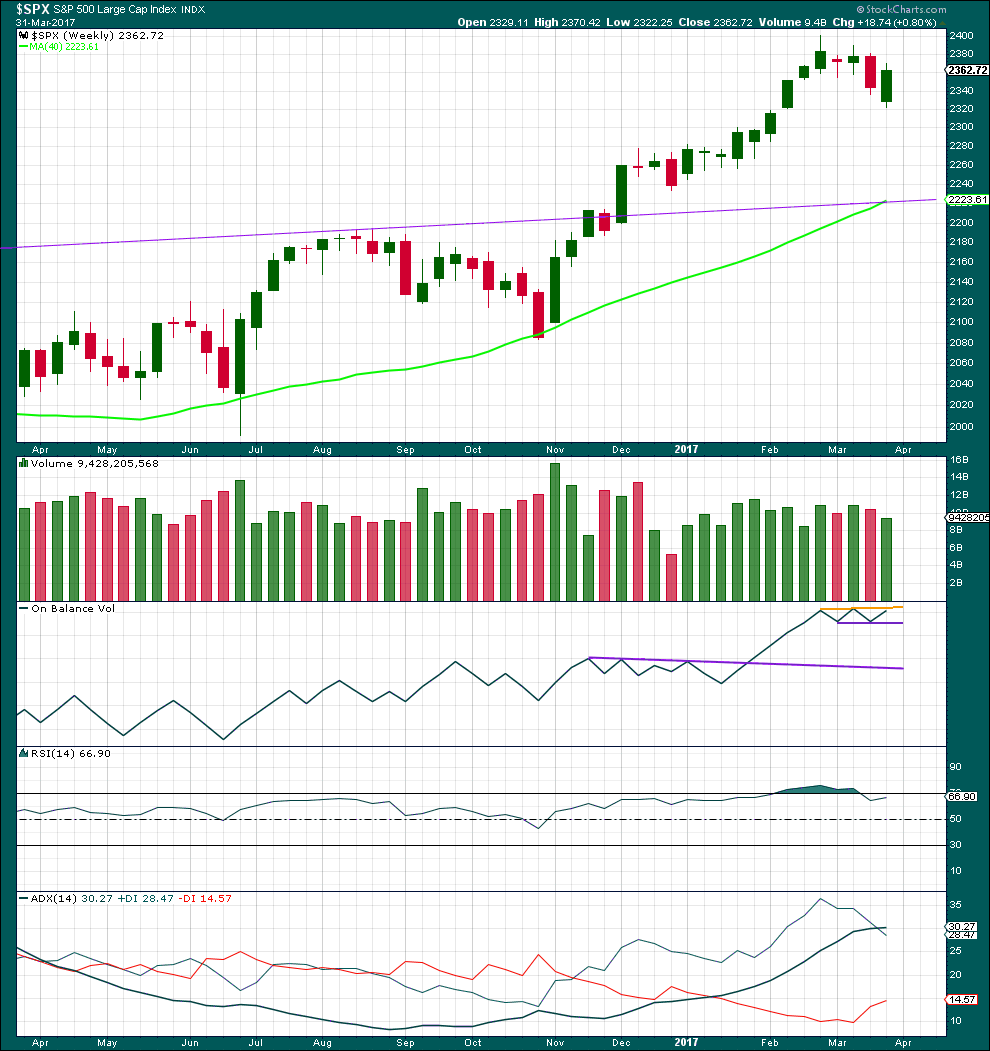
Last week completes a downwards week with a lower low and a lower high, but the week closes green and the balance of volume for the week is upwards. Although price has moved lower, the bulls rallied through to the end of the week to push price up above the open. This is bullish.
On Balance Volume now has a small range and it is constrained within. A breakout above or below would be a reasonable signal.
RSI is not overbought. There is room for price to rise.
ADX is now above both directional lines, so the trend is extreme. Looking back over the last 15 years at instances at the weekly chart level where ADX rose above both directional lines, this was most often followed by at least three or four downwards weeks. In one instance in December 2006 it was not, and this was towards the end of a third wave. In that instance, price continued overall higher for several weeks before a reasonable pullback.
ADX at the weekly chart level favours the alternate wave count, but it does not rule out the main wave count.
DAILY CHART
Click chart to enlarge. Chart courtesy of StockCharts.com.
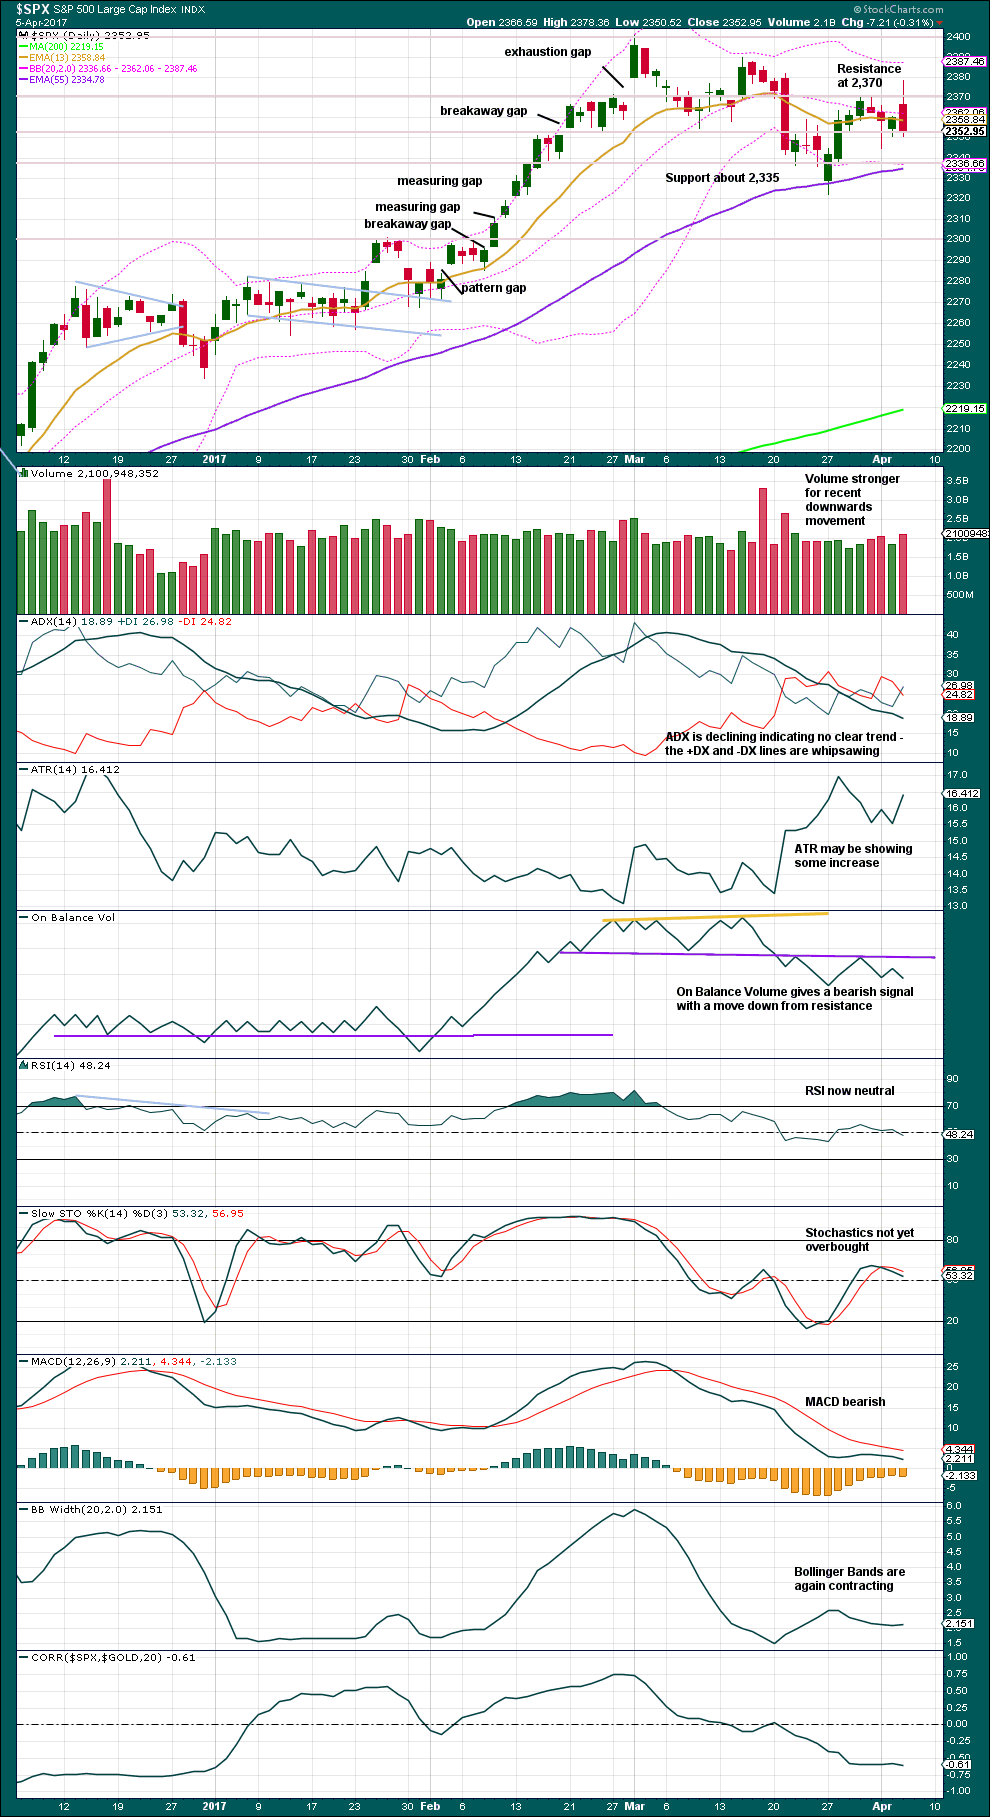
Volume is bearish. On Balance Volume is bearish. These offer reasonable support to the alternate daily Elliott wave count.
Overall, this chart at this time offers more support for the alternate daily Elliott wave count.
A correlation to $GOLD is added today. I have been concerned recently that my analysis for both Gold and the S&P expect both to move higher. However, these markets are not always correlated; in fact, they are more often non correlated. It is entirely possible they may move together as they sometimes do.
VOLATILITY – INVERTED VIX CHART
Click chart to enlarge. Chart courtesy of StockCharts.com.
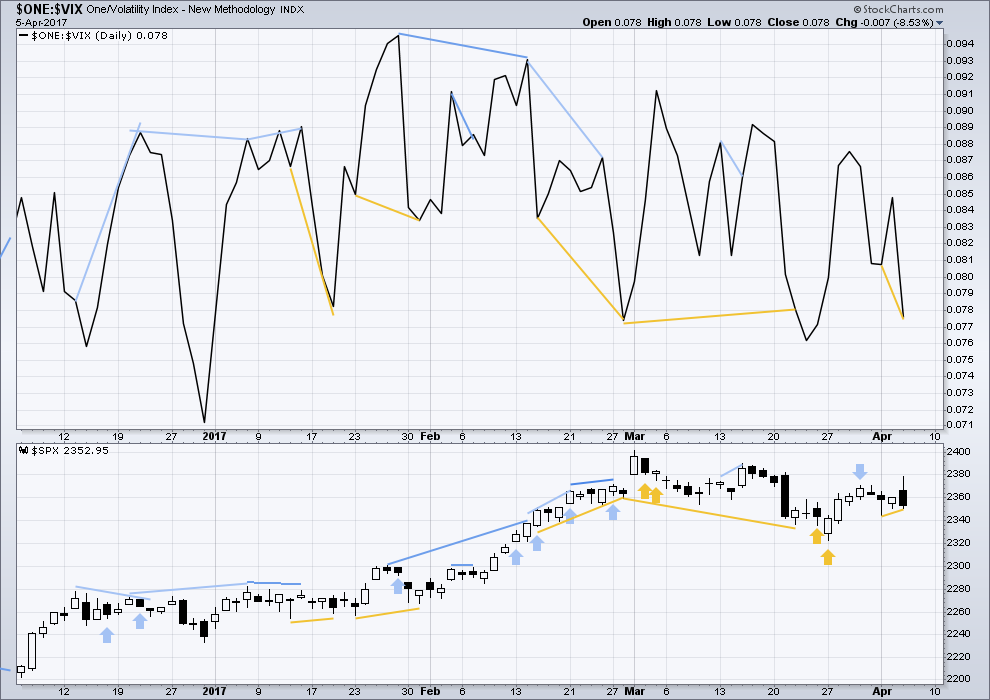
Normally, volatility should decline as price moves higher and increase as price moves lower. This means that normally inverted VIX should move in the same direction as price.
Bearish divergence and bullish divergence spanning a few short days used to be a fairly reliable indicator of the next one or two days direction for price; normally, bearish divergence would be followed by one or two days of downwards movement and vice versa for bullish divergence.
However, what once worked does not necessarily have to continue to work. Markets and market conditions change. We have to be flexible and change with them.
Recent unusual, and sometimes very strong, single day divergence between price and inverted VIX is noted with arrows on the price chart. Members can see that this is not proving useful in predicting the next direction for price.
Divergence will continue to be noted, particularly when it is strong, but at this time it will be given little weight in this analysis. If it proves to again begin to work fairly consistently, then it will again be given weight.
There is short term bullish divergence today between price and inverted VIX: while inverted VIX has made a new low below the prior low of the 3rd of April, price has not made a corresponding new low. This divergence indicates weakness in price for today’s downwards movement.
BREADTH – AD LINE
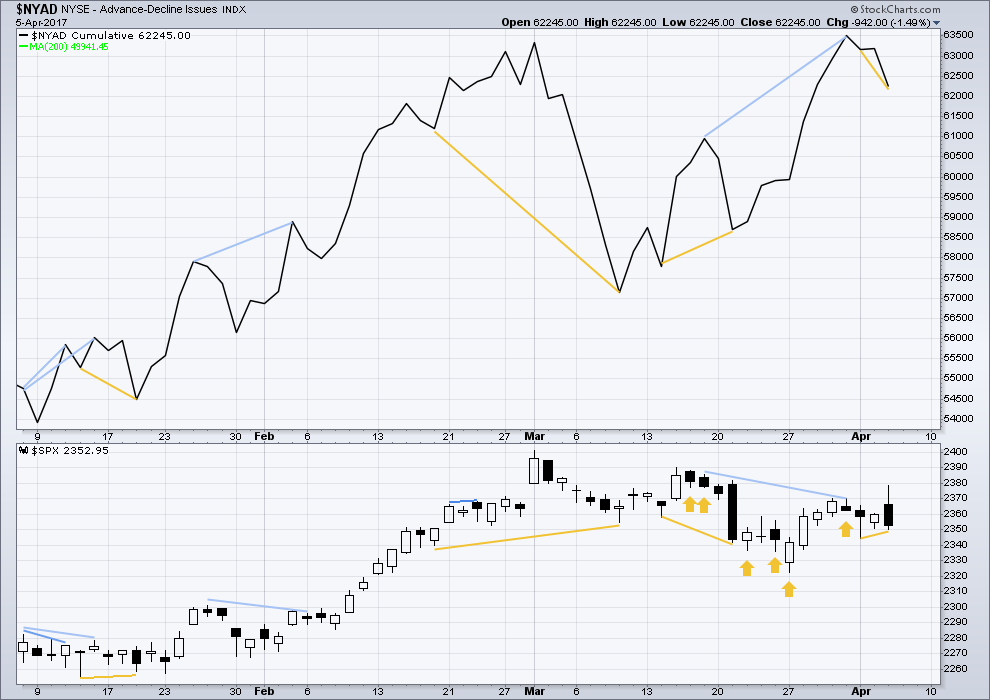
Click chart to enlarge. Chart courtesy of StockCharts.com.
The rise in price has support from a rise in market breadth. Lowry’s OCO AD line also shows new highs along with price. Normally, before the end of a bull market the OCO AD line and the regular AD line should show divergence with price for about 4-6 months. With no divergence, this market has support from breadth.
There is short term bullish divergence between the AD line and price from yesterday’s low to the low of 14th of March (and also back to the 9th of March). Price has not come with a corresponding decline in market breadth while it has made a new low. There is weakness within this downwards movement from price. This supports the main hourly Elliott wave count which sees a low in place.
There is short term divergence today between price and the AD line. The AD line made a new low below the prior low of the 3rd of April, but price has not made a corresponding new low. This divergence is bullish and indicates weakness within downwards movement from price today.
DOW THEORY
The DJIA, DJT, S&P500 and Nasdaq continue to make new all time highs. This confirms a bull market continues.
This analysis is published @ 01:05 a.m. EST on 6th April, 2017.
I think everyone’s waiting for NFP tomorrow, so today is going to be quiet and slow.
I’m on the road shortly. Will stop for lunch and work later after market close.
I think tomorrow we will see some strong movement.
Selling half SPY 236 puts for 1.09… close enough…! 🙂
Opening STC order on another quarter at 1.20. It was that high today and backed off a bit but should go back to that area before the close. Never leave profits sitting in the market I always say… 🙂
Noticed a large SPY sweep just a bit ago. May 19th (monthly), $241 calls. 98,000 contracts
They could have picked those calls for a lot less a few days hence I think… 🙂
I wish I had the foresight you do!
Verne, you are a man of talents! I cannot stand doubling down multiple times. Personally in April $238c with a tight stop
Very tricksy market. I was just looking at the daily chart and it looks like it snuck in the end of that impulse down at the open this morning….naughty! naughty! 🙂
You don’t get too many opportunities to stick it to the market makers so yer gotta make hay while the sun is shining! 🙂
Congrats. I held the 238 calls but snuck in a 20% weekly spy put here.
I am such a WUS aren’t I??
There goes my 1.10 target then some; Oh well. I will just let the second half ride a bit. You know what they say: bulls make money, bears make money, but pigs…
Short SPY puts poking head above water; adding another 50 contracts….will unload half at 1.10 which we should hit before the close…
We may go back up to the top before the close to bamboozle folk but I think we are ultimately heading lower; holding short positions…
Yen already moving off this morning’s lows. US indices should similarly turn down…
I think the initial impulse down is finished. This has to be second wave already underway..
Classic throw over. Should immediately reverse…
Volume picking up breaking out of HOD. Not sure it meets ED standards. Be careful.
Sidenote: Coincidence that Ending Diagonal and Erectile Dysfunction have the same initials?
50% retracement of move from yesterday’s high to today’s low now complete. Can it push to 61.8%? Volume could start to decline and price slowly drip up.
I had the 62% level on the money…
Things sure are limping along… 🙂
Contracting ED?
Small second wave?
If so we should shortly get some downside momentum….
Let’s hope the fifth wave down is deep enough to let us cash out with nice profits on short term trades. I would not hold not hold any gains overnight. The bankseters are probably going to whipsaw traders. Hammer them on the next bounce. As soon as more traders figure out how they operate we should see some more reasonable price action…
IWM 13 day ema is now below both the 34 and 50 ema’s. This is support for a more bearish outlook. It is as C. Ciovacco states, evidence in hand. What it does from here, I do not know. But the fact that the crossover has occurred must be noted.
Break from wedge underway. They may try a second ramp…
Adding to SPX 236 puts lowering cost basis to 0.80…
Still in them? Look to be around .70 now.
Oh yeah! 🙂
The break from this bearish possible fourth wave rising wedge should be sharp. I am guessing it is going to complete its move down intra day trapping anyone who tries to chase it. The key is to get positioned BEFORE it breaks. I expect overnight futures to go hogwild. I intend to short the you know what out of it if it does.
Looks like we are in some kind of fourth wave so we should take out yesterday’s lows and then see a furious second wave higher. I am planning on pulling the trigger on any new low and reloading. They will probably generate a big ramp up into the weekend and I sure hope they do…pretty please! 🙂
It has to be obvious to anyone paying attention that you cannot generally position trade this market. You have to strike quickly and often!
Reminiscent of a triangle? I am going to watch from the sidelines until we see the furious second wave you mentioned.
They may try to keep things propped up till near the close to try and ensnare bearish late comers…
NDX is one of the phoniest indices on the planet. The banksters are juicing a very few number of its most heavily weighted components to create an illusion of strength. Any index making new all time highs with more than half of its stocks trading below their 50 dma is more than a little suspect…
I am not trusting this market at all. The NDX makes a new intraday ATH yesterday but could not hold it and finished below the previous day close. That is very bearish.
In the SPX we have lower highs. Yesterday we had a gap open fail. Then the SPX filled the open gap only to close below the previous day low. Again, quite bearish. Whatever is going on, I am quite concerned with the outlook.
Banksters are having a bit of fun today trying to bamboozle tentative shorts. No doubt they are currently running stops of bear cubbies! 🙂
Buying SPY 236 puts expiring tomorrow for 0.89
Looking for a 50% pop before the close. Ten contracts.
I thought I was the only crazy person noticing that on the NDX. Breadth numbers are greatly skewed and manipulated as a result of zillions of ETFs, allocated through 401ks, retail, etc, then easily gamed by banksters. Had to throw a small short on AMZN yesterday. Couldn’t help it.
We do not have market. We have a sophisticated criminal enterprise masquerading as a market. Leaps on those ndx high flyers are going to make some smart and patient traders a fortune!
Right you are, I do hope the banksters get exposed for what they are and what they’ve done to the working class, and economies worldwide. I fear the engineered and managed bear market, that ultimately allows them to walk away with even more power and control.
Yep. My biggest fear is that they are going to halt trading once this thing blows up. My plan is to systematically move capital out of my trading account before the end of the third wave…
The short Yen carry trade to try and juice US equities is also starting to blow up. Every time they smack down the Yen it’s like holding an inflated ball under water…now there is a worthwhile buy the dip trade! 😉
I lost quite a bit trying to enter long on USDJPY. I’m rather wary of it ATM. It’s proven difficult.
It is not very often that you get to line up market makers squarely in the cross hairs. The fact that NDX is in a ridiculous attempt to print a green candle today provides such an opportunity. Reloading triple Qs by way of April 21 132 puts. Taking a bigger bite than usual with 250 contracts @ 0.98 per…will roll on a double to 130 strikes, same expiration. Stop at 133.49. Lock & Load!! 😀
Morning!! First
Good morning Paresh 🙂
I have a long drive home tomorrow through the ravages of ex tropical cyclone Debbie. I’ll have to choose my route to avoid slips. I’ll be stopping in Tauranga to work and rest.
I look forward to “seeing” you all tomorrow on my way 🙂
Drive safely Lara and you will certainly be in our prayers for a transit free of mishap…
Thanks Verne. The road I need is open now, but reduced in parts to one lane so it’ll be slow going. But I’ll get there 🙂