
Monday was expected to begin with a little downwards movement to either 2,358 or 2,354.
Price did move lower, but it reached down to 2,344.73 before bouncing strongly higher.
Summary: The main Elliott wave count expects an upwards breakout that may happen sooner rather than later. It may happen tomorrow. The target is at 2,414 for the short term.
There is still some concern from classic technical analysis for the main Elliott wave count. ADX at the weekly chart level indicates now the trend is extreme. This is most commonly (not always) followed by a few weeks of downwards movement. On Balance Volume at the daily chart level gives a bearish signal.
The alternate wave count is possible.
New updates to this analysis are in bold.
Last monthly and weekly charts are here. Last historic analysis video is here.
MAIN ELLIOTT WAVE COUNT
WEEKLY CHART
Click chart to enlarge.
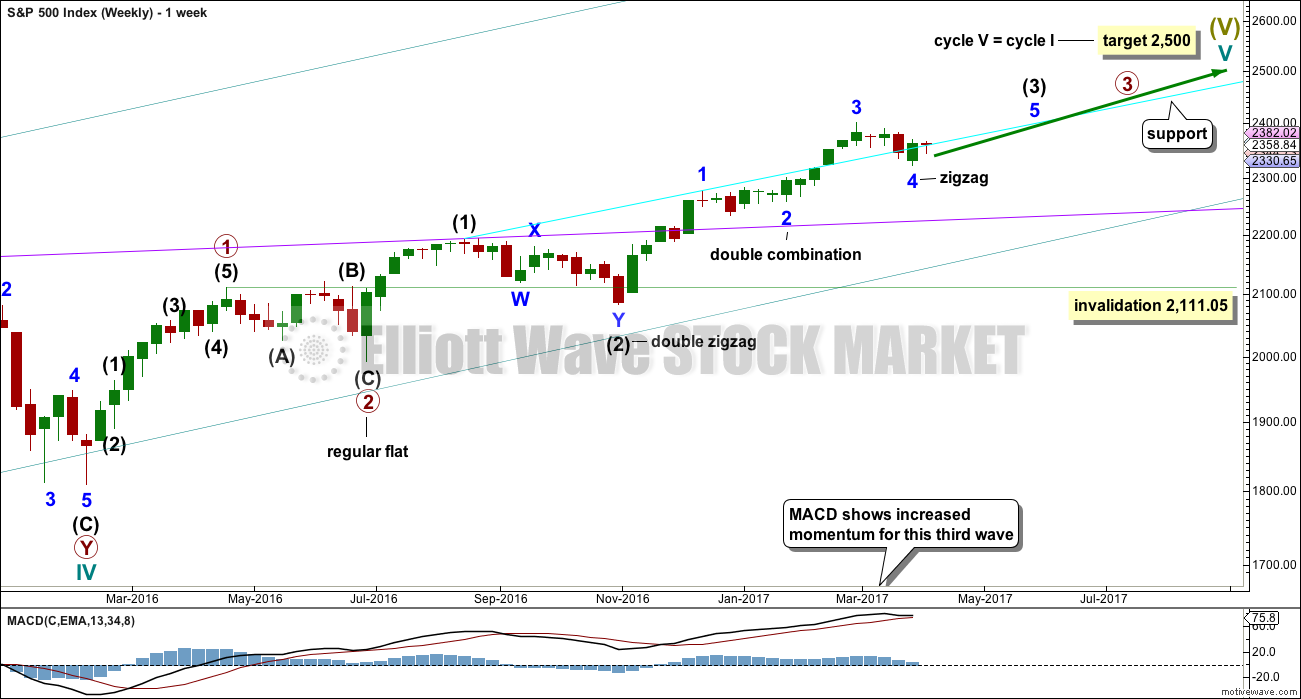
Cycle wave V is an incomplete structure. Within cycle wave V, primary wave 3 may be incomplete or it may be complete (alternate wave count below).
Primary wave 4 may not move into primary wave 1 price territory below 2,111.05.
DAILY CHART
Click chart to enlarge.
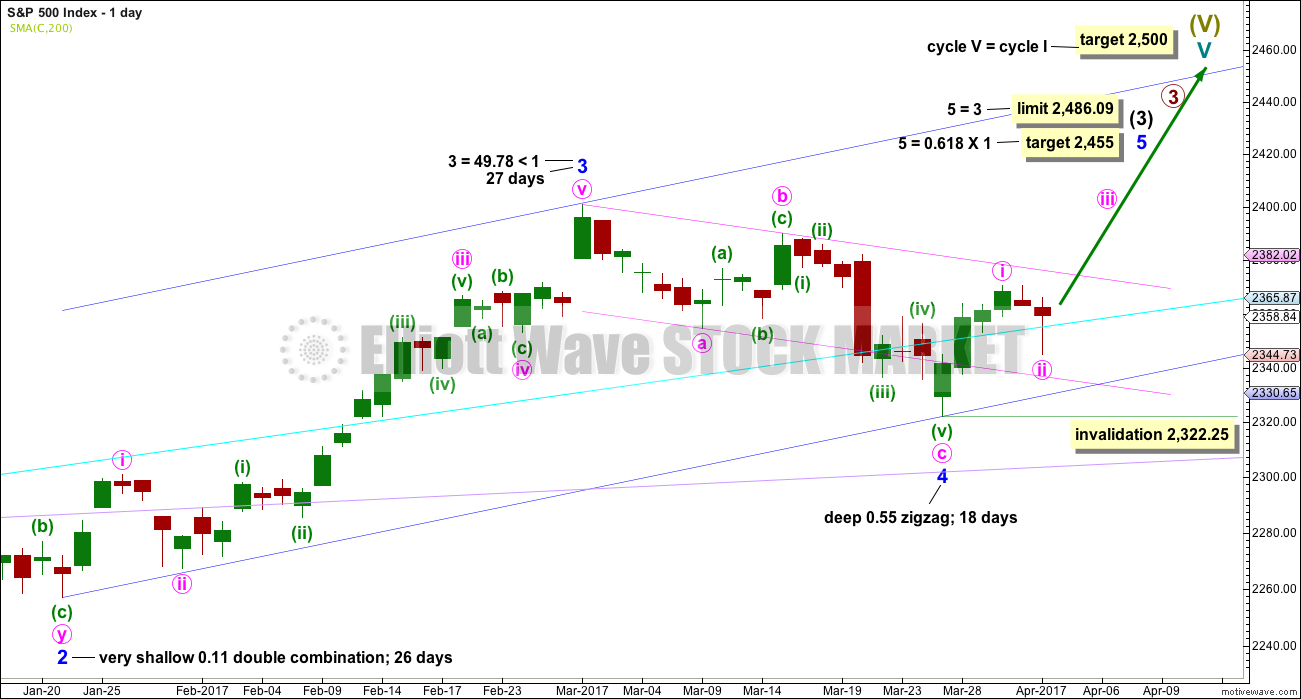
All subdivisions are seen in exactly the same way for both daily wave counts, only here the degree of labelling within intermediate wave (3) is moved down one degree.
This wave count expects the just completed correction is minor wave 4. Within minor wave 5, minute wave ii may not move beyond the start of minute wave i below 2,322.25.
Minor wave 4 is a little below the fourth wave of one lesser degree. Because it has now clearly breached an Elliott channel drawn using the first technique, the channel is now redrawn using Elliott’s second technique. There is good alternation between the very shallow combination of minor wave 2 and the deeper zigzag of minor wave 4.
If minor wave 4 is over, then a target for minor wave 5 is calculated.
The Elliott channel about minor wave 4 is drawn today on the daily chart. The upper edge may be providing some resistance. Once price can break above this channel, then upwards momentum may build.
Minor wave 3 is shorter than minor wave 1. So that the core Elliott wave rule stating a third wave may not be the shortest is met, minor wave 5 is limited to no longer than equality in length with minor wave 3.
HOURLY CHART
Click chart to enlarge.
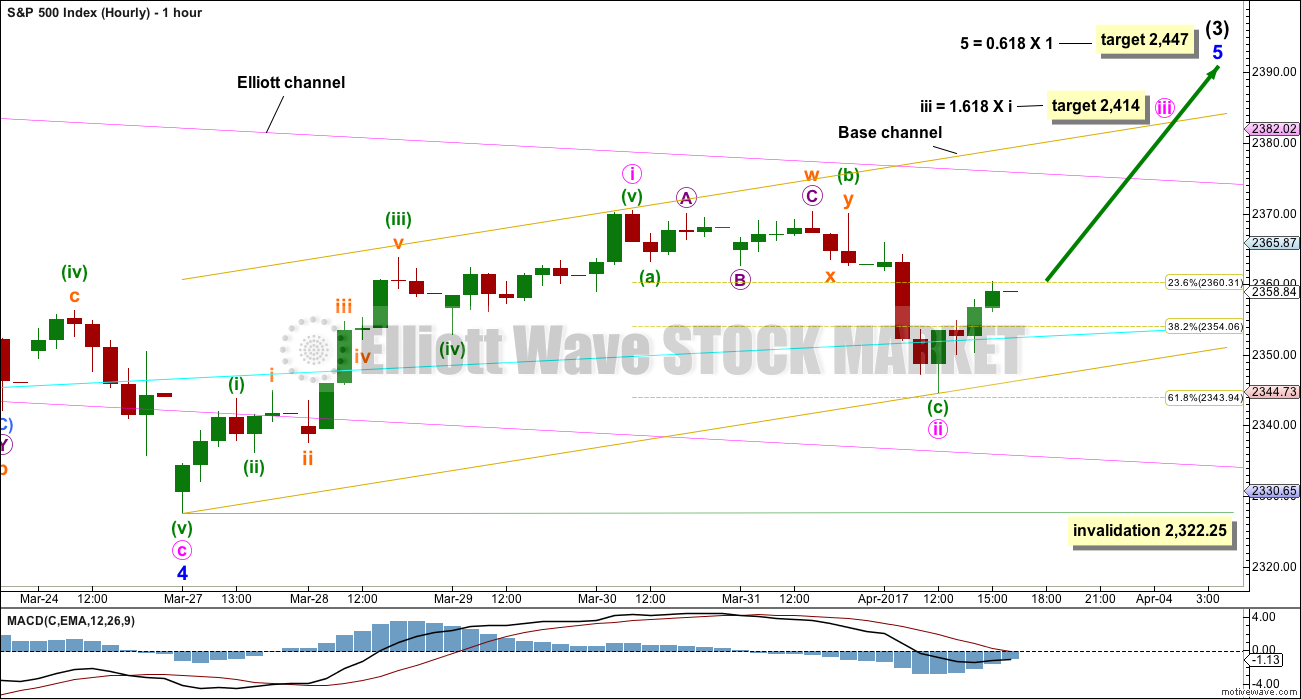
Minute waves i and now ii look complete.
However, it is possible that minute wave ii may continue sideways as a double combination or a flat correction. This risk must be acknowledged. The invalidation point must remain at 2,322.25 for this reason. If minute wave ii does continue, it may not move beyond the start of minute wave i.
If price breaks above the pink Elliott channel, which is copied over from the daily chart, then we may assume that minute wave ii is over and the invalidation point may be moved up to its end at 2,344.73.
Minute wave i lasted a Fibonacci three days. Minute wave ii may be over in a Fibonacci two days. Minute wave iii may be expected to last about a Fibonacci five or eight days at this stage.
ALTERNATE DAILY CHART
Click chart to enlarge.
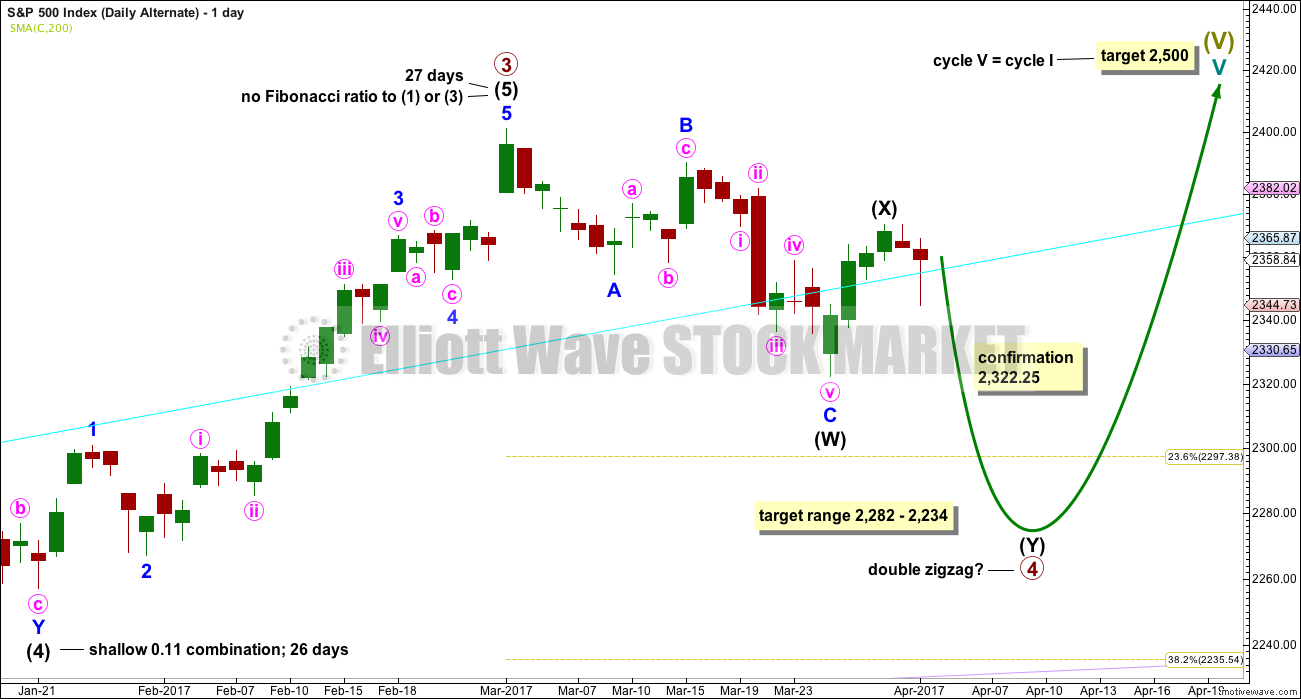
The subdivisions of upwards movement from the end of intermediate wave (2) are seen in the same way for both wave counts. The degree of labelling here is moved up one degree, so it is possible that primary wave 3 could be over.
Primary wave 2 was a flat correction lasting 47 days (not a Fibonacci number). Primary wave 4 may be unfolding as a double zigzag. It may total a Fibonacci 34 or 55 sessions.
Within double zigzags, the X wave is almost always brief and shallow. There is no rule stating a maximum for X waves, but they should not make a new price extreme beyond the start of the first zigzag in the double.
X waves within combinations may make new price extremes (they may be equivalent to B waves within expanded flats), but in this instance primary wave 4 would be unlikely to be a combination as it would exhibit poor alternation with the flat correction of primary wave 2.
For this alternate wave count intermediate wave (X) may now be complete. Both wave counts expect downwards movement: this alternate wave count to new lows for a second zigzag, which would be labelled intermediate wave (Y), and the main wave count for a brief shallow pullback labelled minute wave ii. How low the next wave goes should indicate which wave count is correct. A new low now below 2,322.25 would see the main wave count discarded and this alternate confirmed.
If a new high above 2,400.98 is seen, then this alternate would be discarded.
The correction for primary wave 4 should be a multi week pullback, and it may not move into primary wave 1 price territory below 2,111.05.
TECHNICAL ANALYSIS
WEEKLY CHART
Click chart to enlarge. Chart courtesy of StockCharts.com.
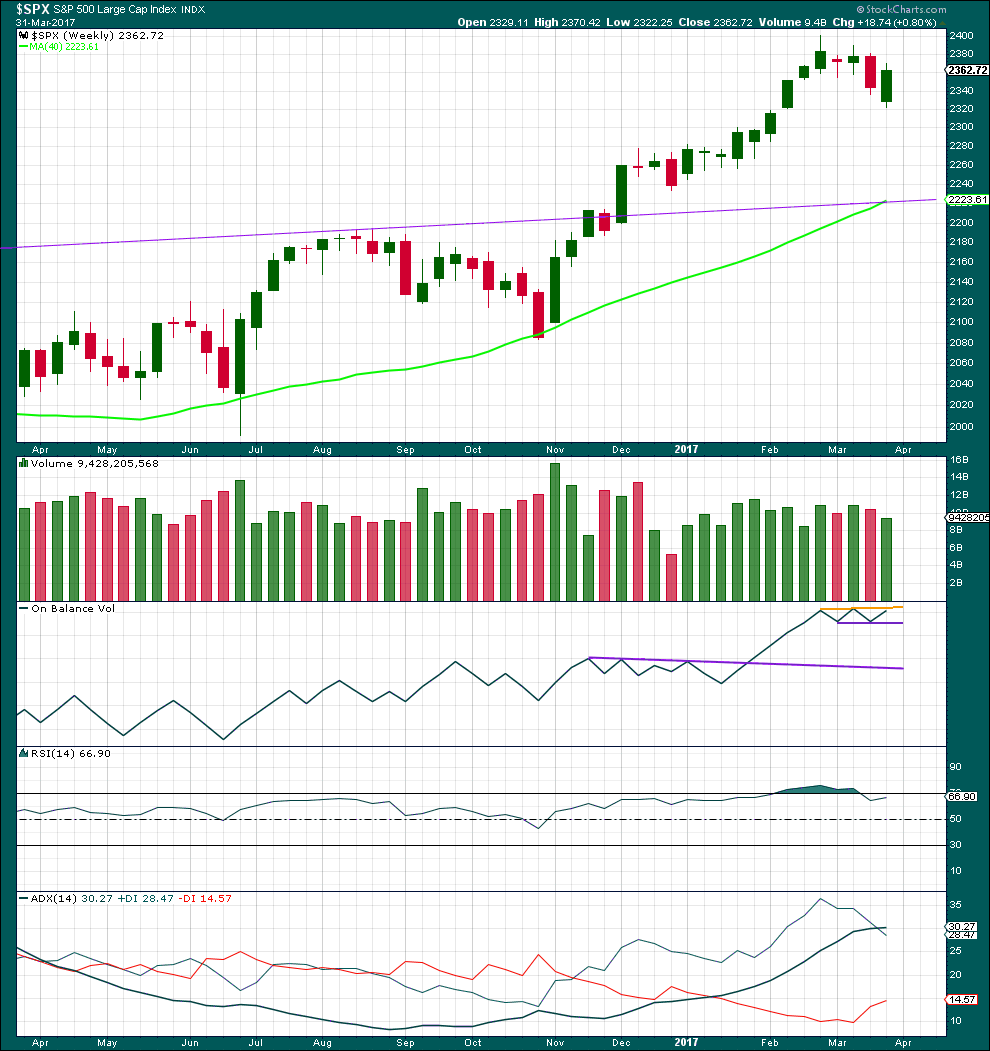
Last week completes a downwards week with a lower low and a lower high, but the week closes green and the balance of volume for the week is upwards. Although price has moved lower, the bulls rallied through to the end of the week to push price up above the open. This is bullish.
On Balance Volume now has a small range and it is constrained within. A breakout above or below would be a reasonable signal.
RSI is not overbought. There is room for price to rise.
ADX is now above both directional lines, so the trend is extreme. Looking back over the last 15 years at instances at the weekly chart level where ADX rose above both directional lines, this was most often followed by at least three or four downwards weeks. In one instance in December 2006 it was not, and this was towards the end of a third wave. In that instance, price continued overall higher for several weeks before a reasonable pullback.
ADX at the weekly chart level favours the alternate wave count, but it does not rule out the main wave count.
DAILY CHART
Click chart to enlarge. Chart courtesy of StockCharts.com.
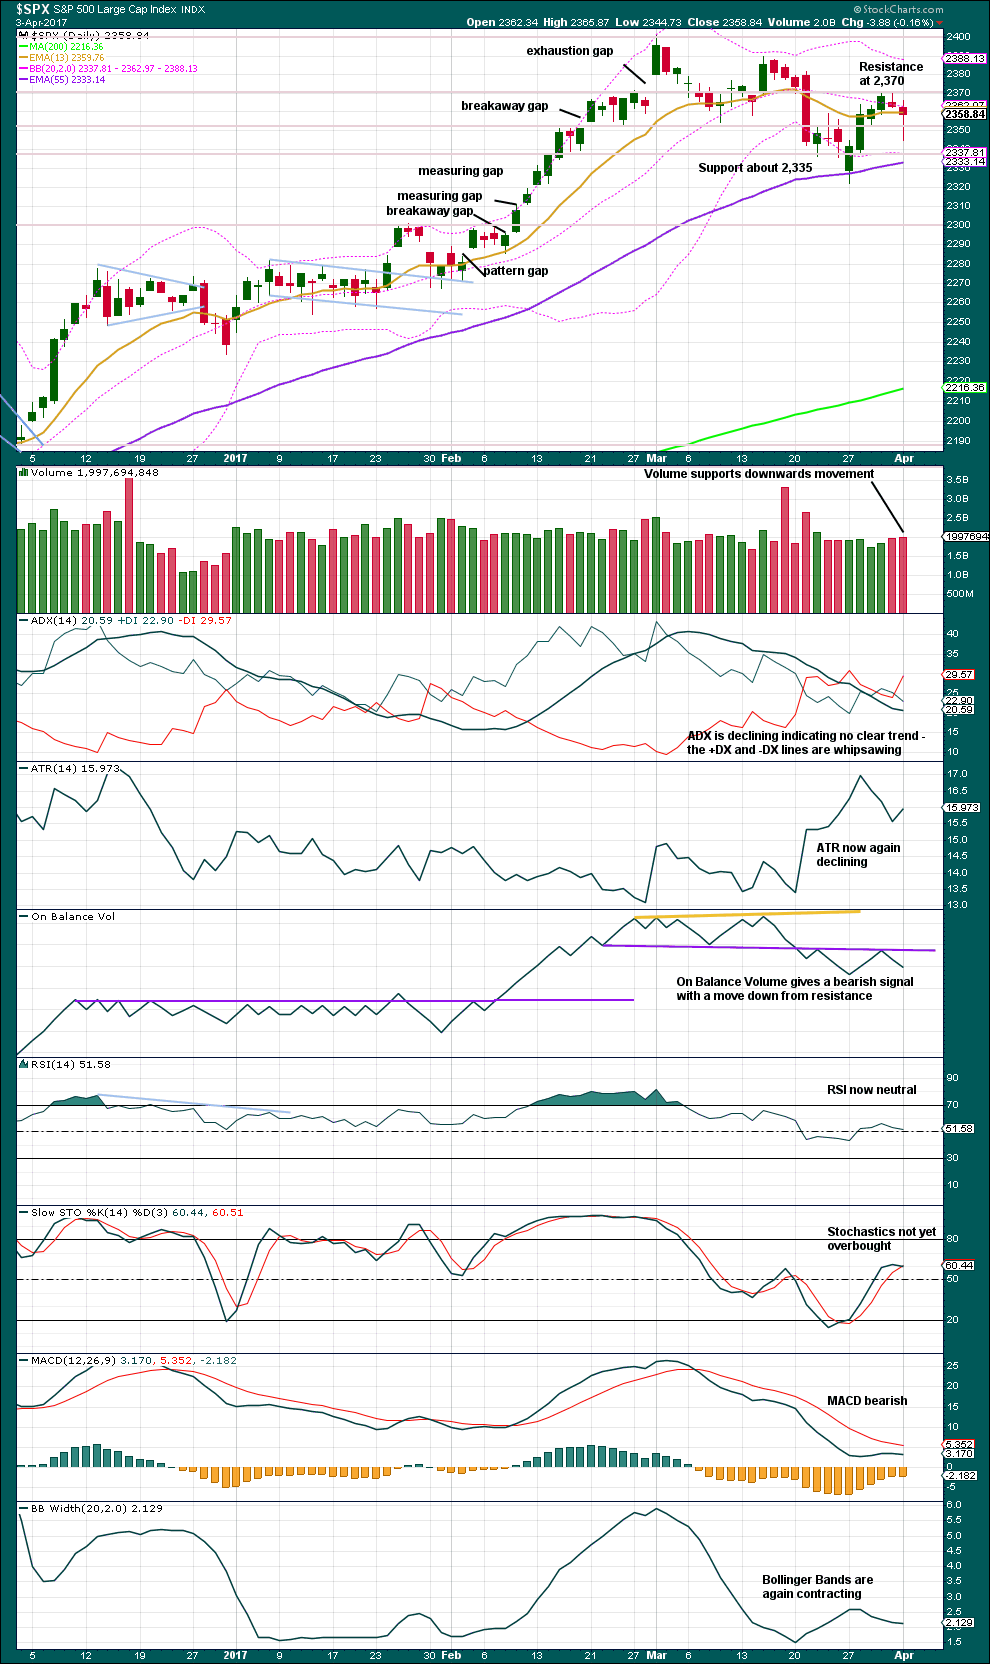
The long lower wick on today’s daily candlestick is fairly bullish. However, this comes essentially within a consolidation and does not come after a downwards trend, so it should not be read as a hammer pattern to signal a reversal.
Volume for the last two downwards days supports downwards movement. This is bearish.
ADX, ATR and Bollinger Bands all agree that this market is not trending. Price is range bound with resistance about 2,370 and support about 2,335.
This classic analysis remains neutral to bearish. A bullish breakout by On Balance Volume would be a strong signal.
VOLATILITY – INVERTED VIX CHART
Click chart to enlarge. Chart courtesy of StockCharts.com.
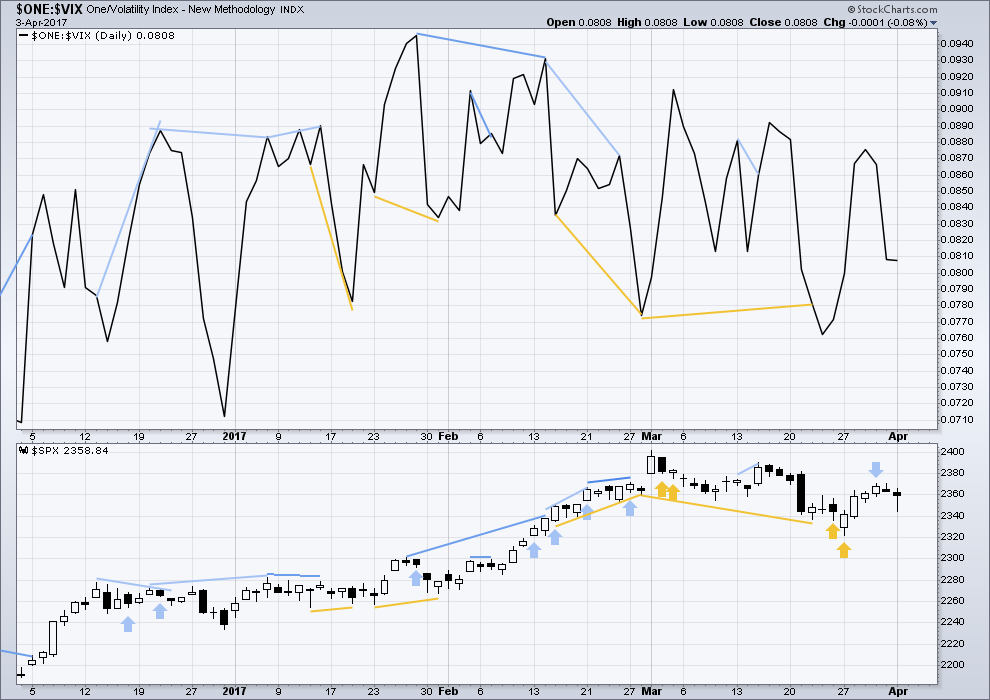
Normally, volatility should decline as price moves higher and increase as price moves lower. This means that normally inverted VIX should move in the same direction as price.
Bearish divergence and bullish divergence spanning a few short days used to be a fairly reliable indicator of the next one or two days direction for price; normally, bearish divergence would be followed by one or two days of downwards movement and vice versa for bullish divergence.
However, what once worked does not necessarily have to continue to work. Markets and market conditions change. We have to be flexible and change with them.
Recent unusual, and sometimes very strong, single day divergence between price and inverted VIX is noted with arrows on the price chart. Members can see that this is not proving useful in predicting the next direction for price.
Divergence will be continued to be noted, particularly when it is strong, but at this time it will be given little weight in this analysis. If it proves to again begin to work fairly consistently, then it will again be given weight.
Bearish divergence noted by the recent blue arrow has been followed by two red daily candlesticks now. It may now be resolved.
There is no new divergence noted today between price and inverted VIX.
BREADTH – AD LINE
Click chart to enlarge. Chart courtesy of StockCharts.com.
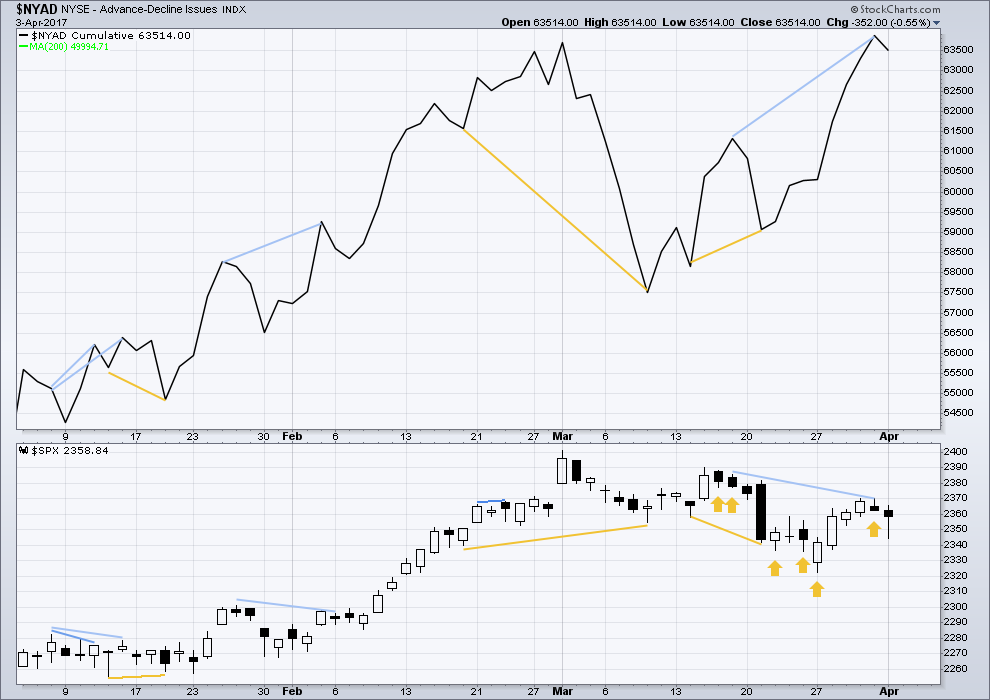
The rise in price has support from a rise in market breadth. Lowry’s OCO AD line also shows new highs along with price. Normally, before the end of a bull market the OCO AD line and the regular AD line should show divergence with price for about 4-6 months. With no divergence, this market has support from breadth.
There is short term bullish divergence between the AD line and price from yesterday’s low to the low of 14th of March (and also back to the 9th of March). Price has not come with a corresponding decline in market breadth while it has made a new low. There is weakness within this downwards movement from price. This supports the main hourly Elliott wave count which sees a low in place.
There is still short term bearish divergence today between the highs of the 17th and 31st of March. This indicates weakness in price and it may be followed by one or two downwards days. This divergence has now been followed by two red daily candlesticks, so it may be resolved.
DOW THEORY
The DJIA, DJT, S&P500 and Nasdaq continue to make new all time highs. This confirms a bull market continues.
This analysis is published @ 07:19 p.m. EST.
Good morning everybody, I’m sorry I wasn’t here to give my usual pre close update today.
It looks like minute wave ii is continuing. At this stage it looks like a double zigzag, but it could turn into a flat or combination still.
A double zigzag may move lower to test support at the lower edge of the pink channel. A combination or flat would just be sideways.
What if the markets rally tomorrow? Starting to appear as though they may.
I had a moment to check in on the markets. I am stopped out of my longs with a small gain. Now I can attend to other matters without concern for any trading positions. See ya!
Great news! Gotta mind those stops. It is still a trader’s market- a place for either the quick or the dead! 🙂
Grabbed a nice profit yesterday going short, but got kicked off twice this morning trying to go long (short-term trades). As of right now, mid-day, it looks to me like we might be making a choppy x-wave in a more complex downward correction, or possibly a series of upward 1-2 moves?
It’s looking pretty unclear to me at the moment…
Correction… considering more carefully, I think I’m seeing 3s, not 5s since yesterday’s low.
I look forward to Lara’s thoughts.
I think minute ii is continuing sideways.
LOL! The market makers muust be reading Lara’s site. All of a sudden those SPG spreads have seen a quite dramatic improvement…He! He! 🙂
Adding to SPG 170 puts. The market makers are playing games with the put option bids. If they continue to refuse to bid at least the intrinsic value of the options don’t be afraid of option exercise even if your account would not normally allow it. If your broker does not force liquidation, you can always cover the short sale at a much fairer price than the thieving market makers offer trying to rob you…they will also often pay better than the stated bid if you are trying to exit…
Smoke and mirrors everywhere! Relentless selling of volatility in the face of very obvious market weakness. We should get some fireworks soon; what direction remains to be seen…
SPG, like Wile ‘E Coyote with legs churning several yards away from the edge of the cliff, is just waking up to the fact that it has no business trading at the upper range of its BB. It has just started a descent from rarefied air back down to the reality of being a walking dead man. Holding 170.00 puts for an anticipated double. Cheers! 🙂
PS Hope you took advantage of Lara’s analysis of DDS awhile back. It has a long way to go imho…
A few observations about price action yesterday that warrant tight stops for long trades imho. The banksters clearly did a creditable job in buying the market off the low of the day but since they went to all that trouble, there were two technical feats that would have made the bounce more believable – a reclaim of a prior support area, and/or a penetration of the underside of the broken wedge. They accomplished neither and one has to wonder, why not? After all if they are intending to maintain a perception of bullish potential, these two items would not have gone un-noticed. The answer I think is self-evident- they could not.
The absence of downside momentum suggests that this is nonetheless still a correction against the larger upward trend. When this market finally tops, there will be none of the nonsense we saw yesterday of banksters buying the market off the lows of the day. The decline will be relentless and unstoppable. Long trades in the market remain at historic levels and Mr. Market usually shakes out some of those positions ahead of the next leg up…and he probably will…..
Nice Verne, although I feel as though their efforts greatly diminish the time we spend analyzing. I do see them losing control sooner rather than later, and risks are mounting quickly. Real Estate here in FL has now rolled over with authority.
Can I pick up a cheap beachfront hangout? 🙂
But seriously, I expect we will see some rreal bargains in the next 12 to 18 months. Even the national big players are now triying to offload their bloated inventory on potentally “greater fools” Homeowners are also starting to wake up to the harsh reality that local governments intend to remedy revenue shortfalls by taking them to the cleaners. I suspect the rush to escape rapacious local taxes will be a significant factor in mushrooming inventory, which of course means lower prices…what a mess we have on our hands!
Not yet but you will. And further, all counties are prepared to raise fees on permits, licenses, vehicles, and services as well as stand ready to raise property and sales taxes. It never ceases to amaze me how much government officials feel they are entitled to other peoples money and resources. On another note, I’m pretty darn tired of seeing these ridiculous rising wedges over and over and over and over again.
It is absolutely beyond belief! As I opined, the banksters are all in and I am now wondering how it is all going to end. It really seems to me that they are convinced that they cannot afford the slightest correction in this market…the wedges never end!!
Thanks. I need to travel for the next two days. So I may not be able to check in. I have my stops set below today’s low which would be a profitable trade. But I am hoping the low of this correction is over. Have a great evening all.
Safe travels Rodney.
I sure do hope I’ve got my analysis right and your longs aren’t stopped out by a whipsaw!
Make sure stops are tight! Have a great trip Rodney. See you in a few..