
Downwards movement continued, as expected, and found support at three different trend lines.
Summary: It is reasonably likely that downwards movement may halt here because price is at multiple support lines and exhibits bullish divergence with the AD line. A new high above 2,377.18 would confirm a low in place and the next wave up. A green daily candlestick tomorrow would add confidence in this view.
It is possible that a deeper correction may continue here for another few weeks while price remains below 2,377.18, as per the alternate wave count.
New updates to this analysis are in bold.
Last monthly and weekly charts are here. Last historic analysis video is here.
MAIN ELLIOTT WAVE COUNT
WEEKLY CHART
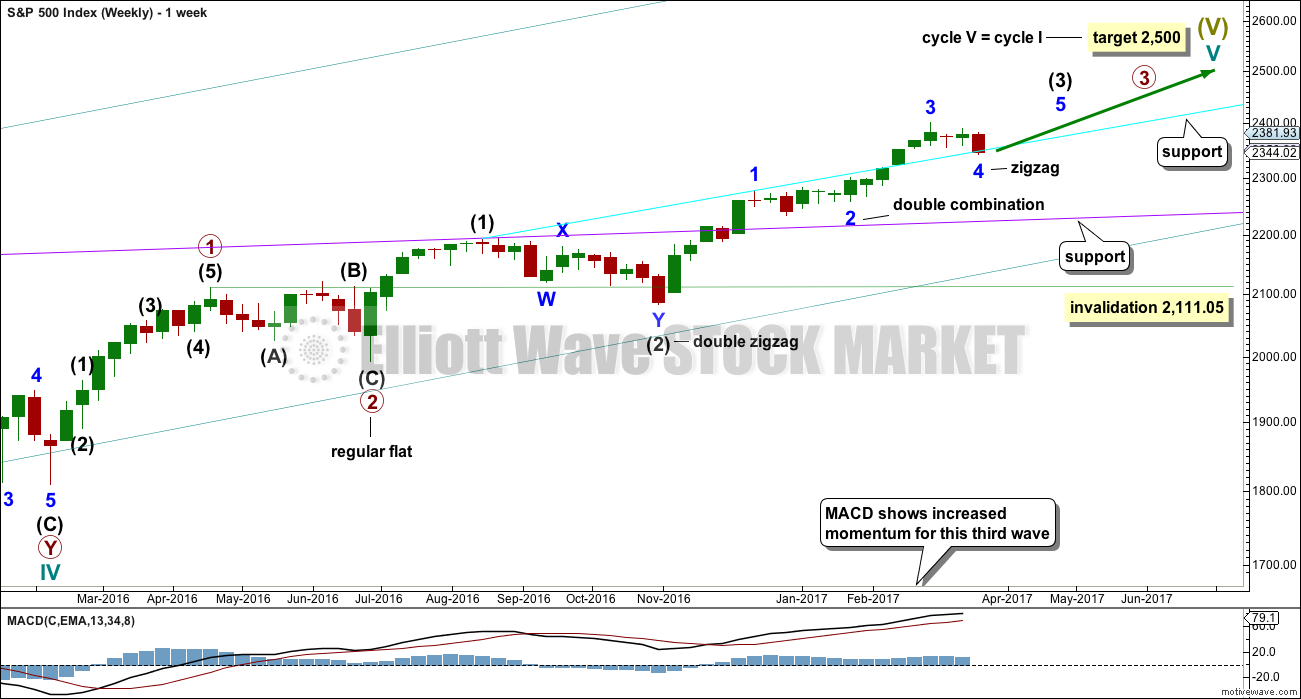
Click chart to enlarge.
Cycle wave V is an incomplete structure. Within cycle wave V, primary wave 3 may be incomplete or it may be complete (alternate wave count below).
Primary wave 4 may not move into primary wave 1 price territory below 2,111.05.
As price moves lower look for support at each of the longer term trend lines drawn here across previous all time highs. The cyan trend line, which was met today, may provide support. (The trend line has been copied over to hourly charts.) If price keeps falling here, then look for next support about the lilac line.
DAILY CHART
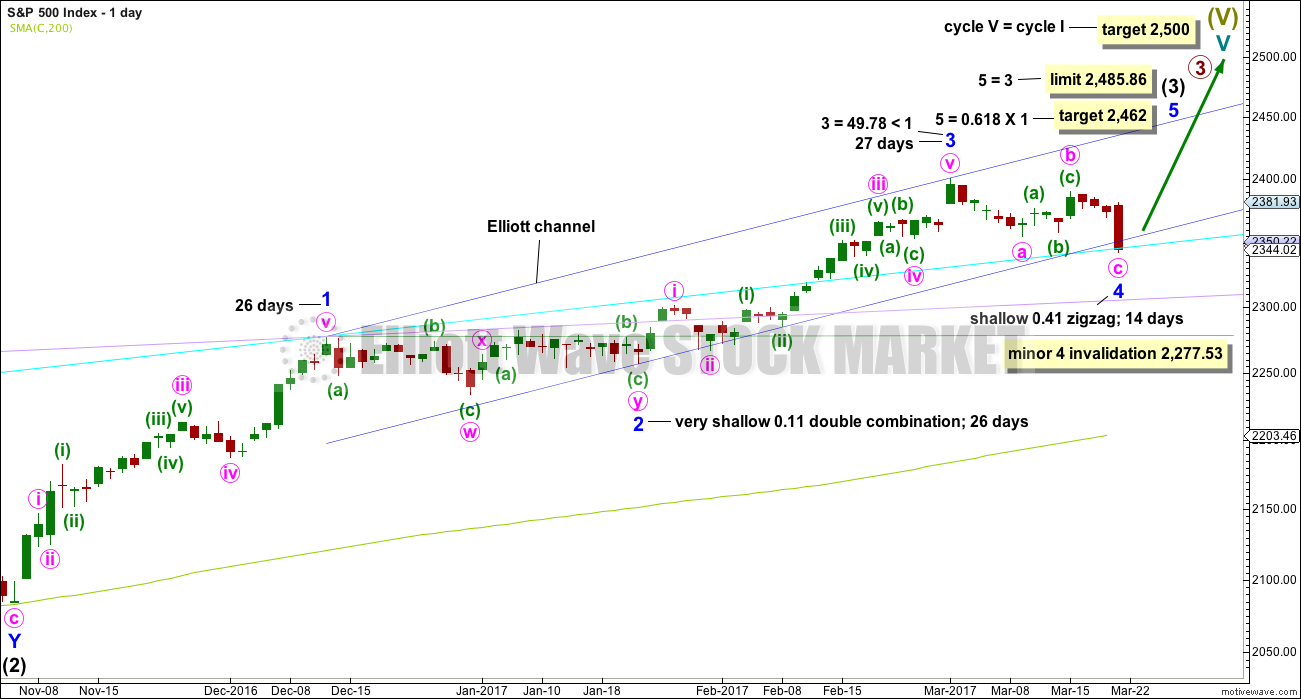
Click chart to enlarge.
All subdivisions are seen in exactly the same way for both daily wave counts, only here the degree of labelling within intermediate wave (3) is moved down one degree.
This wave count expects the current correction is minor wave 4, which may not move into minor wave 1 price territory below 2,277.53. A new low below this point would confirm the correction could not be minor wave 4 and that would provide confidence it should be primary wave 4.
Minor wave 4 is a little below the fourth wave of one lesser degree and may have ended today with a small overshoot of the blue Elliott channel and finding support at the cyan trend line. There is good alternation between the shallow combination of minor wave 2 and the deeper zigzag of minor wave 4.
If minor wave 4 is over, then a target for minor wave 5 is calculated. If minor wave 4 continues lower, then this target must also move correspondingly lower.
Minor wave 3 is shorter than minor wave 1. So that the core Elliott wave rule stating a third wave may not be the shortest is met, minor wave 5 is limited to no longer than equality in length with minor wave 3. If minor wave 4 continues lower, then this limit must also move correspondingly lower.
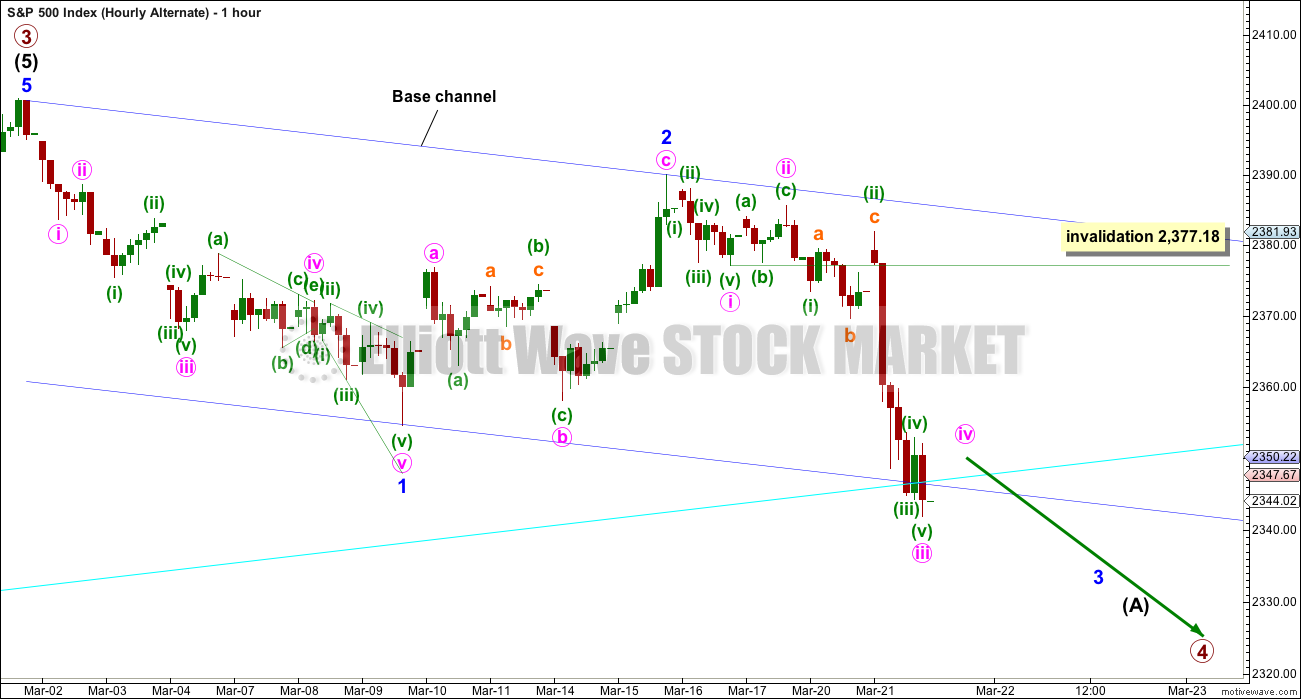
HOURLY CHART
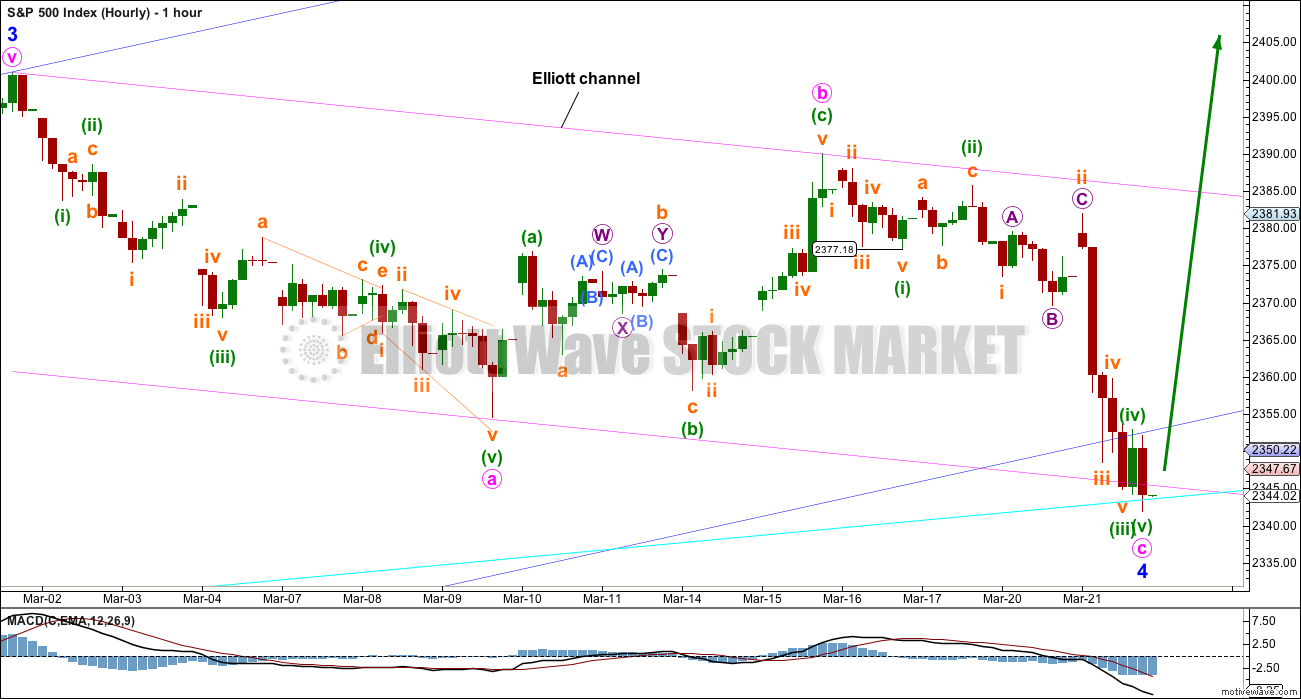
Click chart to enlarge.
Minor wave 4 may now be seen as a complete structure. The impulse of minute wave c may be complete.
Within minute wave c, if the correction for minuette wave (iv) is time consuming and moves sideways, then it may not move into minuette wave (i) price territory above 2,377.18. A new high above this point would indicate the structure of minute wave c should be over, and so minor wave 4 in its entirety would be very likely then to be over.
Minor wave 4 may have ended with a small overshoot of the blue Elliott channel, a very small overshoot of the pink Elliott channel, and a minuscule overshoot of the cyan trend line.
Minute wave c is just 1.67 longer than equality in length with minute wave a.
If tomorrow prints a green daily candlestick, the probability of a low in place for minor wave 4 would increase.
ALTERNATE DAILY CHART
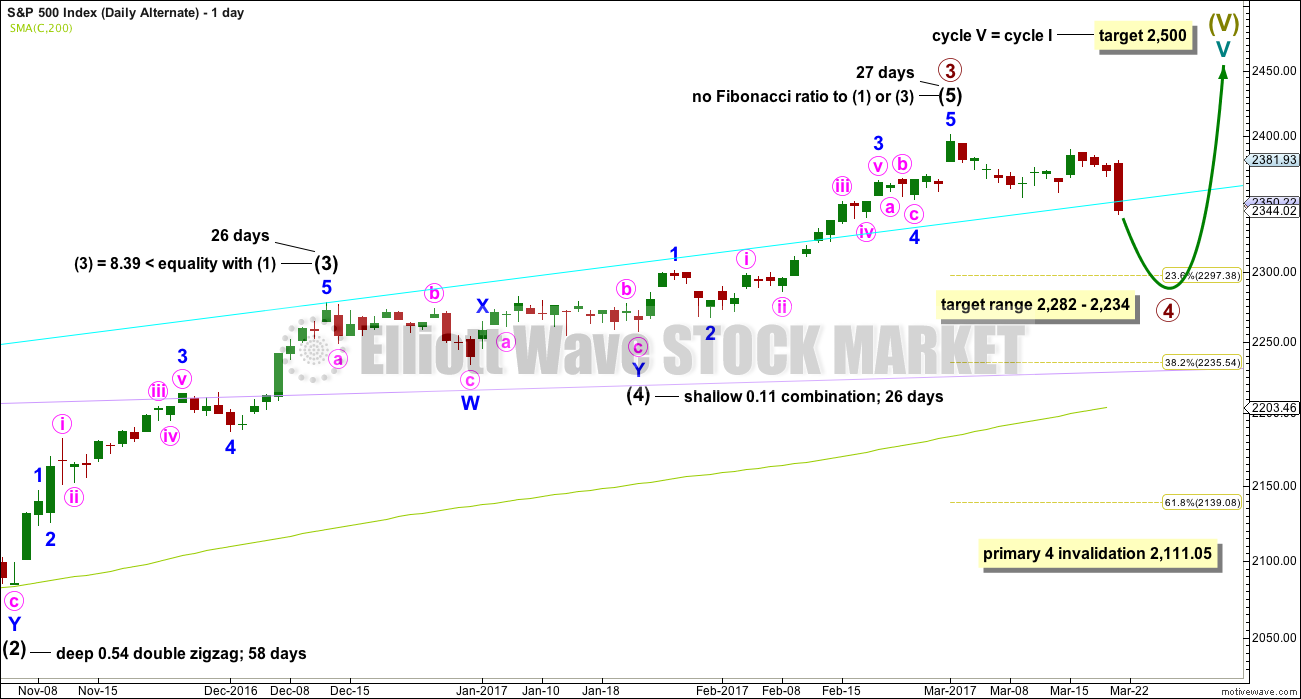
Click chart to enlarge.
The subdivisions of upwards movement from the end of intermediate wave (2) are seen in the same way for both wave counts. The degree of labelling here is moved up one degree, so it is possible that primary wave 3 could be over.
Primary wave 2 was a flat correction lasting 47 days (not a Fibonacci number). Primary wave 4 may be expected to most likely be a zigzag, but it may also be a triangle if its structure exhibits alternation. If it is a zigzag, it may be more brief than primary wave 2, so a Fibonacci 21 sessions may be the initial expectation. If it is a triangle, then it may be a Fibonacci 34 or 55 sessions.
Intermediate wave (3) is shorter than intermediate wave (1). One of the core Elliott wave rules states a third wave may never be the shortest wave, so this limits intermediate wave (5) to no longer than equality in length with intermediate wave (3). If intermediate wave (5) is now over, then this rule is met.
Minor wave 3 has no Fibonacci ratio to minor wave 1. If minor wave 5 is now over, then it is 4.14 points longer than equality in length with minor wave 3.
Intermediate wave (5) may have ended in 27 days, just one longer than intermediate waves (3) and (4). This gives the wave count good proportions.
The proportion here between intermediate waves (2) and (4) is acceptable. There is alternation. Both are labelled W-X-Y, but double zigzags are quite different structures to double combinations.
The following correction for primary wave 4 should be a multi week pullback, and it may not move into primary wave 1 price territory below 2,111.05.
ALTERNATE HOURLY CHART
Click chart to enlarge.
In the short to mid term, the wave counts now diverge, so it is time to publish an hourly chart for this alternate.
Primary wave 2 was a flat correction, so it is most likely that primary wave 4 would unfold as a zigzag. So far, within the zigzag, intermediate wave (A) may be an incomplete impulse.
So far minor waves 1 and 2 may be complete within intermediate wave (A). Minor wave 3 may be incomplete. If it was over at today’s low, there is hardly enough room for the following correction of minor wave 4 to unfold and remain below minor wave 1 price territory.
Within minor wave 3, the correction for minute wave iv may not move into minute wave i price territory above 2,377.18.
TECHNICAL ANALYSIS
WEEKLY CHART
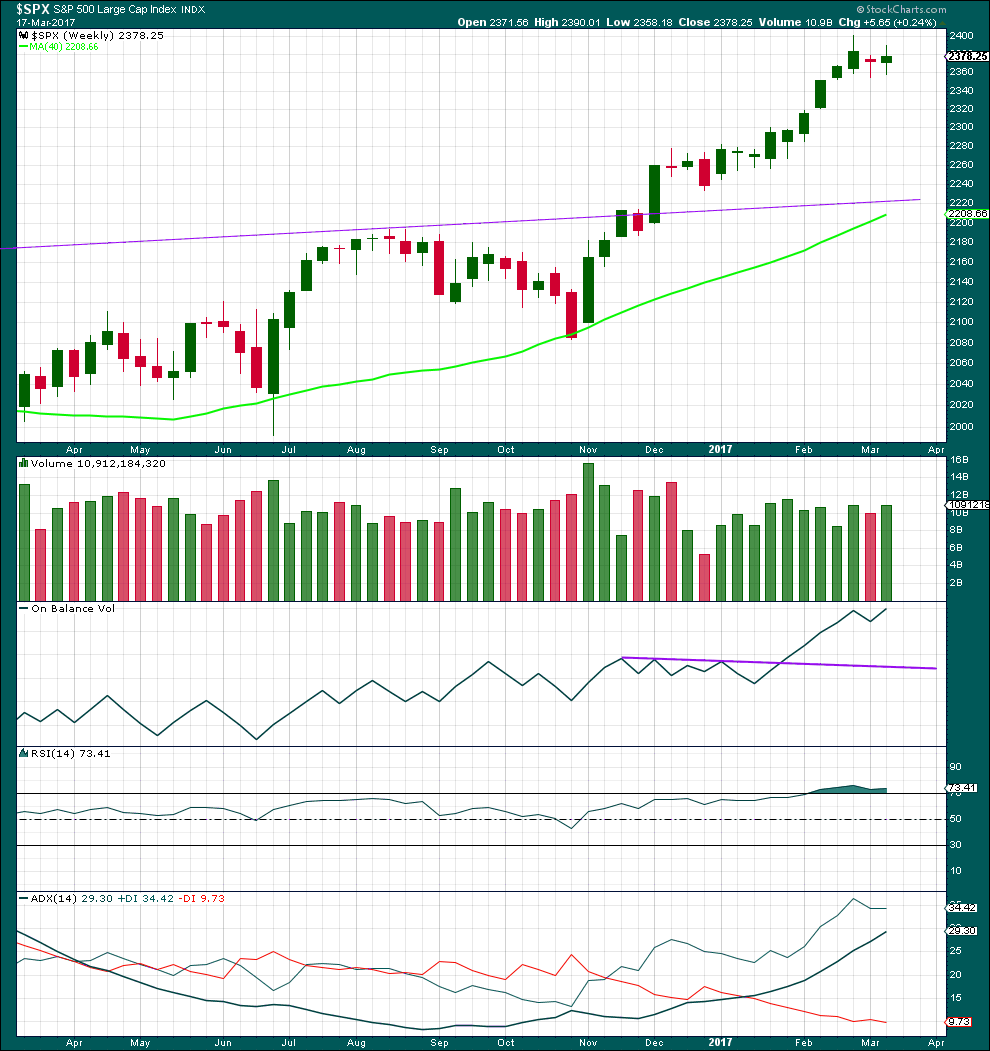
Click chart to enlarge. Chart courtesy of StockCharts.com.
A red doji for the previous week to last week and a small real body for last week look corrective. A small correction looks to be unfolding within a larger upwards trend.
A small increase in volume last week offers some support for upwards movement, but to read this more accurately we should look inside the week at daily candlesticks.
RSI is still extreme, but it may remain so for reasonable periods of time during a trending market. ADX is not yet extreme, so there is room for this trend to continue.
DAILY CHART
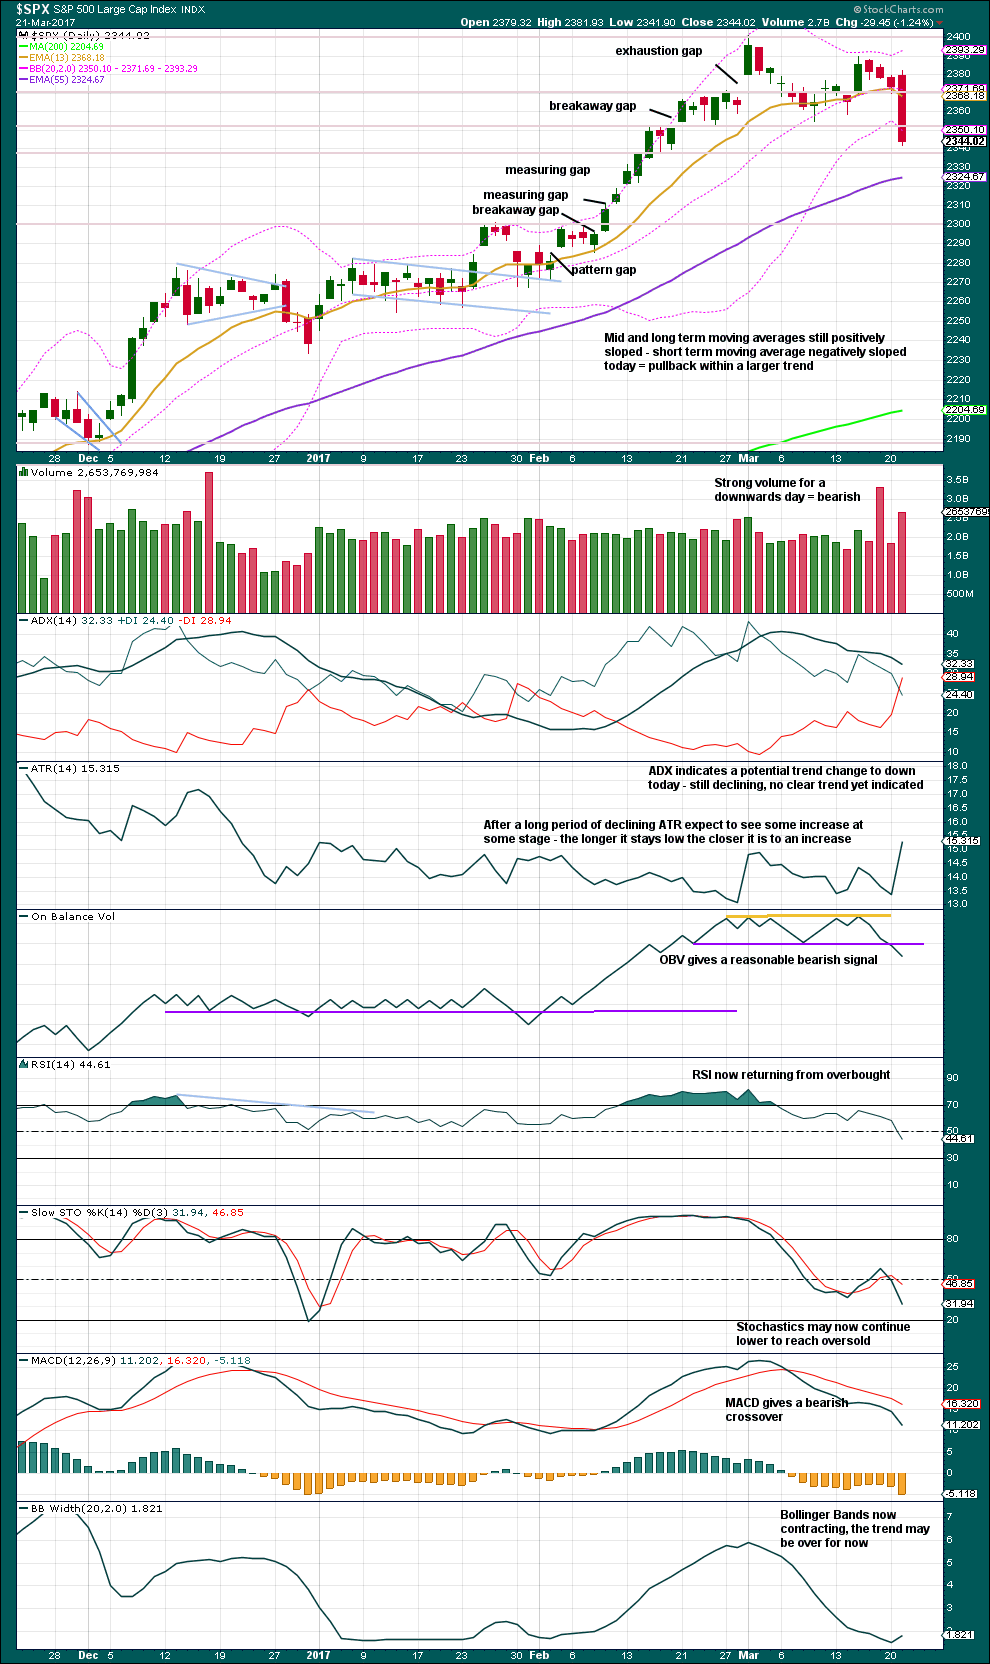
Click chart to enlarge. Chart courtesy of StockCharts.com.
Price has broken out of a consolidation zone, which had support about 2,400, on a downwards day with an increase in volume. The fall in price today was supported by volume; bears were active. The next support is about 2,340.
ADX has still not been able to move back below both directional lines after reaching extreme for the prior upwards trend; it has only just moved below 35. ADX today signals a potential trend change from up to down with the -DX line crossing above the +DX line. The ADX line needs to increase for a new trend to be indicated though and currently ADX is still declining.
On Balance Volume gives a bearish signal today, but this is not strong. This line has only been tested twice before, so it does not have good technical significance. A prior support line is added today to OBV in purple. Notice the false bearish signal given on the 31st of January. The current bearish signal should be stronger for it to be more reliable. It would have more weight if tomorrow also moves OBV lower.
Neither RSI nor Stochastics are oversold. There is room for downwards movement to continue.
VOLATILITY – INVERTED VIX CHART
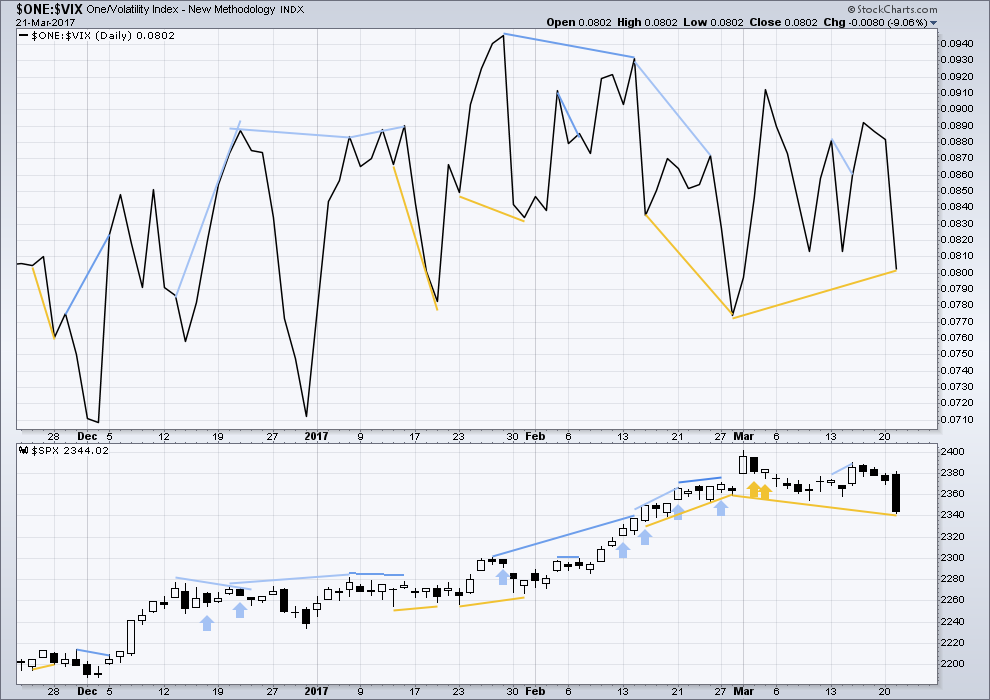
Click chart to enlarge. Chart courtesy of StockCharts.com.
Normally, volatility should decline as price moves higher and increase as price moves lower. This means that normally inverted VIX should move in the same direction as price.
Bearish divergence and bullish divergence spanning a few short days used to be a fairly reliable indicator of the next one or two days direction for price; normally, bearish divergence would be followed by one or two days of downwards movement and vice versa for bullish divergence.
However, what once worked does not necessarily have to continue to work. Markets and market conditions change. We have to be flexible and change with them.
Recent unusual, and sometimes very strong, single day divergence between price and inverted VIX is noted with arrows on the price chart. Members can see that this is not proving useful in predicting the next direction for price.
Divergence will be continued to be noted, particularly when it is strong, but at this time it will be given little weight in this analysis. If it proves to again begin to work fairly consistently, then it will again be given weight.
There is mid term divergence today between inverted VIX and price from today’s low to the low of 28th of February. This divergence is bullish, but it will be given very little weight.
BREADTH – AD LINE
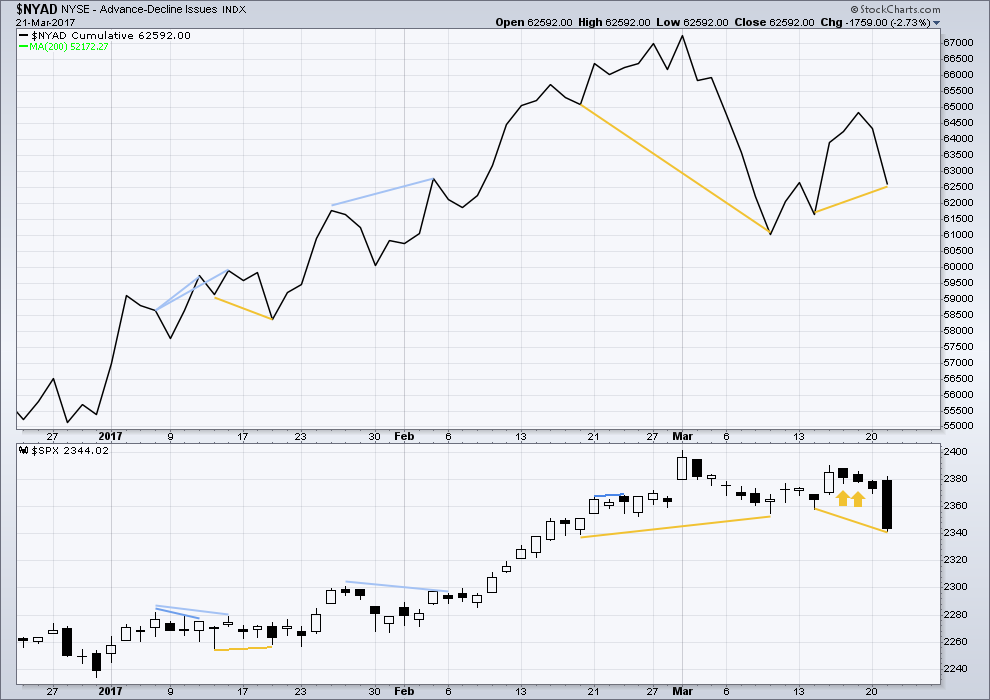
Click chart to enlarge. Chart courtesy of StockCharts.com.
The rise in price has support from a rise in market breadth. Lowry’s OCO AD line also shows new highs along with price. Normally, before the end of a bull market the OCO AD line and the regular AD line should show divergence with price for about 4-6 months. With no divergence, this market has support from breadth.
There is short term bullish divergence today between the AD line and price from today’s low to the low of 14th of March (and also back to the 9th of March). Price has not come with a corresponding decline in market breadth while it has made a new low. There is weakness within this downwards movement from price. This supports the main hourly Elliott wave count which sees a low in place today.
DOW THEORY
The DJIA, DJT, S&P500 and Nasdaq continue to make new all time highs. This confirms a bull market continues.
This analysis is published @ 12:10 a.m. EST on 22nd March, 2017.
Thank you, Lara! Thank you for your analysis and willingness to make a declarative statement. Such a statement helped me hold on today and as a result, realized a nice profit. Here’s the story:
On March 14, with SPX at 2370, I opened an Iron Condor ofSPX put spreads and calls spreads that expired today, March 22. The short Put had a strike of 2340. It was looking real good on Monday. But then the SPX dropped 30 points on 3/21/17 and then it was not looking so good! The index was at 2344. There were a few moments when I considered buying back the short put, at a large loss, to limit further losses if SPX declined more. But I recalled your analysis and did not do anything. So I was anxiously awaiting your analysis of 3/21/17.
Your early sentence: “Summary: It is reasonably likely that downwards movement may halt here because price is at multiple support lines and exhibits bullish divergence with the AD line” was clear. I did nothing, held on as the index dropped below 2340, and I let the Condor fly to expiration at the end of the day as the SPX closed at 2348. I realized a big profit.
Due to your analysis and style of writing, I stayed the course. You help me realize a gain of 43% return on risk or 15% return on margin. In 8 days.
Thank you! Keep up the good work.
Lance
Way to go, Lance and thanks for your insight. Lara’s analysis has almost been like a script. Definitive statements are difficult to come by in the financial analysis world. Lara’s targets, alternates and ‘what if’s’ provide as much value as well. The markets never make it easy. So when we have a very good trade, we celebrate. Thanks for letting us celebrate with you.
My goodness, I’m so relieved Lance! Happy to hear I was able to help you profit. That’s my job after all 🙂
Nerve wracking these markets, aren’t they.
I suspect that may be all she wrote for the drop now.
If this was minor wave 4 then it looks over today. However, we still need a new high above 2,377.18 for confidence in this view.
If this is the case, and the target for Minor 5 is 2456 to 2480, we have a 100 to 130 point up move directly ahead. I’d like to capture 75 to 100 of those points. So, I am thankful when you give us confidence points / marks. I am looking forward to seeing those.
The IWM leveraged 3X bull, URTY, closed today just under $114. Three weeks ago I sold my longs at $132 (within $1 of the top). A lot of luck there. If Minor 4 is over and we are going to SPX 2450+, and if the IWM moves similarly, URTY will be well north of 133, a 16% move. Of course, a person could trade UPRO or any of the leveraged index ETF’s. The beauty of a long trade here is that the downside / sell stop is very nearby, the low of today. That is 0.5% stop loss (without any gap lower).
I think I will see if the low holds and start looking for a long position entry. Could be tomorrow. If the low does not hold, we look for divergences and a retest. If it keeps going up from here, the confidence points are crucial to help determine the entry point. (I am watching 2320.)
I do not use margin or time sensitive issues like options. I have proved enough times those don’t work so well with me.
That’s my plan anyway. Who knows, by tomorrow morning I may change my mind three times! Have a great evening.
I’m waiting on the sidelines too Rodney. Today’s small candlestick isn’t a strong bullish looking day, although the lower wick is relatively long. Volume is light compared to yesterday, but stronger than two of the four downwards days….
It’s a mixed bag really. We certainly could see new lows.
The invalidation point for minor 4 has to be still 2,277.53 though, so that would potentially be a nasty loss for any long positions entered here though.
I’m not going to put a closer invalidation point on the hourly chart until we get some strong bullish signals and / or price making a new high above 2,377.18.
On Balance Volume is right at resistance.
That should read, “I am watching 2320 as a possible low target, if the current low does not hold.” I am not convinced the low is in for Minor 4. But that is okay. I don’t need to catch the very bottom.
I’ve also looked at my weekly and monthly charts. I am not seeing things that give me confidence on the long side. If we go up into the mid 2400’s from here, Vern is correct in asserting the correction after Minor 5 completes is going to be worse.
Adding to UVXY 19.00 calls at 0.45 per contract….
3/4 full cache….
Oversold bounce in the Qs a bit more vigorous today. Buying the triple Qs 130 puts expiring this week for 0.30 per contract. Target 300% at 1.00 per contract in the next 72 hours…
At the moment, the SPX daily candle is below the lower BB. We know this can and does continue sometimes. But so often we see a quick move back inside the BB’s. We could be getting near a bottom or at least a temporary pause in the downward move.
Also note, the last time the SPX was below its daily BB was Friday, Nov. 4, 2016. I think that was the end of Intermediate 2 of Lara’s Main Count.
Volatility has been so violently suppressed during the last run-away leg higher that the BBs remained quite compressed. VIX also penetrated its upper BB today and that would normally signal an imminent reversal. Hard to say, under the conditions with BBs so close together, how significant a penetration after a 1 day decline, really is. Yesterday’s break out of the rising wedge on so many instruments is very technically significant. I am expecting a typical rise to test the underside of the broken wedge and a resumption of the decline near term. If that is a correct assessment, the most violent part of this decline is still ahead of us I am afraid…for the bulls that is…. 🙂
The SPX also moved below its 13 & 34 day ema. The 50 day ema is at 2332 or so just beneath current prices.
I was looking at that today. I think it would have been more short term bullish if we had fallen at least to the 50 day MA and had a bounce there. I have a feeling that it may not provide resistance on the next leg down…I guess we will see…have a great evening everybody…see ya in the trenches!
Hard to believe that market makers have not yet widened the spreads on volatility. You can still buy UVXY 20 calls for next week with a minimal 1.00/1.04 bid/ask.
The level of complacency in the market is truly astonishing.
Absolutely no one believes this market, despite the technical damage inflicted by yesterday’s drop, has put in a significant top. Grand Super Cycle sentiment I guess…..
17.50 calls now trading at 1.10
Adding another 1/4 cache at strike price of 19.50 for 0.49 per contract….
Easing back into UVXY 17.50 strike calls expiring this week. 1/4 cache at 0.68 per contract…..
Sold 1/2 next week’s expiration UVXY 20 strike calls or 1.00 even.
Will roll into this week’s 20 strike expiration on any intra-day bounce.
While we have not seen a true capitulation spike in volatility for quite some time, the level of bullishness coming off this recent top greatly increases the chances that we will see one at the conclusion of this decline. The biggest volatility bang for the buck will come from options expiring the same week of the spike. How we close today should tell us if we are in a minor or primary wave down methinks. Top O’ the mornin’ all!
With SPX currently at 2337, it looks like Minor 4 has a bit more to go to the downside. There is a gap on the hourly chart at 2320 from February 17th. Maybe it will be filled and provide some support.
We had a remarkable number of gaps since the November 4th low. If we are in a primary degree wave down they will all be filled.
Thanks Lara for the alternate hourly chart as well as all the others. The volume today is pretty impressive relative to the last several weeks. We can say it was a strong down day. I am still sitting on the sidelines and quite okay with that. Let’s see what develops over the next few days.
You did not say if you got to see the little Kiwi. That would be very cool. Waiting to see the photos.
No Kiwi today. The chicks fledged 13 days ago. Dad usually hangs around for 2-3 weeks to help them a bit, but today he and the chicks were all gone. He has a radio transmitter so we searched in the bush for a couple of hours, but he’s in a valley and the signal bounces all over. Couldn’t find him.
Next time. We’ll try again next week.
I did get to see Kiwi nests and I have a Kiwi feather as a souvenir.
Volume today could be read in two ways; either a good support for downwards movement and so it’s going to continue, or possibly a selling climax and so it’s all over now.
Tomorrow will tell. Tomorrow is really important.
meep meep