
Price has moved sideways in a small range for Monday’s session. This fits the hourly Elliott wave count and the alternate daily Elliott wave count best.
Summary: A deeper pullback looks very likely now to have arrived. It may last at least another five days and possibly a few weeks longer. Target zones are either 2,368 – 2,353 or 2,282 – 2,234. A new low below 2,277.53 would indicate the lower target range should be used.
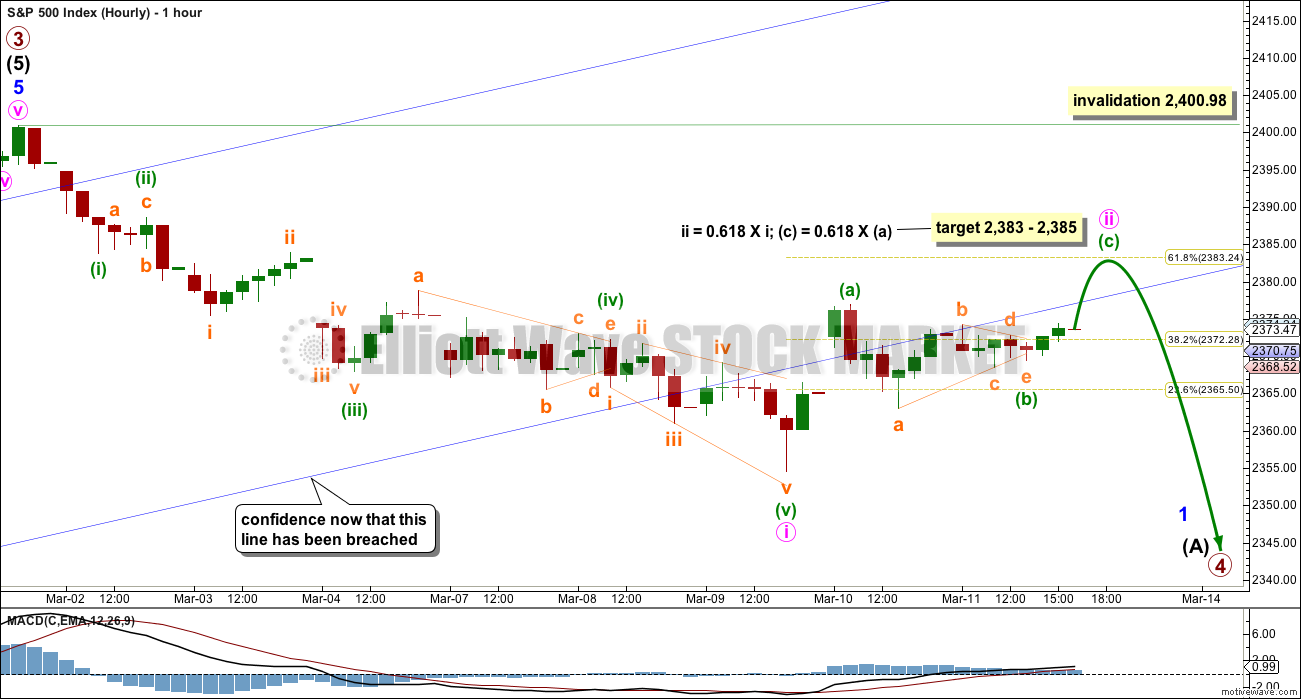
For the very short term, a second wave correction may move higher over the next one to few days. The target is at 2,383 – 2,385.
New updates to this analysis are in bold.
Last monthly and weekly charts are here. Last historic analysis video is here.
MAIN ELLIOTT WAVE COUNT
WEEKLY CHART
Click chart to enlarge.
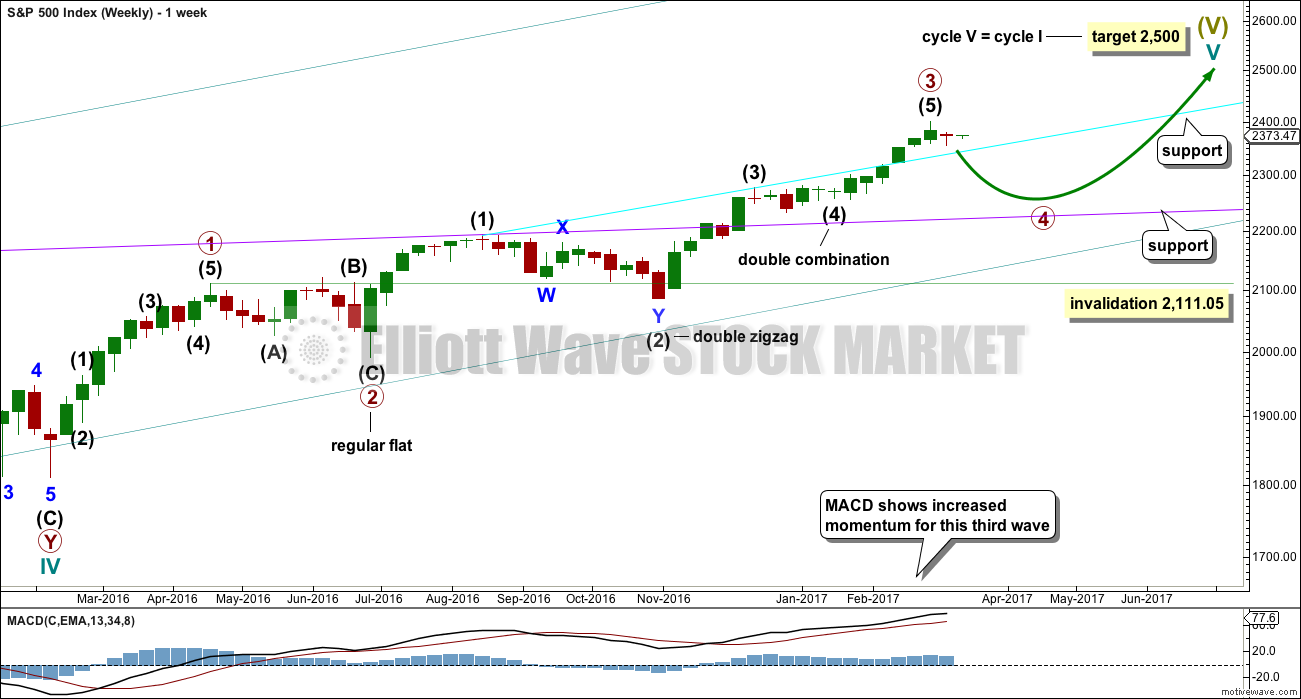
Cycle wave V is an incomplete structure. Within cycle wave V, primary wave 3 may now be complete.
Primary wave 4 may not move into primary wave 1 price territory below 2,111.05.
Primary wave 2 was a flat correction lasting 47 days (not a Fibonacci number). Primary wave 4 may be expected to most likely be a zigzag, but it may also be a triangle if its structure exhibits alternation. If it is a zigzag, it may be more brief than primary wave 2, so a Fibonacci 21 sessions may be the initial expectation. If it is a triangle, then it may be a Fibonacci 34 or 55 sessions.
As price moves lower look for support at each of the longer term trend lines drawn here across previous all time highs. Next support at the cyan line may be met soon.
A new low below 2,277.53 would invalidate the daily alternate wave count below and provide confidence that the pullback is at primary degree.
DAILY CHART
Click chart to enlarge.
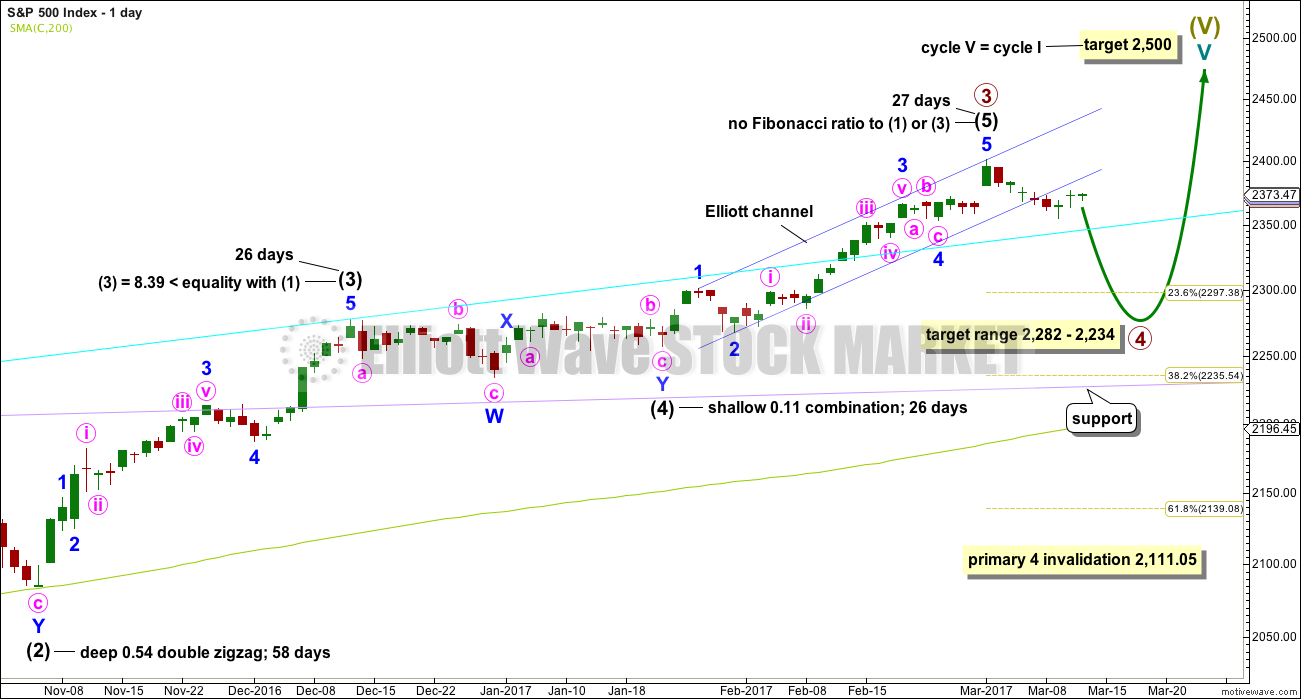
Intermediate wave (3) is shorter than intermediate wave (1). One of the core Elliott wave rules states a third wave may never be the shortest wave, so this limits intermediate wave (5) to no longer than equality in length with intermediate wave (3). If intermediate wave (5) is now over, then this rule is met.
Minor wave 3 has no Fibonacci ratio to minor wave 1. If minor wave 5 is now over, then it is 4.14 points longer than equality in length with minor wave 3. Price has printed three full daily candlesticks below and not touching the lower edge of the channel. This is defined as a breach of the channel. Further confidence in a multi week pullback may be had.
Intermediate wave (5) may have ended in 27 days, just one longer than intermediate waves (3) and (4). This gives the wave count good proportions.
The proportion here between intermediate waves (2) and (4) is acceptable. There is alternation. Both are labelled W-X-Y, but double zigzags are quite different structures to double combinations.
The following correction for primary wave 4 should be a multi week pullback, and it may not move into primary wave 1 price territory below 2,111.05.
HOURLY CHART
Click chart to enlarge.
A new wave down at primary degree should begin with a five down on the hourly and daily chart levels. This may be complete. The following correction for minute wave ii may not move beyond the start of minute wave i above 2,400.98.
This hourly chart will also suffice for the alternate daily wave count below.
If this correction is minor wave 4 (as per the alternate daily), then it may be unfolding as a zigzag. So far the minute wave may be complete at the low labelled minute wave i (on this hourly chart). Minute wave b may be incomplete and minute wave c should then follow lower (as per the alternate daily). A-B-C of a zigzag subdivides 5-3-5, exactly the same as 1-2-3 of an impulse, so the subdivisions for both ideas would be exactly the same at the hourly chart level at this stage.
Minute wave i lasted six days and minute wave ii so far has lasted two. If minute wave ii continues for another one to three days, it would have good proportion to minute wave i.
For more aggressive traders, the end of minute wave ii may present an opportunity to join the new short term downwards trend.
Less aggressive traders may choose to patiently wait for this correction to end before entering long. The larger trend is still upwards and this is expected to be a counter trend movement. Counter trend movements do not usually offer good trading opportunities as they are choppy and overlapping. If trading during a counter trend movement, it is more important to take profits more quickly when they appear.
Always remember my two Golden Rules:
1. Always use a stop.
2. Do not invest more than 1-5% of equity on any one trade.
ALTERNATE DAILY CHART
Click chart to enlarge.
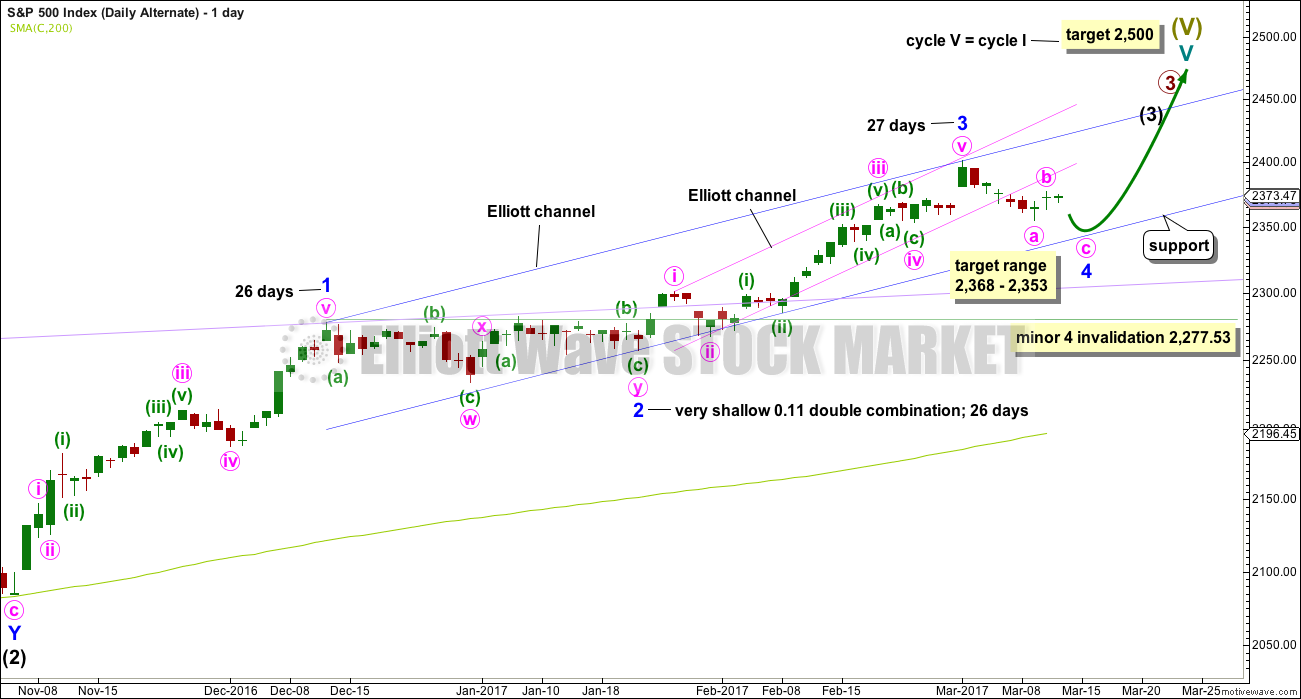
What if recent strong upwards movement was the middle a third wave at three degrees? This is supported by a fairly bullish look for the classic technical analysis chart.
All subdivisions are seen in exactly the same way for both daily wave counts, only here the degree of labelling within intermediate wave (3) is moved down one degree.
This alternate also expects a correction, but for minor wave 4, that may not move into minor wave 1 price territory below 2,277.53. A new low below this point would confirm the correction could not be minor wave 4 and that would provide confidence it should be primary wave 4.
Minor wave 4 may last about 26 days if it is even in duration with minor waves 1, 2 and 3. That would give the wave count good proportions and the right look. So far minor wave 4 has lasted only 8 days, so it may continue for another 18 if it is even in duration with minor waves 1, 2 and 3. However, zigzags are usually quicker structures than combinations. If minor wave 4 is unfolding as a zigzag (which looks likely and would give perfect alternation), then it may complete in a total Fibonacci 13 days, so it may end now in another 5 days.
At this stage, it is looking like this alternate wave count may be more likely than the main wave count. A correction at minor degree for minor wave 4 should look similar in range and strength to minor wave 2, which so far it does. This downwards movement does not look strong enough to be the start of a primary degree trend.
Minor wave 4 may end within the price territory of the fourth wave of one lesser degree about 2,368 to 2,353.
This wave count now expects choppy overlapping movement to find support at the wider blue Elliott channel.
Both wave counts expect essentially the same direction next, so the hourly chart for this alternate would look the same.
TECHNICAL ANALYSIS
WEEKLY CHART
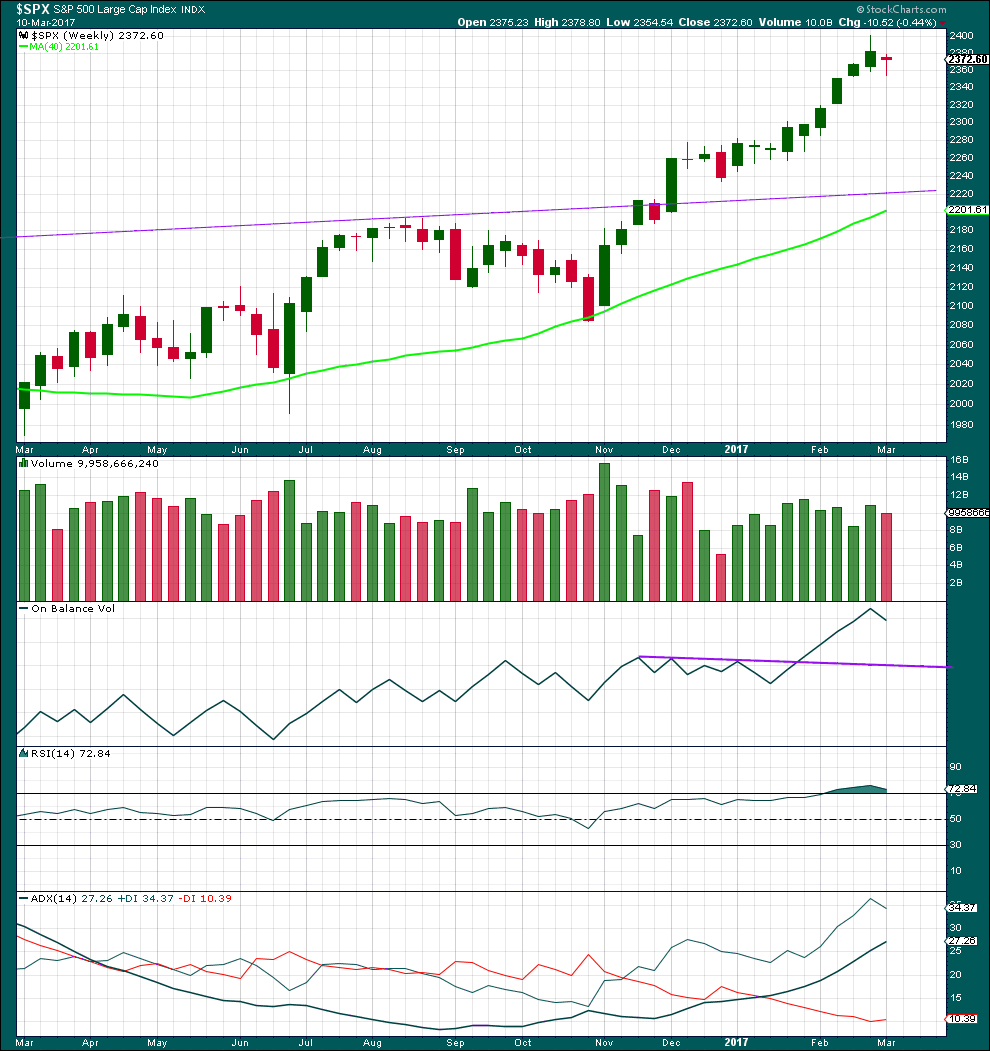
Click chart to enlarge. Chart courtesy of StockCharts.com.
Last week completes a red doji, which moved price lower, after nine green weekly candlesticks in a row. The trend has changed from up to neutral. Volume is lighter this week and the fall in price is not supported by volume. This looks like a pause within a trend and not a new trend.
There is a long way for On Balance Volume to go to find support.
RSI may now return from oversold.
ADX did not reach extreme. There is room for the trend to continue further.
DAILY CHART
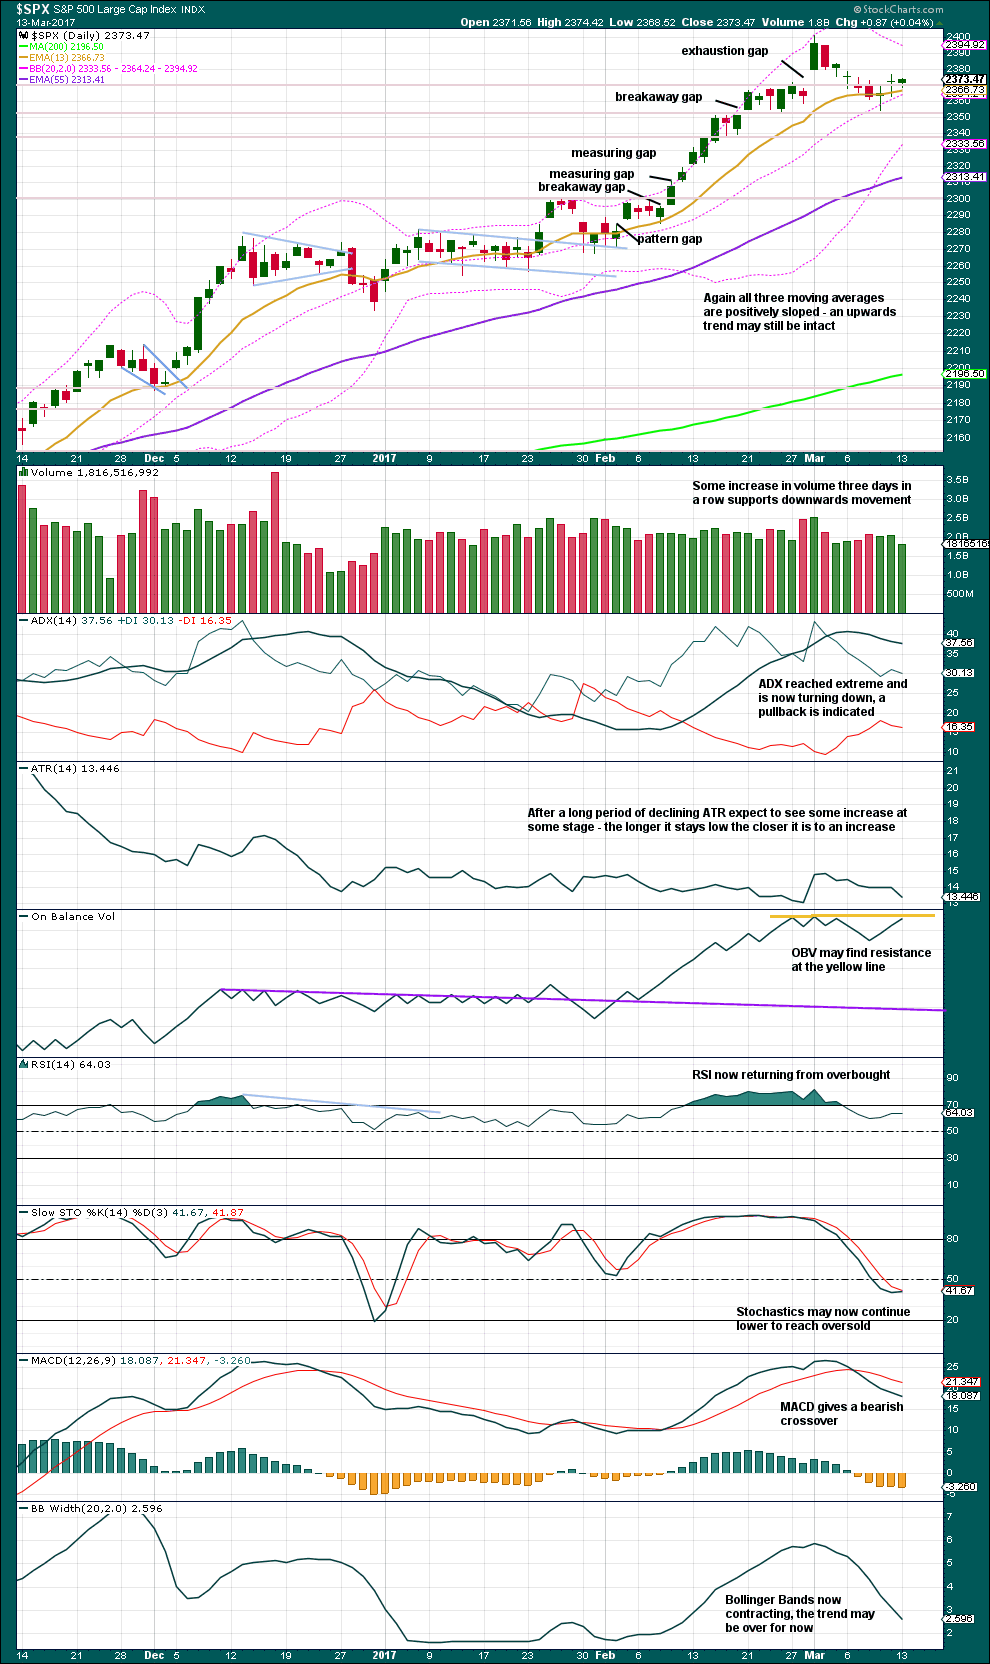
Click chart to enlarge. Chart courtesy of StockCharts.com.
A small range day completes an inside day, after a doji. This movement looks very choppy and overlapping; the market is consolidating. Upwards movement for Monday’s session does not have support from volume.
The short purple trend line for On Balance Volume did not work, so it is removed. The yellow resistance line is extended and this may provide resistance here. However, there is a little leeway in exactly how this line may be drawn, so it may allow for another upwards day before resistance is reached if it is drawn slightly more steeply.
This consolidation still looks likely to continue for longer, so that ADX comes down from extreme and Stochastics reaches oversold. At this stage, resistance is at 2,400 and support is about 2,355. Next support is about 2,340.
VOLATILITY – INVERTED VIX CHART
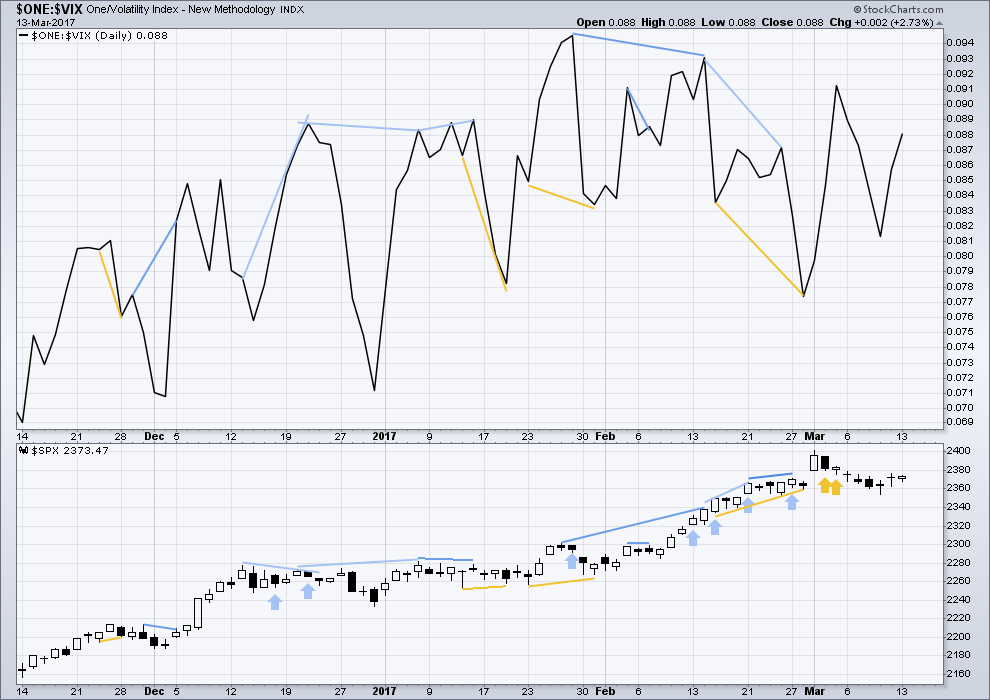
Click chart to enlarge. Chart courtesy of StockCharts.com.
Normally, volatility should decline as price moves higher and increase as price moves lower. This means that normally inverted VIX should move in the same direction as price.
Bearish divergence and bullish divergence spanning a few short days used to be a fairly reliable indicator of the next one or two days direction for price; normally, bearish divergence would be followed by one or two days of downwards movement and vice versa for bullish divergence.
However, what once worked does not necessarily have to continue to work. Markets and market conditions change. We have to be flexible and change with them.
Recent unusual, and sometimes very strong, single day divergence between price and inverted VIX is noted with arrows on the price chart. Members can see that this is not proving useful in predicting the next direction for price.
Divergence will be continued to be noted, particularly when it is strong, but at this time it will be given little weight in this analysis. If it proves to again begin to work fairly consistently, then it will again be given weight.
No new divergence is noted today between price and VIX.
BREADTH – AD LINE
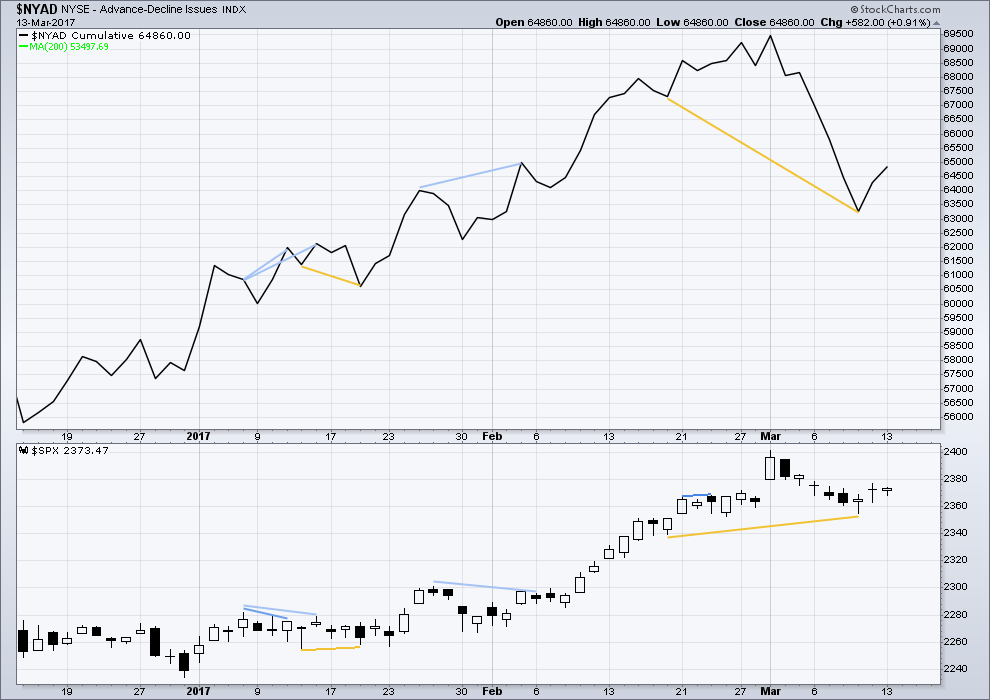
Click chart to enlarge. Chart courtesy of StockCharts.com.
The rise in price has support from a rise in market breadth. Lowry’s OCO AD line also shows new highs along with price. Normally, before the end of a bull market the OCO AD line and the regular AD line should show divergence with price for about 4-6 months. With no divergence, this market has support from breadth.
Mid term bullish divergence has now been followed by two upwards days. It may be resolved here or it may still be followed by more upwards movement.
DOW THEORY
The DJIA, DJT, S&P500 and Nasdaq continue to make new all time highs. This confirms a bull market continues.
This analysis is published @ 10:29 p.m. EST.
Yeh, just figured – thanks.
Anyone know why the markets closed early today?
Did not close early today. We had time change this Sunday here in the US
Hourly chart update:
The move down today looks like the completion of a zigzag down, this looks like minuette (b).
Now for minuette (c) to come up, it looks like now the lower edge of the old channel may provide some resistance. The target for minute ii is recalculated again. It’s a little lower now.
So maybe a bounce into the close today and open tomorrow? To be followed by a fall down. A curve back up to retest resistance at the trend channel, typical behaviour.
If price does this it may offer a great short opportunity for the short term and nimble amongst us. Beware though it any members are trying this, it’s not for the faint hearted. Reduce position size, don’t over leverage it and for goodness sake use a stop. This would be a trade against the larger trend, so the risk is higher. Manage risk please.
I am going to have to swap the main and alternate daily charts over today, and relabel the hourly chart as minor 4. It really is looking more likely.
Natty gas seems to be resuming the slide South.
Buying UNG 7.50 March 24 7.50 puts for 0.47 per contract.
Target 100% at UNG price of 6.75…
I’m outta here!
Have a great evening everybody!
Tomorrow’s gonna be FUN!!
Bye Verne, have a good rest.
Gap down from this morning remains open.
Chart showing a bearish rising wedge so we could get a sharp move down prior to the close. If we don’t, we could be looking at another gap down for tomorrow’s open. Things starting to get a bit dicey…VIX showing signs of life at long last…! 🙂
Looks choppy to bearish on the daily chart. 54-72 range bound so far
Taking profits on USO puts today. Thanks to Lara for an awesome trade!
This move down is not done yet. We should see a few days bounce coming up and another great shorting opportunity.
Vern,
I took some profits on CL today as well. Will reload shots in 49-50 area (if we get there). Still holding 40% of the short position. thanks Lara
Wasn’t that an absolutely awesome call by Lara?
I read the analysis and she absolutely nailed it.
Got me some USO 12.50 puts and they did a moon shot! 🙂
Thanks guys! I too have some nice profits on my CFD short for WTI crude today. Will look too to take some profits and wait for the bounce.
Probably not a bad idea to cash in any profitable short trades into the close. I plan on lightening up a few positions ahead of what is likely going to be a very volatile trading session tomorrow. Of course another option is to remain hedged…
Buying VXX March 31 17.00 strike calls for 0.83 per contract….profit target 100% at VXX 17.50…
Has anyone ever seen back to back bearish AND bullish engulfing candles for VIX?!
Even more strange, VXX printing a new 52 week low today. All the world’s gone mad I tell ya! 😀
Perhaps today’s low is minuette b of minute ii. If so, we have another wave up, minuette c to go above minuette a at 2376.86. This would complete minute ii whereby the downwards correction could continue with wave minute 3 down.
I think you are right.
The B wave does look a bit shorter than 90% of A so it would be probably a ZZ and C needs to go higher.
We could get another impulse down complete by the close with a strong reversal ahead of the possible fireworks tomorrow. If we get a bounce it could be great shorting opportunity. If we do not get a bounce…farewell and adieu… 🙂
Below 2357.95 and we could have an impulse down, expanded flat for a second wave, and another 1,2 ahead of a third down….
Any wave counters with a sharp eye? 🙂
Adding SPY 235 puts @ 0.89 per contract…
A break of 2354.54 and that’s all she wrote…!
Looks like we moved back up to test underside of broken neck-line of hourly H&S pattern…
This market continues to fall with no selling pressure whatsoever.
Look at today’s volume.
Look at all those skinny candles for all the past few down days – not good…rather than let the market fall to its true level, the idiot banksters insist on protracted meddling.
They are going to foolishly try and fill the gap from yesterday’s close at around 2373.47
Succeed or not, their stupidity should be vigorously shorted imho…
What happened yesterday is a great example of broken market signals. Both
EW counts have us in a downtrend yet there is VIX with this monster bearish engulfing candle! What the…! Of course I hedged my massive long volatilty position and look what infolds today…schizoid market…
Selling SVXY 130 puts for a triple. I really should hold onto them for more downside but just in case… 😉
SPX 2358.96 is next key level… a break means the banksters are done for now..put nicely in the money, as are svxy short calls. Holding spy hedge
Good morning!
Futures presaging either a third or a C wave down.
The bearish engulfing candle in VIX yesterday, along with the market’s tendency of late to complete these impulses down and quickly reverse argues for the C wave.
Of course we will have to depend on the invalidation points to confirm which is correct.
I will be unloading my SPY 237.50 put and if the price is right, buying back half my SVXY 195 calls sold yesterday hopefully at a much cheaper price; will continue to hold 237.5 SPY calls for the time being….
If he main count is confirmed SVXY is a prime short candidate for a ten bagger…again!
Trading above 130 is laughable under these conditions…imho 🙂
Lara,
Thanks for your analysis.
You mention the alternate daily Elliott wave count best, and one of target zones is 2,368 – 2,353. Today’s low is 2,368.52. Does it mean it is possible that Minor wave 4 may end and Minor Wave 5 starts today?
No, because I can’t see the zigzag complete yet. It needs at least another five down for the C wave.