
A little upwards movement was expected from the hourly Elliott wave count published in last analysis. This is exactly what happened for Friday’s session.
A target may now be calculated for the short term at two degrees.
Summary: A deeper pullback looks very likely now to have arrived. It may last about one to three months and may end either 2,368 – 2,353 or 2,282 – 2,234. A new low below 2,277.53 would indicate the lower target range should be used.
For the very short term, a second wave correction may move higher over the next one to few days. The target is at 2,383 – 2,385.
New updates to this analysis are in bold.
Last monthly and weekly charts are here. Last historic analysis video is here.
MAIN ELLIOTT WAVE COUNT
WEEKLY CHART
Click chart to enlarge.
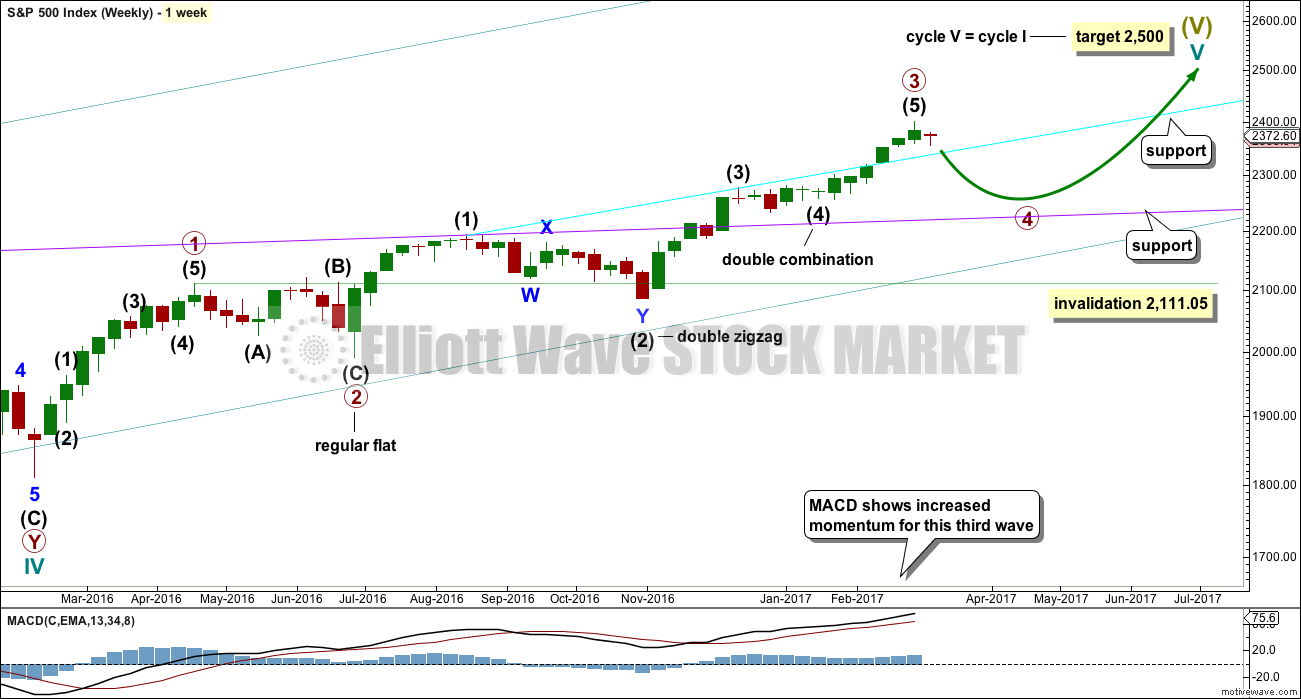
Cycle wave V is an incomplete structure. Within cycle wave V, primary wave 3 may now be complete.
Primary wave 4 may not move into primary wave 1 price territory below 2,111.05.
Primary wave 2 was a flat correction lasting 47 days (not a Fibonacci number). Primary wave 4 may be expected to most likely be a zigzag, but it may also be a triangle if its structure exhibits alternation. If it is a zigzag, it may be more brief than primary wave 2, so a Fibonacci 21 sessions may be the initial expectation. If it is a triangle, then it may be a Fibonacci 34 or 55 sessions.
As price moves lower look for support at each of the longer term trend lines drawn here across previous all time highs. Next support at the cyan line may be met soon.
A new low below 2,277.53 would invalidate the daily alternate wave count below and provide confidence that the pullback is at primary degree.
DAILY CHART
Click chart to enlarge.
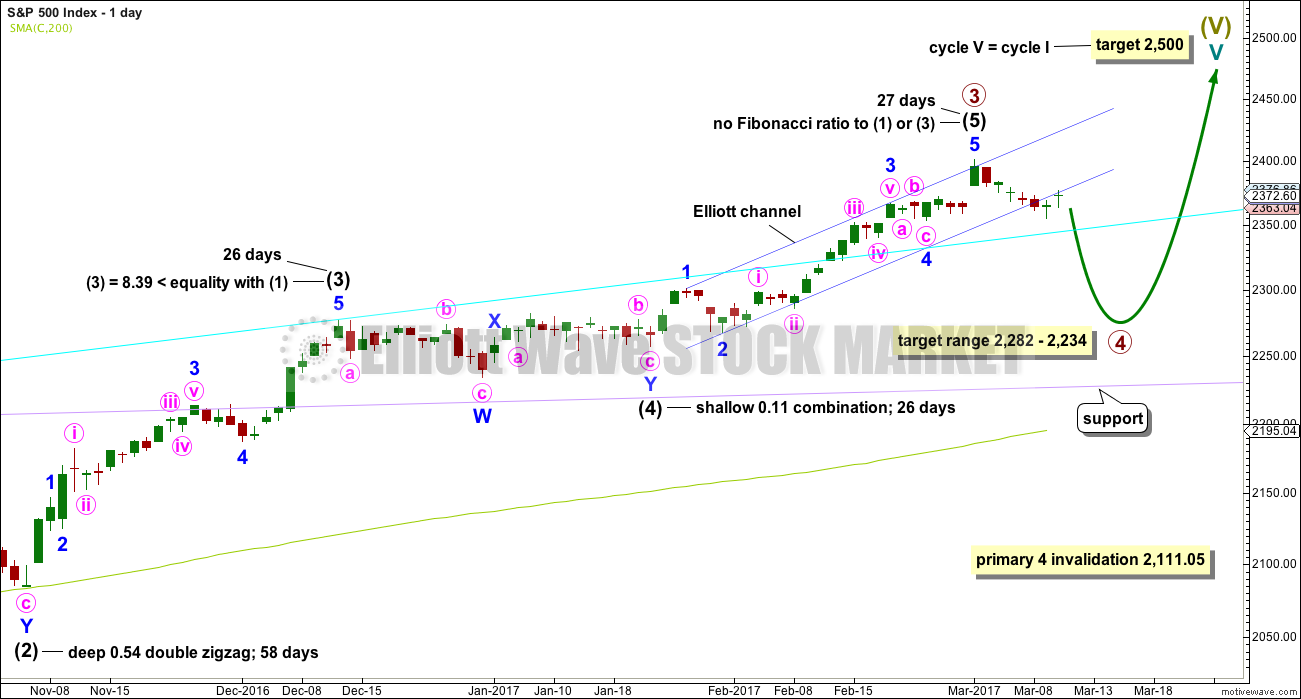
Intermediate wave (3) is shorter than intermediate wave (1). One of the core Elliott wave rules states a third wave may never be the shortest wave, so this limits intermediate wave (5) to no longer than equality in length with intermediate wave (3). If intermediate wave (5) is now over, then this rule is met.
Minor wave 3 has no Fibonacci ratio to minor wave 1. If minor wave 5 is now over, then it is 4.14 points longer than equality in length with minor wave 3. Price has printed a full daily candlestick below and not touching the lower edge of the channel. This is defined as a breach of the channel. Further confidence in a multi week pullback may be had.
Intermediate wave (5) may have ended in 27 days, just one longer than intermediate waves (3) and (4). This gives the wave count good proportions.
The proportion here between intermediate waves (2) and (4) is acceptable. There is alternation. Both are labelled W-X-Y, but double zigzags are quite different structures to double combinations.
The following correction for primary wave 4 should be a multi week pullback, and it may not move into primary wave 1 price territory below 2,111.05.
HOURLY CHART
Click chart to enlarge.
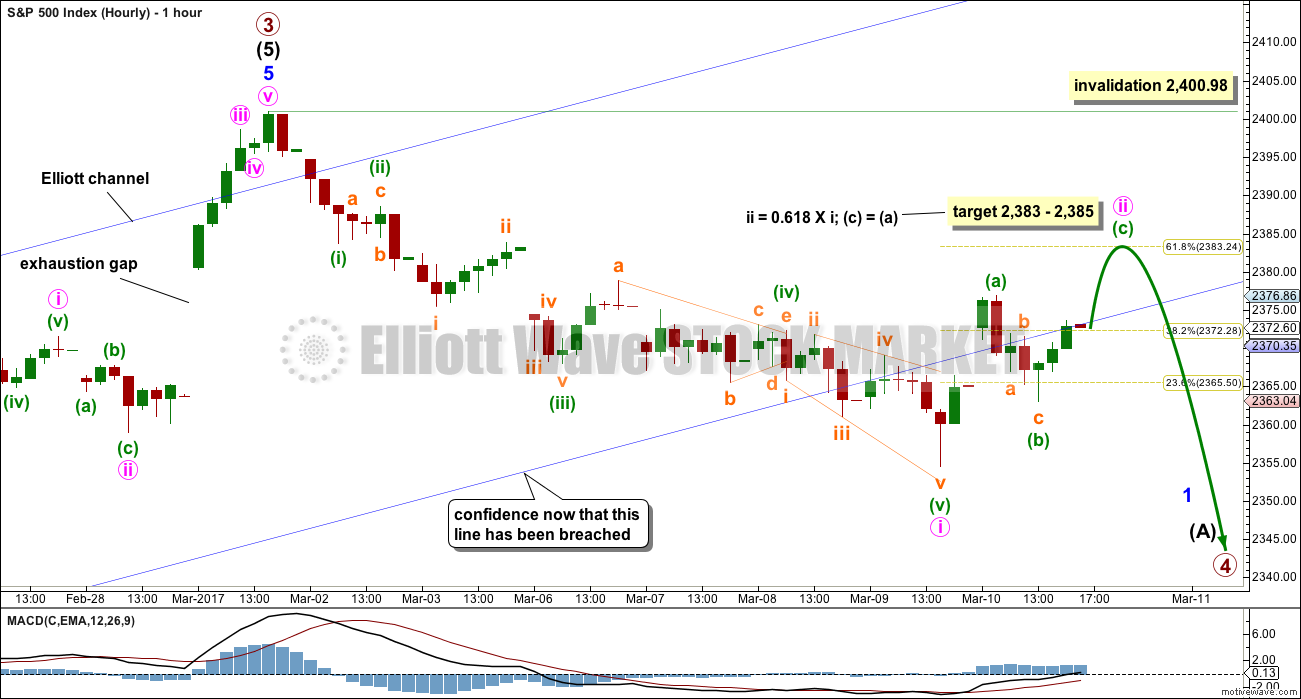
The last gap is now closed, so it is correctly named an exhaustion gap.
A new wave down at primary degree should begin with a five down on the hourly and daily chart levels. This may be complete. The following correction for minute wave ii may not move beyond the start of minute wave i above 2,400.98.
The lower edge of the blue Elliott channel is not providing resistance. Minute wave ii may be expected now to end within the channel, close to the 0.618 Fibonacci ratio of minute wave i. A 2 point target zone calculated at two degrees should have a reasonable probability.
Minute wave i lasted six days. Minute wave ii may last another one to few days to be in proportion.
For more aggressive traders, the end of minute wave ii may present an opportunity to join the new short term downwards trend.
Less aggressive traders may choose to patiently wait for this correction to end before entering long. The larger trend is still upwards and this is expected to be a counter trend movement. Counter trend movements do not usually offer good trading opportunities as they are choppy and overlapping. If trading during a counter trend movement, it is more important to take profits more quickly when they appear.
Always remember my two Golden Rules:
1. Always use a stop.
2. Do not invest more than 1-5% of equity on any one trade.
ALTERNATE DAILY CHART
Click chart to enlarge.
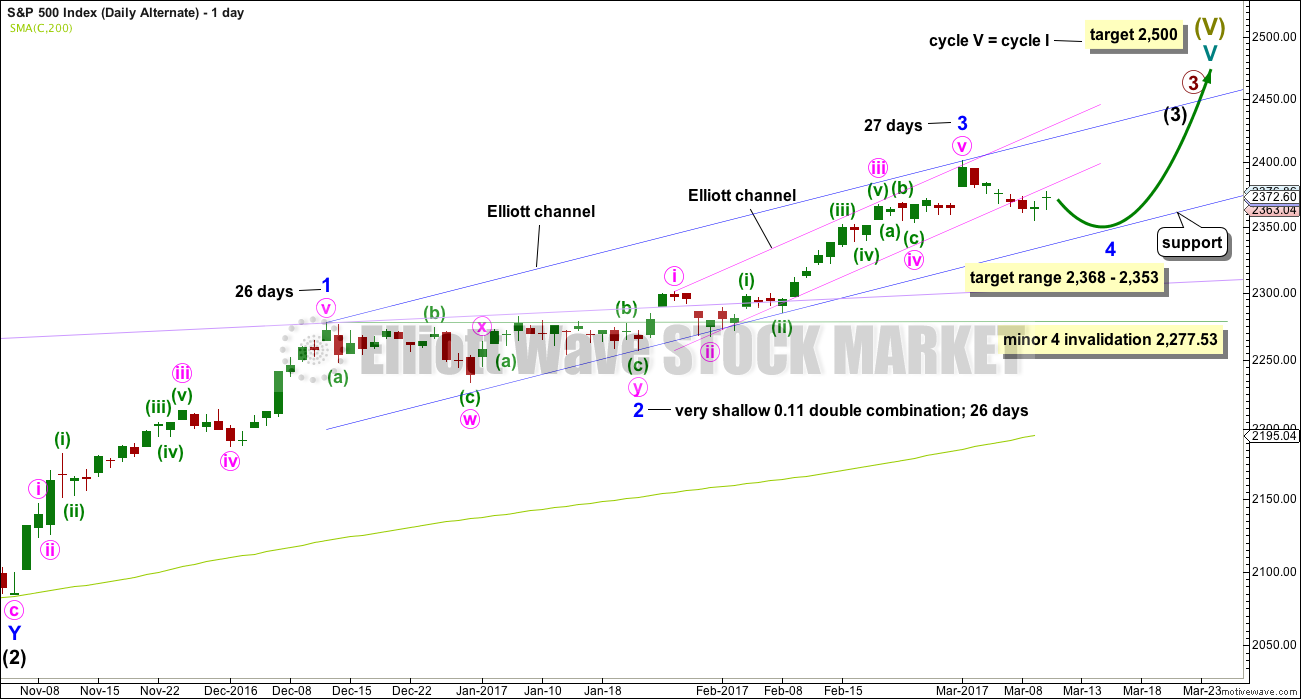
What if recent strong upwards movement was the middle a third wave at three degrees? This is supported by a fairly bullish look for the classic technical analysis chart.
All subdivisions are seen in exactly the same way for both daily wave counts, only here the degree of labelling within intermediate wave (3) is moved down one degree.
This alternate also expects a correction, but for minor wave 4, that may not move into minor wave 1 price territory below 2,277.53. A new low below this point would confirm the correction could not be minor wave 4 and that would provide confidence it should be primary wave 4.
Minor wave 4 may last about 26 days if it is even in duration with minor waves 1, 2 and 3. That would give the wave count good proportions and the right look.
Minor wave 4 may end within the price territory of the fourth wave of one lesser degree about 2,368 to 2,353.
Price printed a full daily candlestick below the channel, so this adds confidence in a pullback being underway here. This wave count now expects choppy overlapping movement to find support at the wider blue Elliott channel.
Both wave counts expect essentially the same direction next, so the hourly chart for this alternate would look the same with the exception of the degree of labelling.
TECHNICAL ANALYSIS
WEEKLY CHART
Click chart to enlarge. Chart courtesy of StockCharts.com.
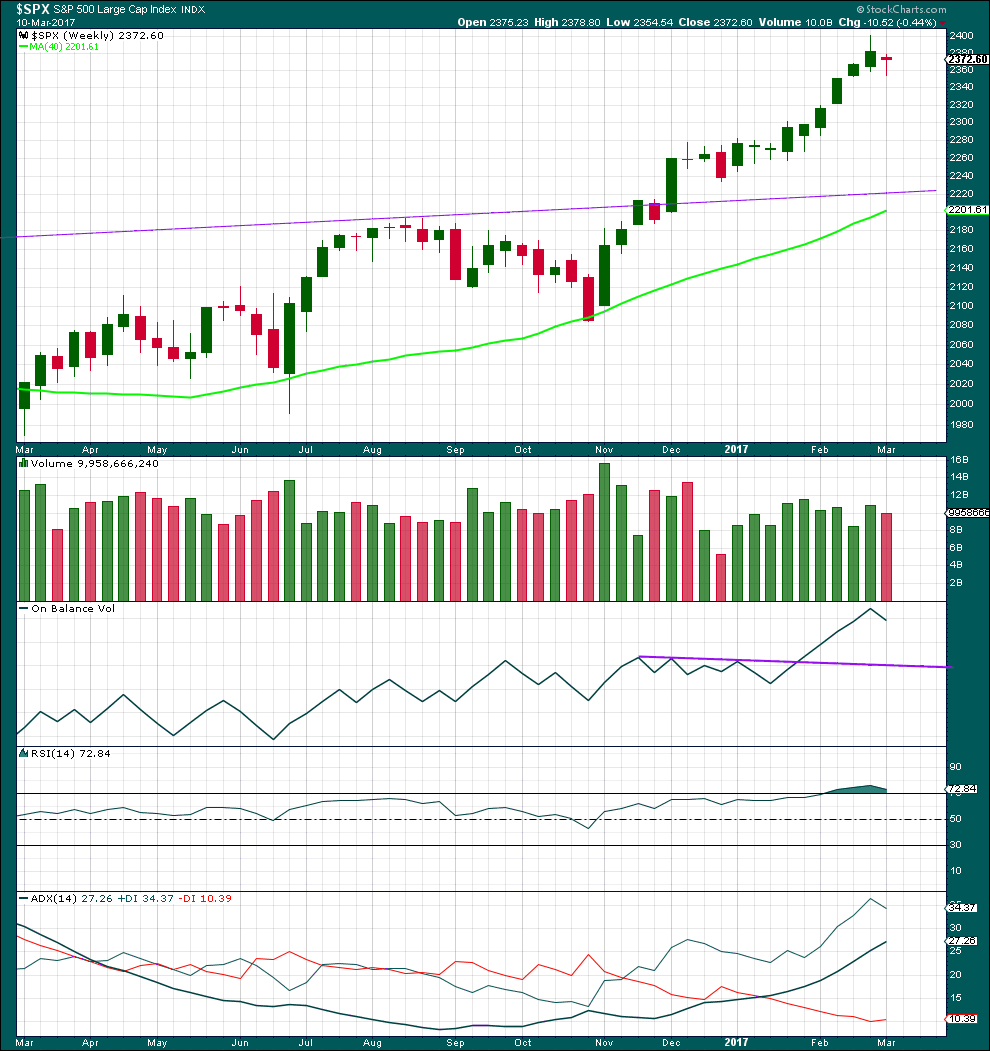
This week completes a red doji, which moved price lower, after nine green weekly candlesticks in a row. The trend has changed from up to neutral. Volume is lighter this week and the fall in price is not supported by volume. This looks like a pause within a trend and not a new trend.
There is a long way for On Balance Volume to go to find support.
RSI may now return from oversold.
ADX did not reach extreme. There is room for the trend to continue further.
DAILY CHART
Click chart to enlarge. Chart courtesy of StockCharts.com.
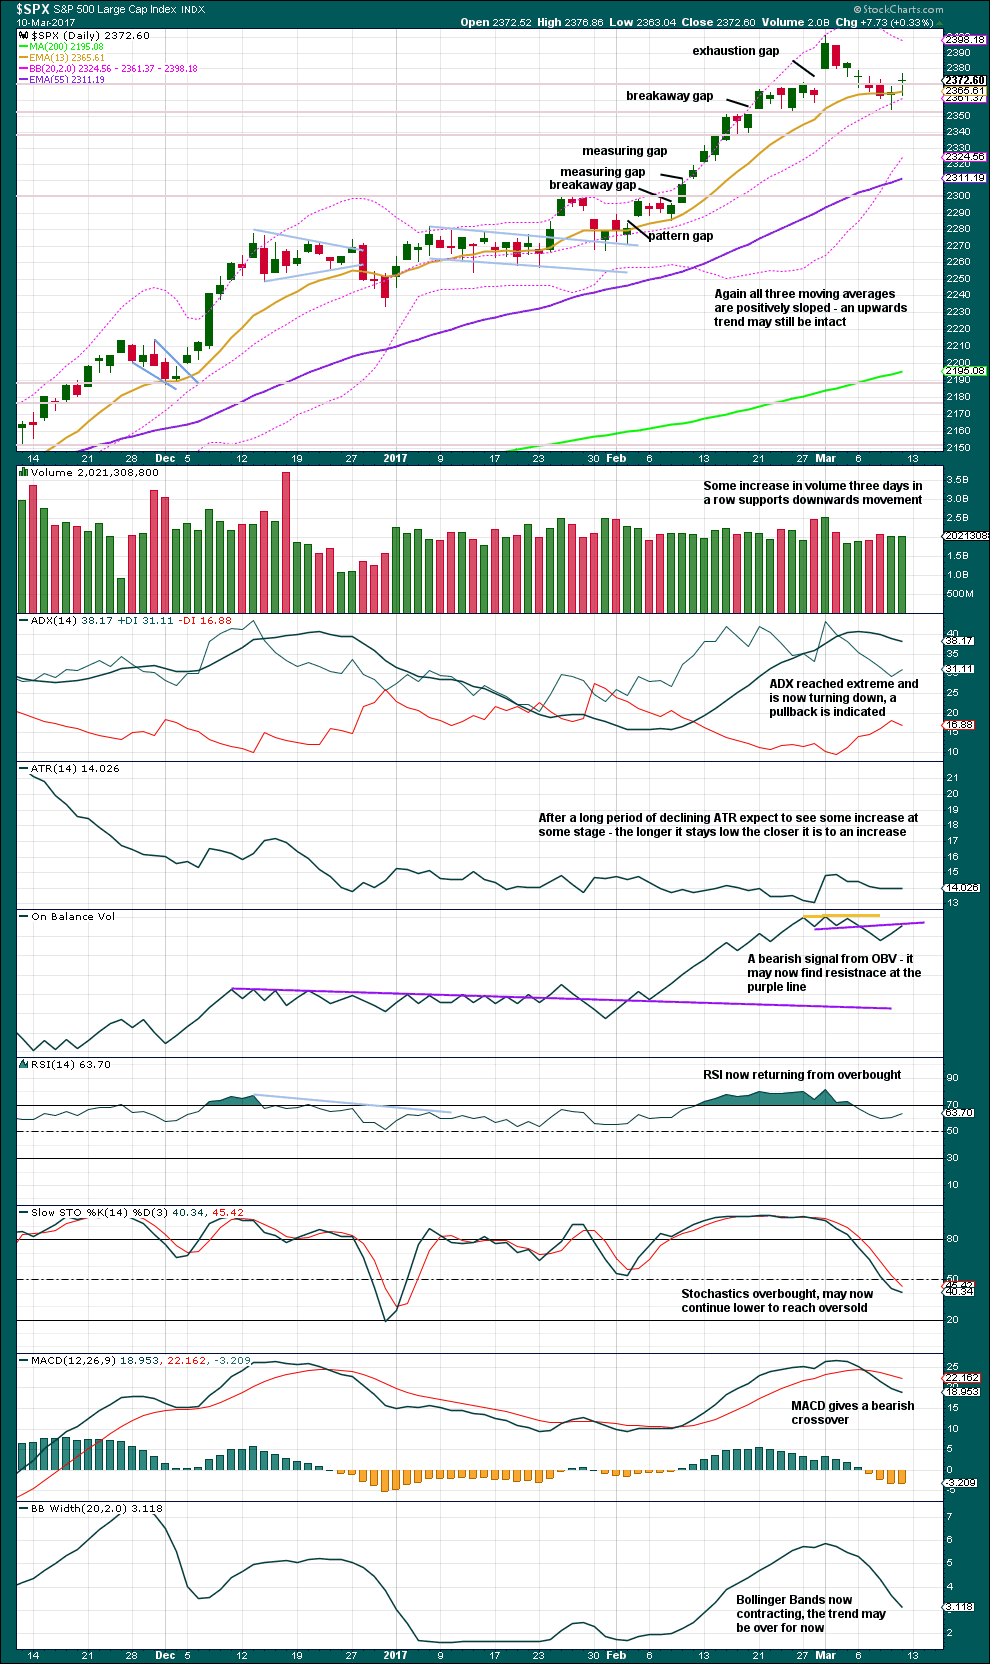
Friday moved price higher and the balance of volume was upwards. A slight increase in volume from the prior downwards day offers some small support for upwards movement. This offers small support to the hourly Elliott wave count.
On Balance Volume is at resistance.
Overall, it still looks very likely that a pullback has arrived. It needs to continue further to bring ADX down from extreme and Stochastics into oversold.
VOLATILITY – INVERTED VIX CHART
Click chart to enlarge. Chart courtesy of StockCharts.com.
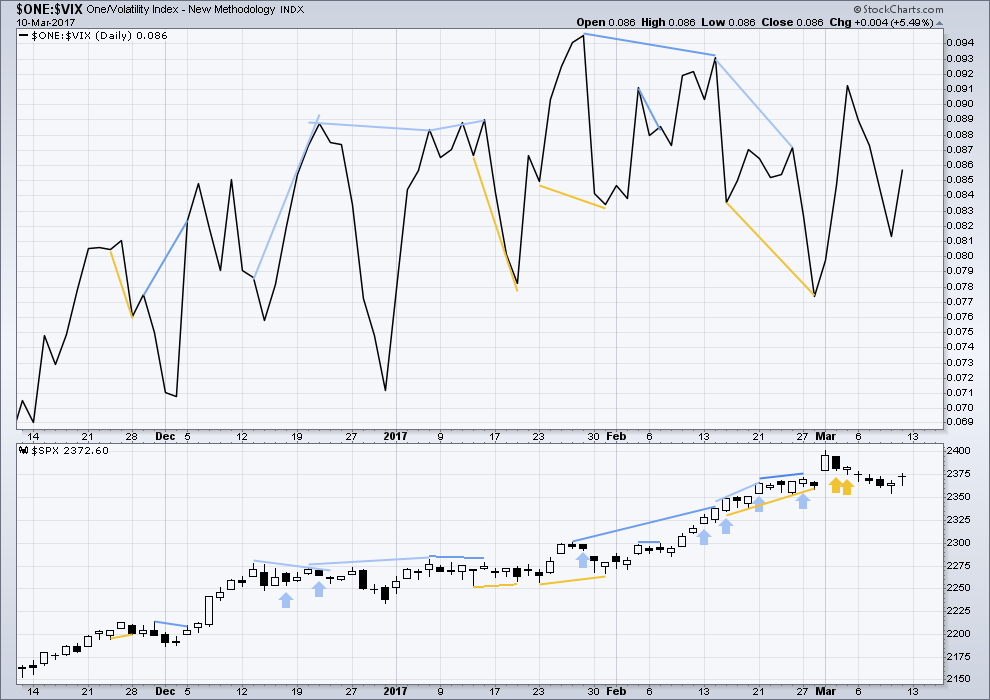
Normally, volatility should decline as price moves higher and increase as price moves lower. This means that normally inverted VIX should move in the same direction as price.
Bearish divergence and bullish divergence spanning a few short days used to be a fairly reliable indicator of the next one or two days direction for price; normally, bearish divergence would be followed by one or two days of downwards movement and vice versa for bullish divergence.
However, what once worked does not necessarily have to continue to work. Markets and market conditions change. We have to be flexible and change with them.
Recent unusual, and sometimes very strong, single day divergence between price and inverted VIX is noted with arrows on the price chart. Members can see that this is not proving useful in predicting the next direction for price.
Divergence will be continued to be noted, particularly when it is strong, but at this time it will be given little weight in this analysis. If it proves to again begin to work fairly consistently, then it will again be given weight.
BREADTH – AD LINE
Click chart to enlarge. Chart courtesy of StockCharts.com.
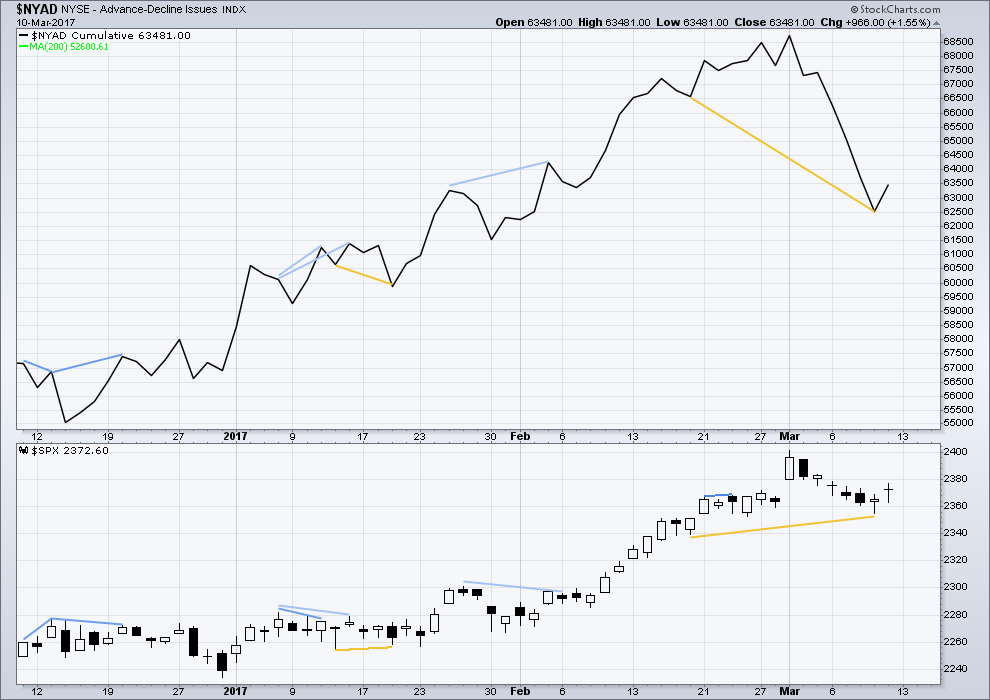
The rise in price has support from a rise in market breadth. Lowry’s OCO AD line also shows new highs along with price. Normally, before the end of a bull market the OCO AD line and the regular AD line should show divergence with price for about 4-6 months. With no divergence, this market has support from breadth.
Mid term bullish divergence has now been followed by one upwards day. It may be followed by at least one more before it is resolved. This supports the hourly Elliott wave count.
DOW THEORY
The DJIA, DJT, S&P500 and Nasdaq continue to make new all time highs. This confirms a bull market continues.
This analysis is published @ 01:16 a.m. EST on 11th March, 2017.
Great big cucumber of a bearish engulfing candle on VIX today for whatever that is worth. It is suggesting a move higher short term. Adding another 19 SPY 37.50 calls for 0.84. I know. I’m totally bored!!! 🙂
Well, let’s hope we get a thrust of some kind tomorrow. Will hold onto my 237.50 put just in case Mr. Market gets cute.
Have a great evening all!
237.50 call inched up to 0.88. Hardly worthy of celebration. Let’s see if it can eke out a 1.50 advance by the close. I expect the mucking around to continue and both to just loose premium. This will be another clue the banksters are treading water ahead of some anticipated event…perhaps a Wednesday pronouncement…
Qqqs pressing at ath. Weird. Feels ominous….Iwm corrected five percent. Really dont have a good feel here….feels like they are keeping the lid on stocks enticing short selling by keeping the Dia and Spx markets just a little negative while baiting longs with qqq ath.
Hourly chart updated:
A small triangle may have completed this session. A sharp upwards move to end it? Or the beginning of tomorrow?
That would complete a zigzag for minute ii. The target is the same.
One often sees a collapse in volatility just ahead of a second wave peak, but that usually happens in a high degree second wave. SVXY is almost back to 52 week high! Talk about in-your-face divergence….Yikes! 🙂
I used to love trading thrusts out of triangles as they were such reliable set-ups. The rules these days are all screwed up. You used to be able to make an intelligent decision about direction but these days it’s a crap-shoot. If we indeed have a second wave, any thrust upward out of the triangle would be counter-trend with movement ultimately showing continuation downward.
In a fourth position it would obviously be followed by an impulsive fifth wave in the opposite direction. I guess a straddle here might be the best approach, or probably better watching from a safe distance! 🙂
OK just for kicks I bought a SPY 237.50 put for 0.65 and a 237.50 call for 0.78, both expiring this Wednesday March 15. If we have a triangle one of em should quickly return at least 50%. This ought to be interesting! 🙂
Here is one of ’em….
There is something really funky going on. I maintain in some of my trading accounts price target on indices that flag me when we have significant price changes, for example a 3% change in SPX. For the last several weeks I keep getting these alerts in my inbox telling me ETF and indices I have these triggers on are trading WAY below what they actually are. What the H- E double toothpicks am I missing here??!!
I know a massive short position taken in the market will not necessarily immediately affect trading price because of SEC rules about how they are entered, and you have to go looking for these kinds of trades but I am starting to wonder…are some of those trigger algos seeing something below the surface??!!
Okay, i’ve been thinking this one through with Cesar….
At a market high all players, particularly the big players, should be so convinced the bull run will continue, that this time is different, a crash can be ruled out. Sentiment should be extremely bullish.
So big players taking massive short positions from a contrary perspective indicates the high can’t be in, not with that kind of bearishness about.
So my conclusion on this issue is it indicates to us that what we’re seeing price do right now is a correction, and when it’s run it’s course the bull run will continue.
Yep! I agree.
Odds I think starting to favor the alternate. When a primary degree trend change arrives I think there will be less uncertainty. These sideways meandering movements have of late meant consolidation ahead of a move higher. At leasr that is the way itappears to moi.
I totally agree (was just thinking of posting the same myself). And I think technical analysis (e.g. MACD) supports the alternate better anyway. When Primary 4 arrives, I expect we will all know it. The Fed will probably start lowering rates again (which, of course, won’t work), which will lead to one more blow off (i.e. Wave 5).
Peter you are absolutely the only person I have heard to even hint of the FED possibly NOT raising rates, to say nothing of LOWERING them. They are not stupid. They are fully aware that rising rates spells the end of this bubble, no ifs ands or buts. I recently read an analyst who correctly pointed out that the catalysts for the implosion in 2000 and 2007 were the tech and housing bubbles respectively, opine that he had no idea what catalyst might trigger the impending economic downturn. It is amazing that any analyst could miss the biggest bubble in the history of bubbles, namely the bond market, and more specifically debt, which now far exceeds the levels we saw in 2000 and 2007, the only difference now being it is Sovereign states that have maxed out their credit cards. I agree that the FED will probably try to take back their rate hike. The problem is the market, which is ultimately in charge, will not let them. I expect a short term relief bounce in bonds before carnage sets in. Bottom line is that the 30 year bull run in bonds is done….period!
It would appear the bots are trading the 2367-2370 area on reflex and perhaps a few retail buyers as well. A downward gap as soon as enough victims…er, I mean traders are secured is likely…
Selling SVXY Jan 2018 200 strike calls for limit of 10.10…
Switched to 195 strike calls and filled at 10.35
50 contracts.
I amnow going to sit back and watch the insanity from the sidelines for now… 😉
It is very striking how the market continues to reject reversal signals. We had an island reversal a few weeks ago that was negated with a move on to new highs. I am starting to get the feeling, looking at the price action this last Friday, that we will once again see an exhaustion gap negated with another new high. I am not sure how that event would affect the wave count but in my experience this depth of a move back above a filled exhaustion gap is something I have never seen. It is almost looking to me like we are seeing a series of three wave moves in the recent price action. We have a very tricksy market. It is probably a good idea to continue to keep trades small until we get some greater directional clarity.
Feels like a trap. Bear trap, bull trap maybe get both. I never liked it that we didn’t make the primary 3 target 2424 area.
The only concept that makes sense in this market is that, I have some tulip bulbs for sale. My good friend Sir Isaac Newton just bought some, so it must be a great idea.
Commercial traders agree and continue to cheerfully allow retail traders to pile in against their own growing short positions. 🙂
Almost spat coffee at my screen. LMAO Charles.
Trade your tulip bulbs for some NZ property? 🙂
Lara — In a heartbeat. 🙂
Morning Verne, I’m sure you see them defending 2370 and shorting the VIX and GOLD. It’s pretty unfathomable that this can continue for so long. Also, lots of craziness in the short term treasury market this am. Gov’t appears to be out of cash.
Morning Chris. It truly is stupefying, watching what is going on. Futures had a very strange gap down this morning, small, but a gap nonetheless. Says “Sneaky Unwind” to me. Now as you aptly point out, they are pumping to keep folk interested….absolutely amazing!
If the crowd goes for it, on to new highs. If not, more downside gaps…
I see what you mean about the VIX attempted manipulation- just noticed that weird island reversal on the 15 min chart. SVXY underscores the insanity also trading higher. Selling a ton of call premium in my long term trading account.
Watch the short share availability on SVXY. I’ve been unable to locate shares to short from an array of clearing firms from GSEC to TD. Also, it seems the banksters favor backing the short gamma strategies, if not short gamma themselves, which works against all of us familiar with trading volatility.
Yep. Using Jan 18 leaps….ludicrous premium…
This market doesn’t seem to want to give up the ghost. Two things concern me. One, the qqqs are right on the verge of a new high and they sometimes lead the market. The comp has not followed, yet. Two, after the fed the market has rallied before, especially if going down into the fed meeting. This time may be different as the fed might actually raise the rates.
First for a change.
🙂