
Downwards movement is again unfolding as the Elliott wave count and classic technical analysis expected.
Summary: Some confidence today is had in the wave count with a breach of the Elliott channel. A deeper pullback looks very likely now to have arrived. It may last about one to three months and may end either 2,368 – 2,353 or 2,282 – 2,234. A new low below 2,277.53 would indicate the lower target range should be used.
New updates to this analysis are in bold.
Last monthly and weekly charts are here. Last historic analysis video is here.
MAIN ELLIOTT WAVE COUNT
WEEKLY CHART
Click chart to enlarge.
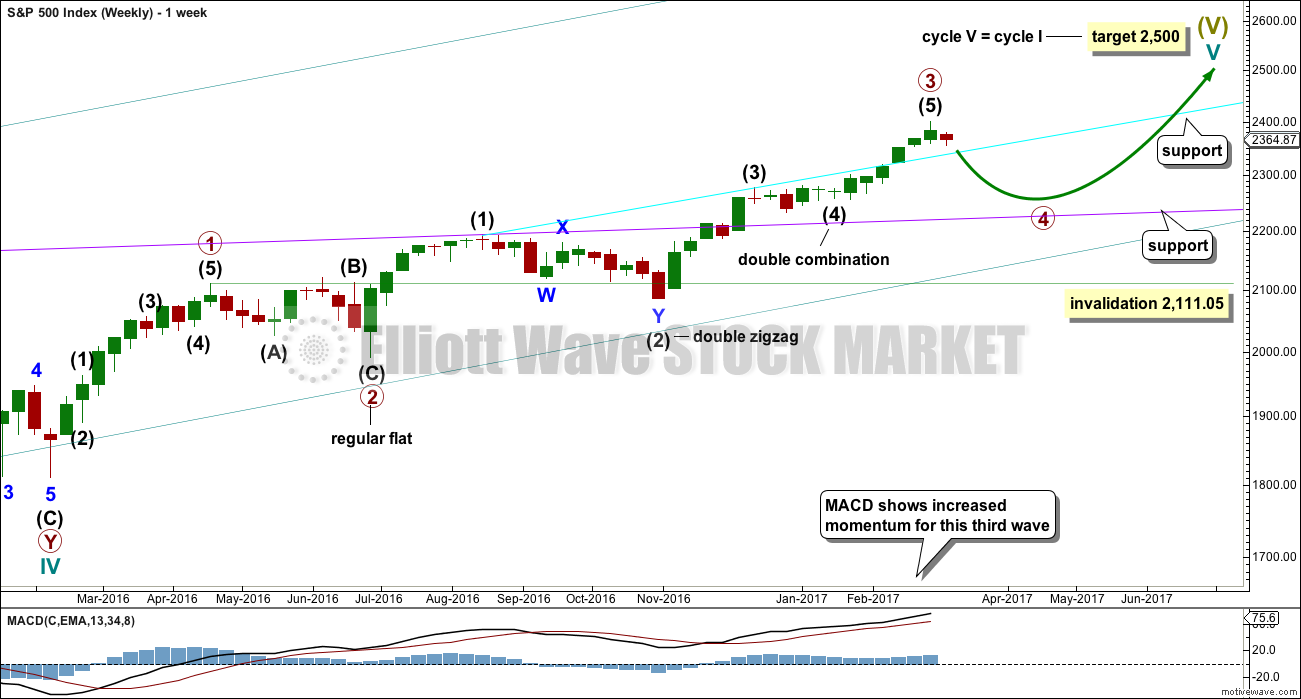
Cycle wave V is an incomplete structure. Within cycle wave V, primary wave 3 may now be complete.
Primary wave 4 may not move into primary wave 1 price territory below 2,111.05.
Primary wave 2 was a flat correction lasting 47 days (not a Fibonacci number). Primary wave 4 may be expected to most likely be a zigzag, but it may also be a triangle if its structure exhibits alternation. If it is a zigzag, it may be more brief than primary wave 2, so a Fibonacci 21 sessions may be the initial expectation. If it is a triangle, then it may be a Fibonacci 34 or 55 sessions.
As price moves lower look for support at each of the longer term trend lines drawn here across previous all time highs. Next support at the cyan line may be met soon.
A new low below 2,277.53 would invalidate the daily alternate wave count below and provide confidence that the pullback is at primary degree.
DAILY CHART
Click chart to enlarge.
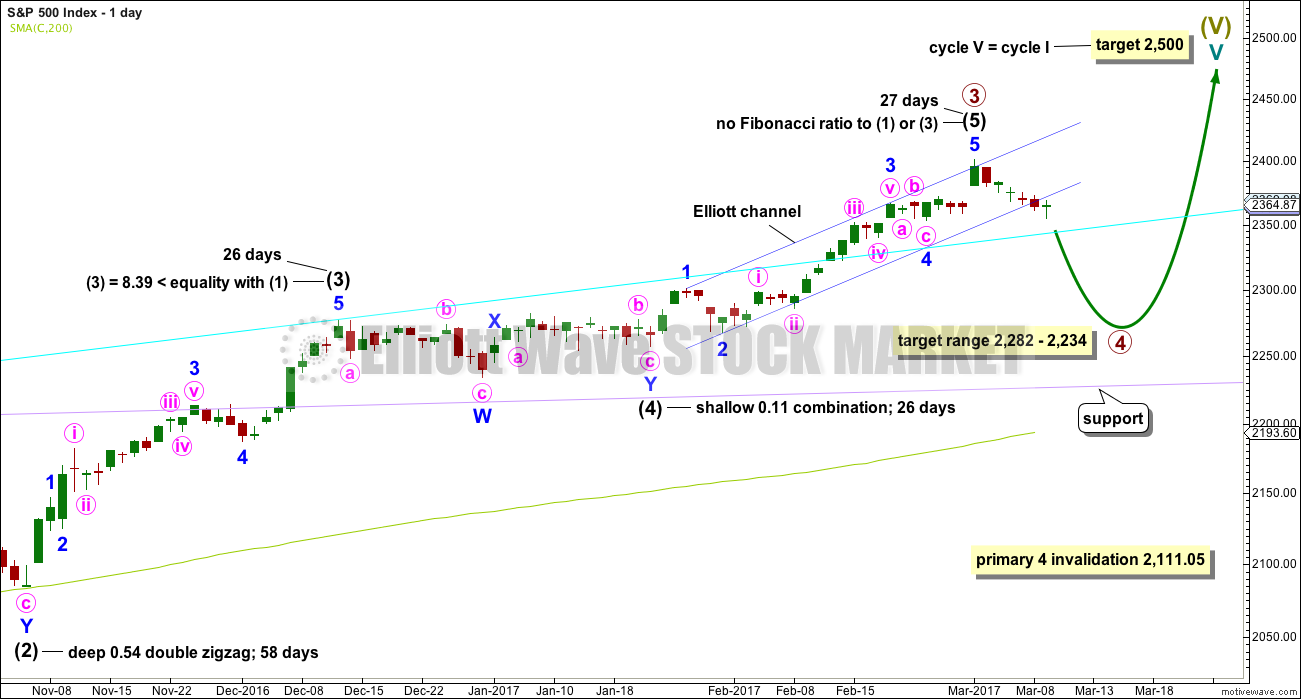
Intermediate wave (3) is shorter than intermediate wave (1). One of the core Elliott wave rules states a third wave may never be the shortest wave, so this limits intermediate wave (5) to no longer than equality in length with intermediate wave (3). If intermediate wave (5) is now over, then this rule is met.
Minor wave 3 has no Fibonacci ratio to minor wave 1. If minor wave 5 is now over, then it is 4.14 points longer than equality in length with minor wave 3. Price today has printed a full daily candlestick below and not touching the lower edge of the channel. This is defined as a breach of the channel. Further confidence in a multi week pullback may be had.
Intermediate wave (5) may have ended in 27 days, just one longer than intermediate waves (3) and (4). This gives the wave count good proportions.
The proportion here between intermediate waves (2) and (4) is acceptable. There is alternation. Both are labelled W-X-Y, but double zigzags are quite different structures to double combinations.
The following correction for primary wave 4 should be a multi week pullback, and it may not move into primary wave 1 price territory below 2,111.05.
HOURLY CHART
Click chart to enlarge.
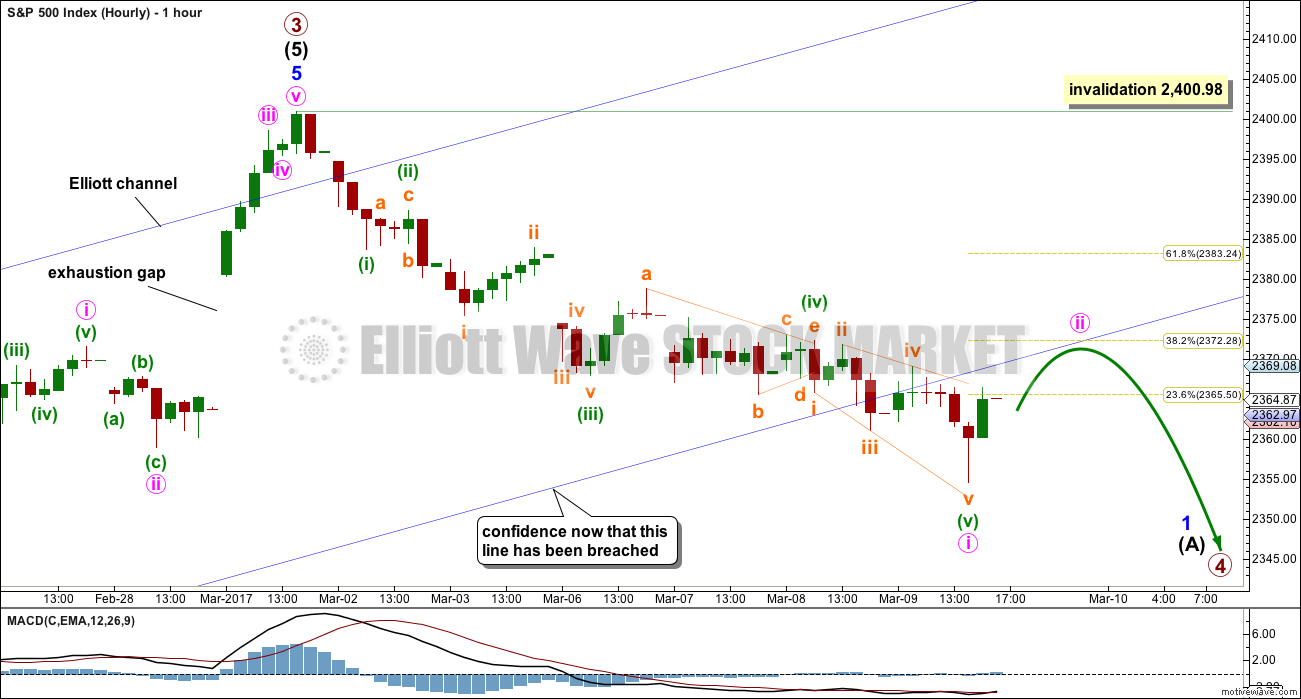
The last gap is now closed, so it is correctly named an exhaustion gap.
A new wave down at primary degree should begin with a five down on the hourly and daily chart levels. This may today be complete. The following correction for minute wave ii may not move beyond the start of minute wave i above 2,400.98.
Now that this channel has been breached the lower edge might provide resistance. If it does, and if price curves up to sit along this trend line, then it would offer a good entry opportunity to join a new downwards trend with a little more confidence for more risk tolerant traders. Stops would be set just above the invalidation point to ensure positions are not closed by whipsaws.
The lower edge of the channel does not have to provide resistance. It is possible that price may turn back up into the channel if minute wave ii is a deep correction ending about the 0.618 Fibonacci ratio.
Less aggressive traders may choose to patiently wait for this correction to end before entering long. The larger trend is still upwards and this is expected to be a counter trend movement. Counter trend movements do not usually offer good trading opportunities as they are choppy and overlapping. If trading during a counter trend movement, it is more important to take profits more quickly when they appear.
Always remember my two Golden Rules:
1. Always use a stop.
2. Do not invest more than 1-5% of equity on any one trade.
ALTERNATE DAILY CHART
Click chart to enlarge.
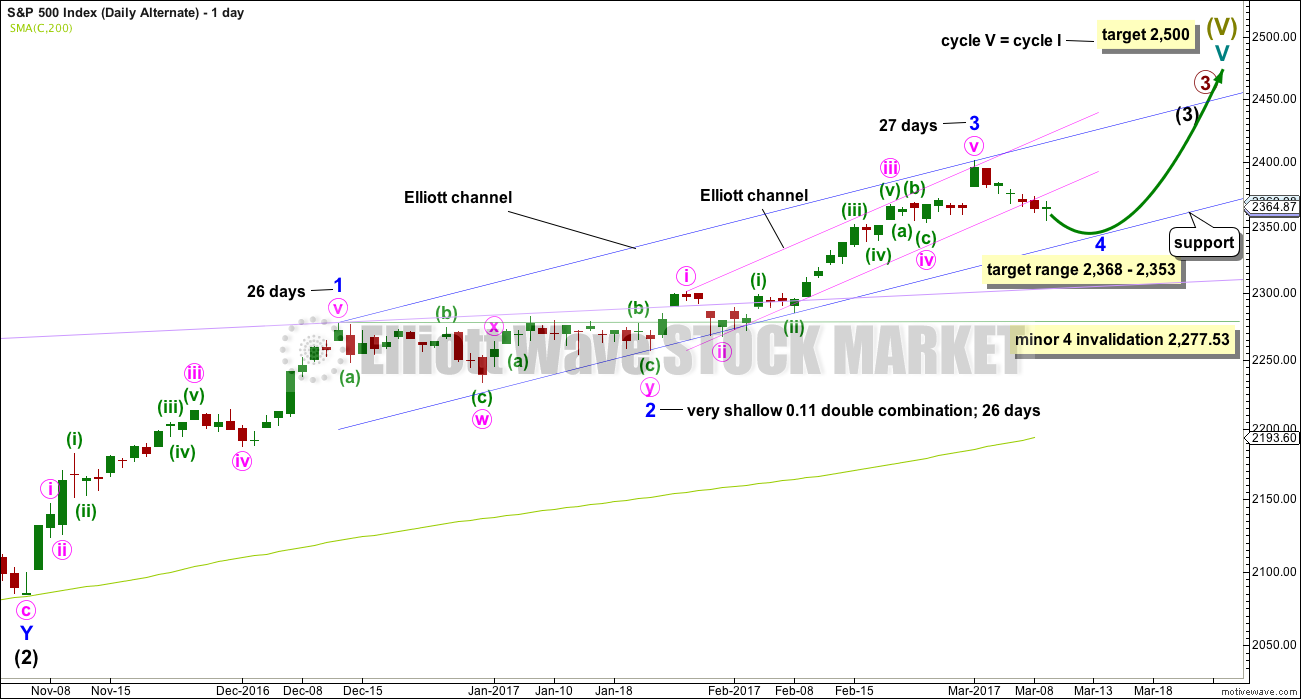
What if recent strong upwards movement was the middle a third wave at three degrees? This is supported by a fairly bullish look for the classic technical analysis chart.
All subdivisions are seen in exactly the same way for both daily wave counts, only here the degree of labelling within intermediate wave (3) is moved down one degree.
This alternate also expects a correction, but for minor wave 4, that may not move into minor wave 1 price territory below 2,277.53. A new low below this point would confirm the correction could not be minor wave 4 and that would provide confidence it should be primary wave 4.
Minor wave 4 may last about 26 days if it is even in duration with minor waves 1, 2 and 3. That would give the wave count good proportions and the right look.
Minor wave 4 may end within the price territory of the fourth wave of one lesser degree about 2,368 to 2,353.
Price today printed a full daily candlestick below the channel, so this adds confidence in a pullback being underway here. This wave count now expects choppy overlapping movement to find support at the wider blue Elliott channel.
Both wave counts expect essentially the same direction next, so the hourly chart for this alternate would look the same with the exception of the degree of labelling.
TECHNICAL ANALYSIS
WEEKLY CHART
Click chart to enlarge. Chart courtesy of StockCharts.com.
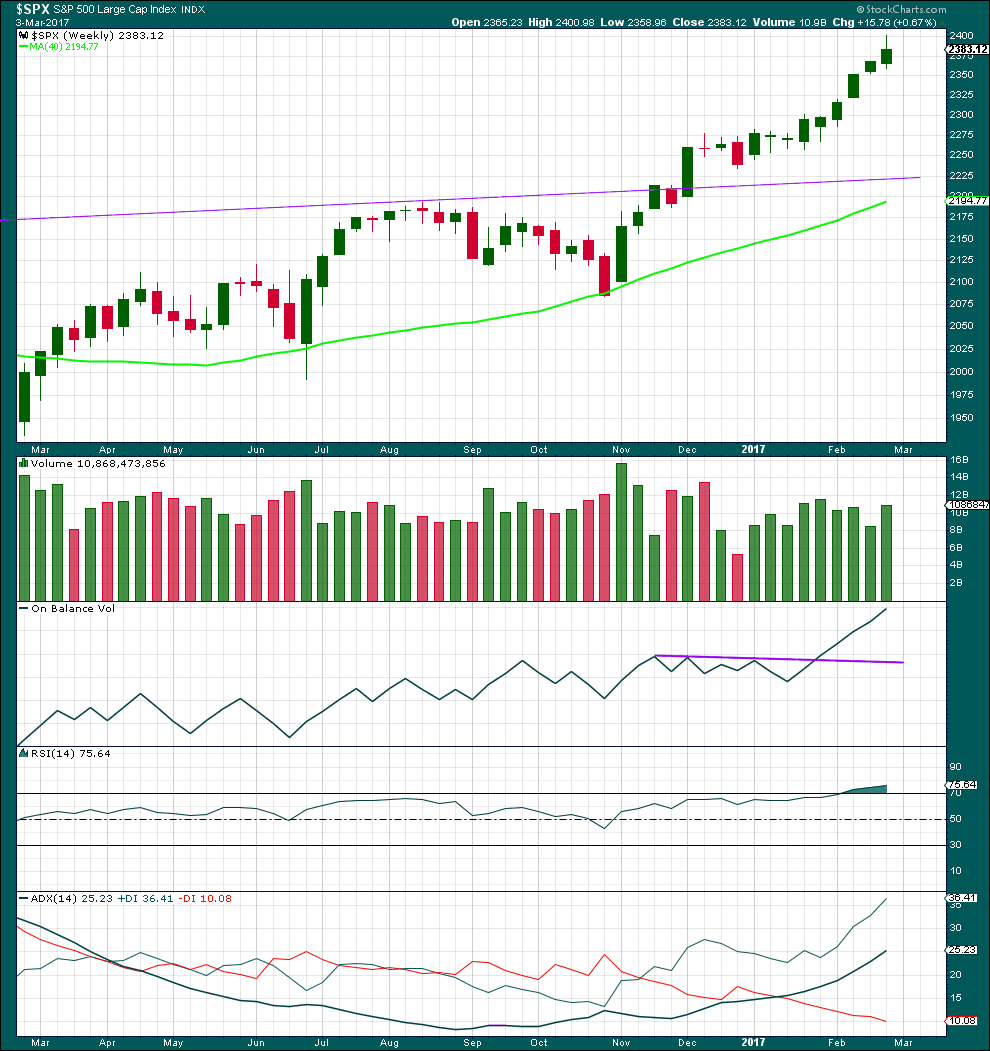
There are now nine green weekly candlesticks in a row. A larger correction may be expected soon.
Volume last week is stronger than the three weeks prior. There was good support last week for upwards movement.
On Balance Volume remains very bullish.
RSI is overbought, but in a bull market this can remain extreme for a reasonable period of time. If it begins to exhibit divergence with price at the weekly chart level, then a larger correction may be expected to begin. There is no divergence at this time.
This trend is not yet extreme.
DAILY CHART
Click chart to enlarge. Chart courtesy of StockCharts.com.
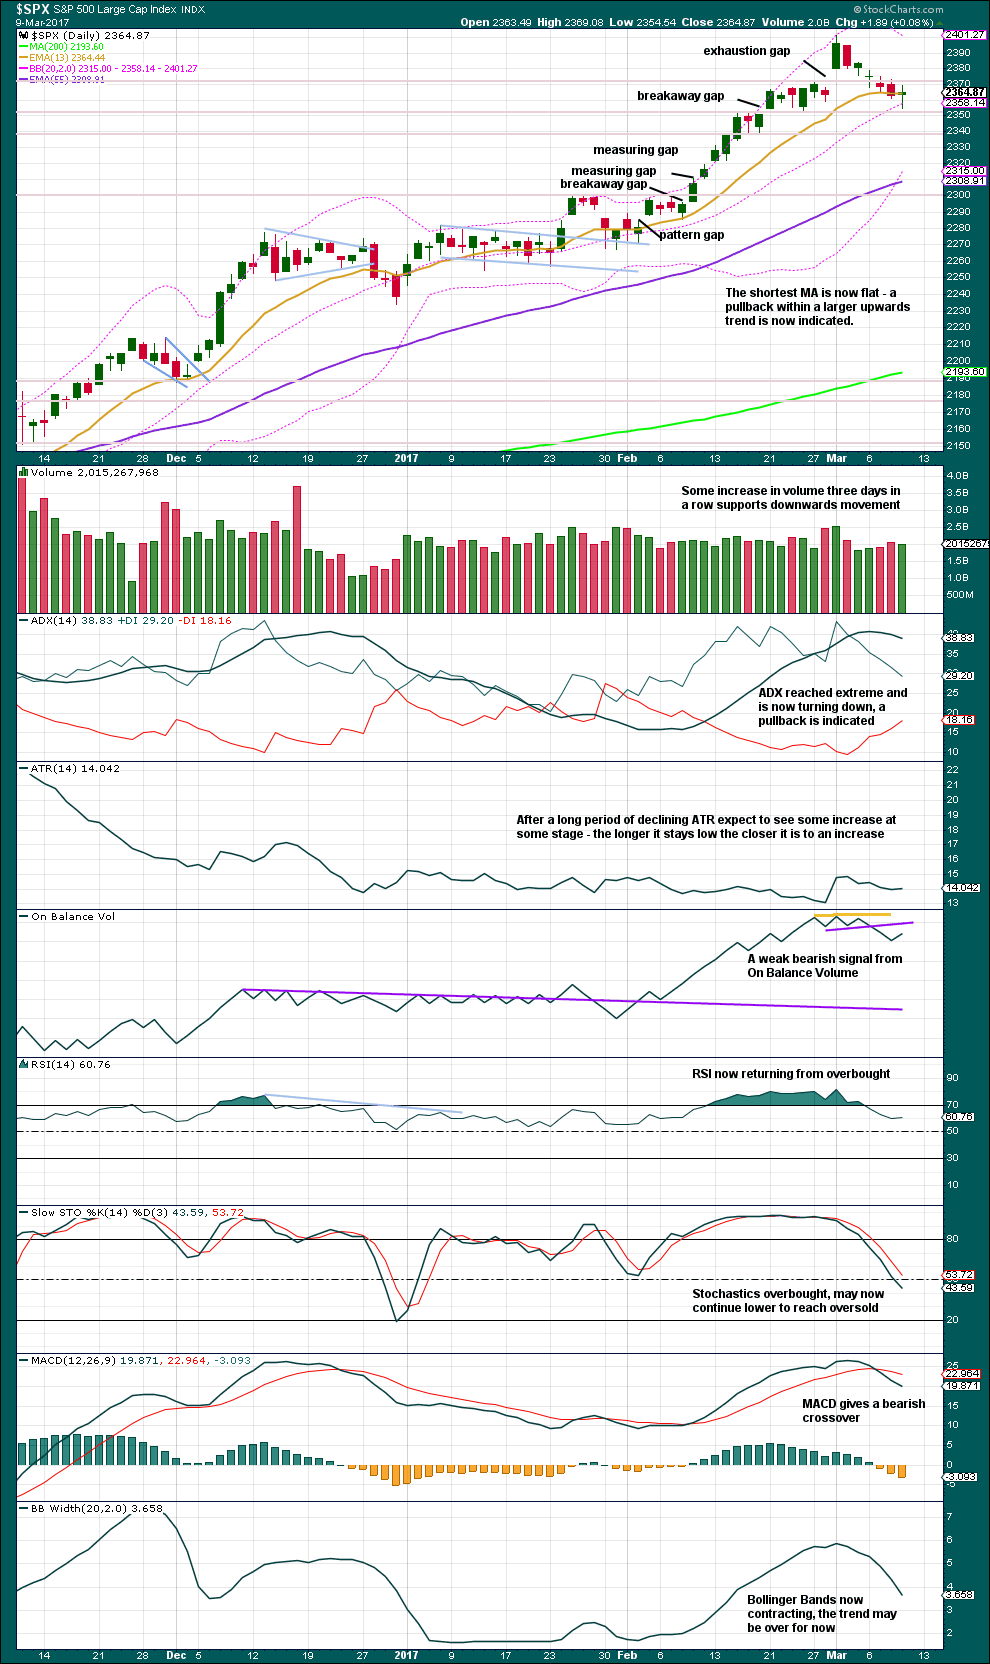
Today’s session made a lower low and lower high, but the balance of volume during the session is downwards and the candlestick is green. Lighter volume indicates less support during today’s session for upwards movement than there was yesterday for downwards movement. This is read as bearish.
Some more support lines are added today. Support is here about 2,350. Next support is about 2,340. There is strong support about 2,300.
On Balance Volume is bearish now.
Overall, expect the pullback to continue now until ADX is back down from extreme, Stochastics is oversold, and RSI may also reach oversold or at least neutral.
VOLATILITY – INVERTED VIX CHART
Click chart to enlarge. Chart courtesy of StockCharts.com.
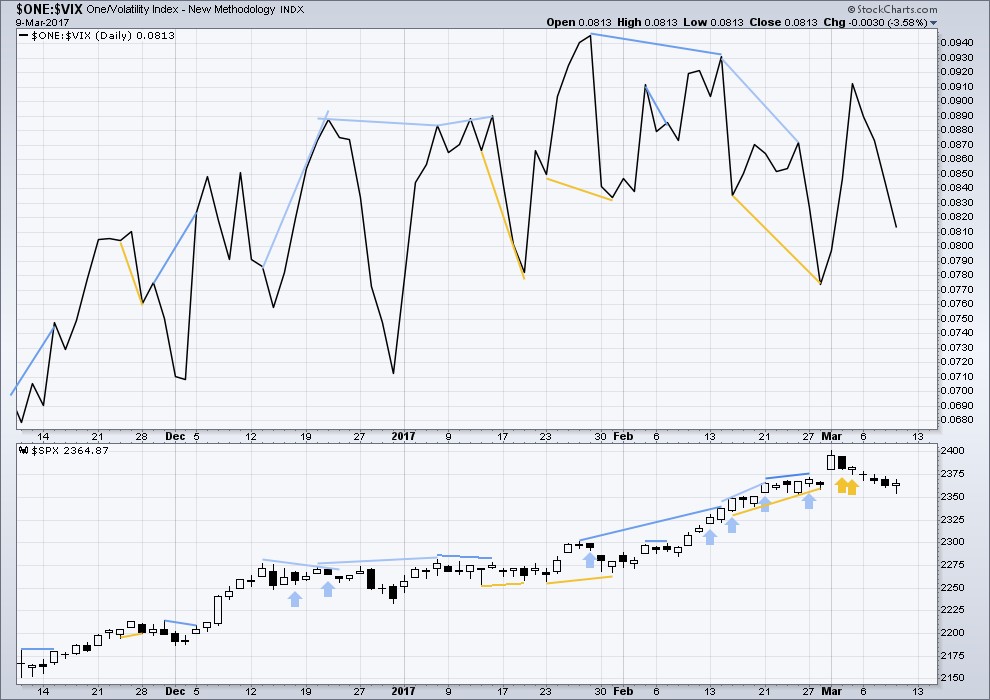
Normally, volatility should decline as price moves higher and increase as price moves lower. This means that normally inverted VIX should move in the same direction as price.
Bearish divergence and bullish divergence spanning a few short days used to be a fairly reliable indicator of the next one or two days direction for price; normally, bearish divergence would be followed by one or two days of downwards movement and vice versa for bullish divergence.
However, what once worked does not necessarily have to continue to work. Markets and market conditions change. We have to be flexible and change with them.
Recent unusual, and sometimes very strong, single day divergence between price and inverted VIX is noted with arrows on the price chart. Members can see that this is not proving useful in predicting the next direction for price.
Divergence will be continued to be noted, particularly when it is strong, but at this time it will be given little weight in this analysis. If it proves to again begin to work fairly consistently, then it will again be given weight.
BREADTH – AD LINE
Click chart to enlarge. Chart courtesy of StockCharts.com.
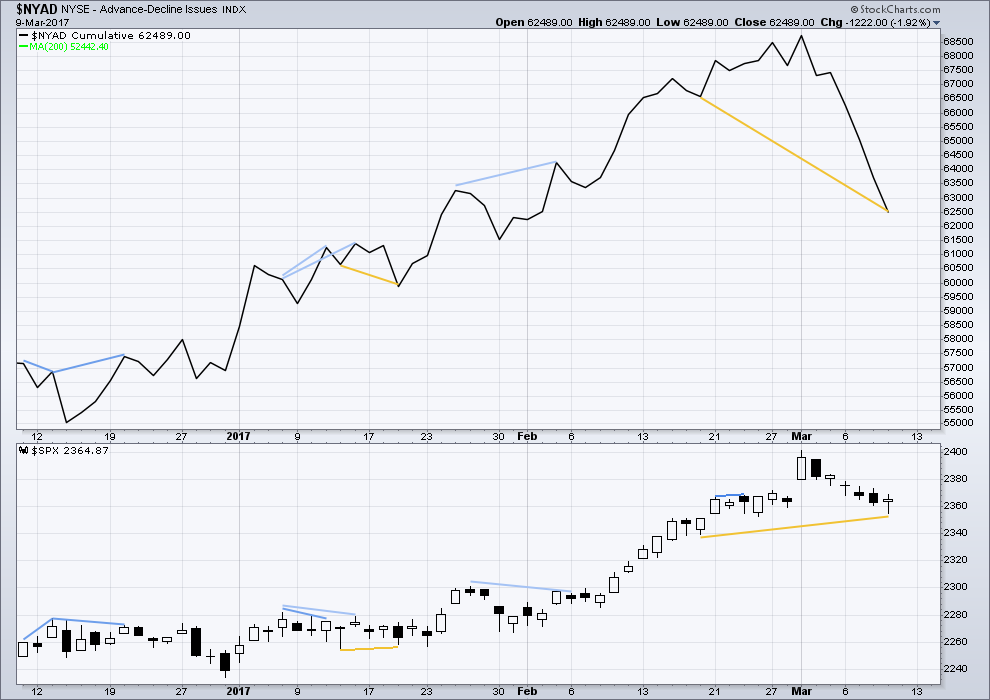
The rise in price has support from a rise in market breadth. Lowry’s OCO AD line also shows new highs along with price. Normally, before the end of a bull market the OCO AD line and the regular AD line should show divergence with price for about 4-6 months. With no divergence, this market has support from breadth.
Short term bullish divergence noted in prior recent analysis has not been followed by upwards movement. There is still mid term bullish divergence between price and the AD line. Today the AD line made a new low beyond the prior low of the 17th of February, but price has not made a new low. This indicates weakness in price.
This divergence has persisted now for a few days and yet it continues to not be followed by upwards movement. Mid term divergence has been noted before and failed. It looks like it may again fail in this instance.
DOW THEORY
The DJIA, DJT, S&P500 and Nasdaq continue to make new all time highs. This confirms a bull market continues.
This analysis is published @ 07:33 p.m. EST.
First weekly red close after 6 weeks or so. But not too much damage.
Hourly chart updated:
It looks like minute ii isn’t going to respect resistance. It’s moving back into the channel. The prior breach of the channel at the end of minute i still gives a little confidence in a trend change.
Minute i lasted six days. Minute ii to have good proportion may last about two to six days. It could be choppy and overlapping, a time consuming consolidation.
The 0.618 Fibonacci ratio will be the preferred target.
Chris Kimble’s chart – agrees with current count
Banksters won the match today in keeping things aloft.
Maybe next week we go South in earnest. Rolled all positions into next week expiration after stopped out with a loss.
Have a great weekend everyone!
You too Verne. Have a good rest, next week we may see a third wave down.
Minute 2 must be continuing as a zz as best I can tell…
This move down off this morning’s high really has the look of a leading diagonal but that seems very strange to me in a third wave…
Selling SVXY 132 puts for limit price of 1.50
MMS playing coy with 1.06/1.42 spread….I prefer to sell the 500 shares short over the weekend as I am sure they will stay in the money, but I probably won’t get a reasonable bid….
I’m calling in some air strikes on these wretched MMS. 🙂
I really hate these managed declines….!!!!!! 🙁
They artificially suppress volatility….
SVXY 125 puts expiring next week are still reasonable at. 1.55 ask. Should easily be a double. 🙂
Market makers are starting to get smart. They have widened the spreads on SVXY options expiring today so now hard to get in at a reasonable price. They are also getting quite ridiculous with bids on in the money chains. I would be only too happy to take have those puts executed….
We should be on the alert for more all day mucking around and once again a rapid conclusion to an impulse down and another end of day reversal. If that happens it could be we have waves at one degree higher. The banksters are not going to make it easy to trade the bear trend even for swing traders. Scalp ’em….
Not clear if minute 2 continuing or over as a quick ZZ. If is done we have another 1,2 and should soon pick up speed to the downside…
Adding SVXY 130 puts at 0.30 per contract…
Buying SVXY 132 puts expiring today for 0.75. Small initial stake of 5 contracts….
Is this still the correction or have we started a 5 up?
Don’t know yet. Waiting for VIX to give the all clear. If we are still in a downtrend it will print green before the close….we will also fill that gap from this morning if we are in just a second wave correction upwards…
Hi Nick,
We are in Minute ii (pink) as shown on the hourly chart (3 of 8) for the main count. It is expected to be three waves to a 38.2% – 61.8 % retracement ending between 2372 and 2383. We could be ending Minute ii anytime now or possibly meander for a couple of days. Minute i was about 6 days long. So a couple of day correction is not unreasonable.
Hope that helps.
Thanks Rodney
Well…maybe not so fast. Futures already fading. Even more interesting is Gold and Silver on the move…
Market likes the job report! Interesting. The FED no longer has any excuse and will have to raise interest rates. Why is Mr. Market happy?
Will scalp euphoria with a few SPY 237.5 calls expiring today a minute or two after the open. Should be good for a quick double. The excitement will probably last most of the day.
Vix was down by as much as 5% pre-market but has been steadily rising. If it opens green it would suggest the futures action will be short-lived.
Another hint for tomorrow. It is quite rare to have a potential third wave set up on a Friday. You don’t get too many opportunities to smash market makers into fine dust and they know it, and even better, they know that you know that they know it. If the third wave begins tomorrow and you are an options trader, it will be one of those rare occasions where executing doubling trades will be like shooting fish in a barrel. As I stated in previous post, keep an eye on VIX. It will tell ya all you need to know. See ya in the octagon….
Awesome! Thanks for the tip Verne. “See” you tomorrow 🙂
VIX now appears to have its gaze firmly fixed on the North Star. It seemed hardly fazed by the strong bounce off this afternoon’s lows. It may keep heading North during the minute two bounce tomorrow. Then again, it just might offer you one more glorious opportunity. As my Jamaican friends would say: “TEK IT MON!” 🙂
yup ,,, hi,,, one in a row
Hi Doc 🙂