
Downwards movement for the day remains above the invalidation point and the breakaway gap is offering support. Volume analysis today may help to determine the direction for tomorrow.
Summary: The picture is very bullish. Volume and divergence with VIX and the AD line all point to an upward day tomorrow. The breakaway gap may offer support. Move stops up to protect profits. The new target is at 2,424 and the limit is at 2,450.76.
If price makes a new low below 2,371.54, exit all long positions because a deeper pullback may have arrived.
Always follow my two Golden Rules:
1. Always use a stop.
2. Invest only a maximum 1-5% of equity on any one trade.
New updates to this analysis are in bold.
Last monthly and weekly charts are here. Last historic analysis video is here.
MAIN ELLIOTT WAVE COUNT
WEEKLY CHART
Click chart to enlarge.
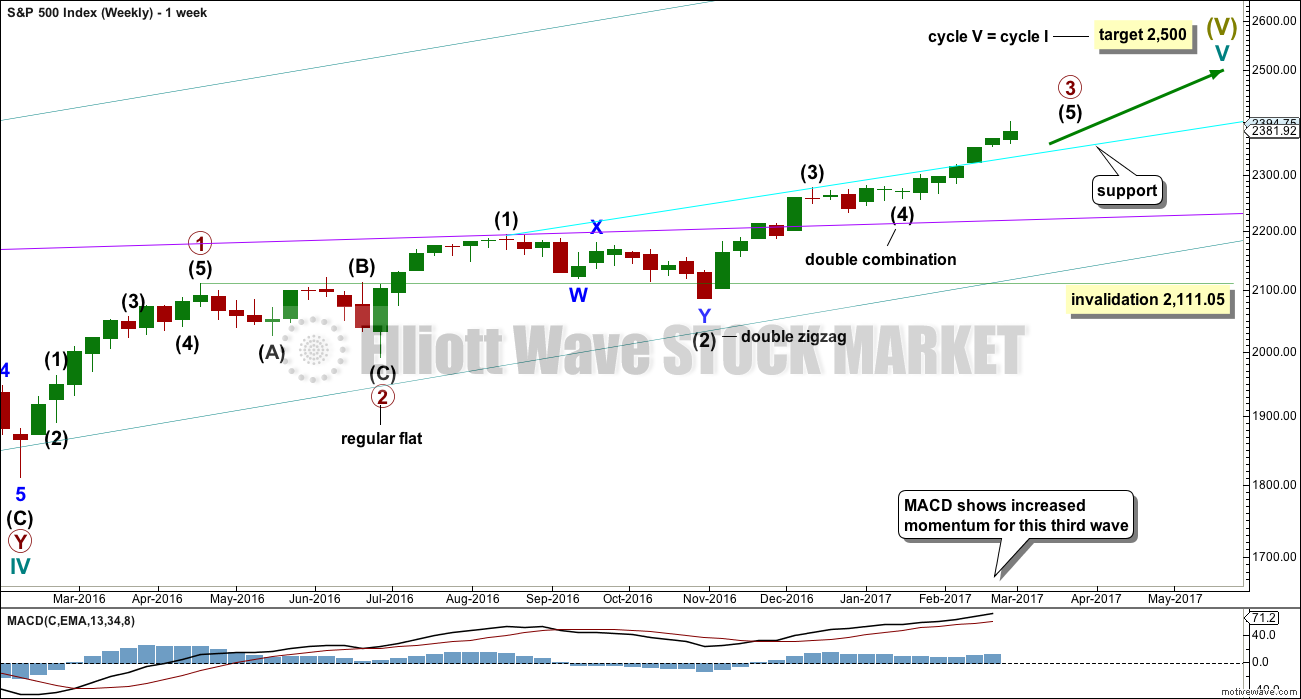
Cycle wave V is an incomplete structure. Within cycle wave V, primary wave 3 may be relatively close to completion.
When primary wave 3 is complete, then the following correction for primary wave 4 may not move into primary wave 1 price territory below 2,111.05.
Primary wave 2 was a flat correction lasting 47 days (not a Fibonacci number). Primary wave 4 may be expected to most likely be a zigzag, but it may also be a triangle if its structure exhibits alternation. If it is a zigzag, it may be more brief than primary wave 2, so a Fibonacci 21 sessions may be the initial expectation. If it is a triangle, then it may be a Fibonacci 34 or 55 sessions.
Primary wave 3 is now close to complete.
DAILY CHART
Click chart to enlarge.
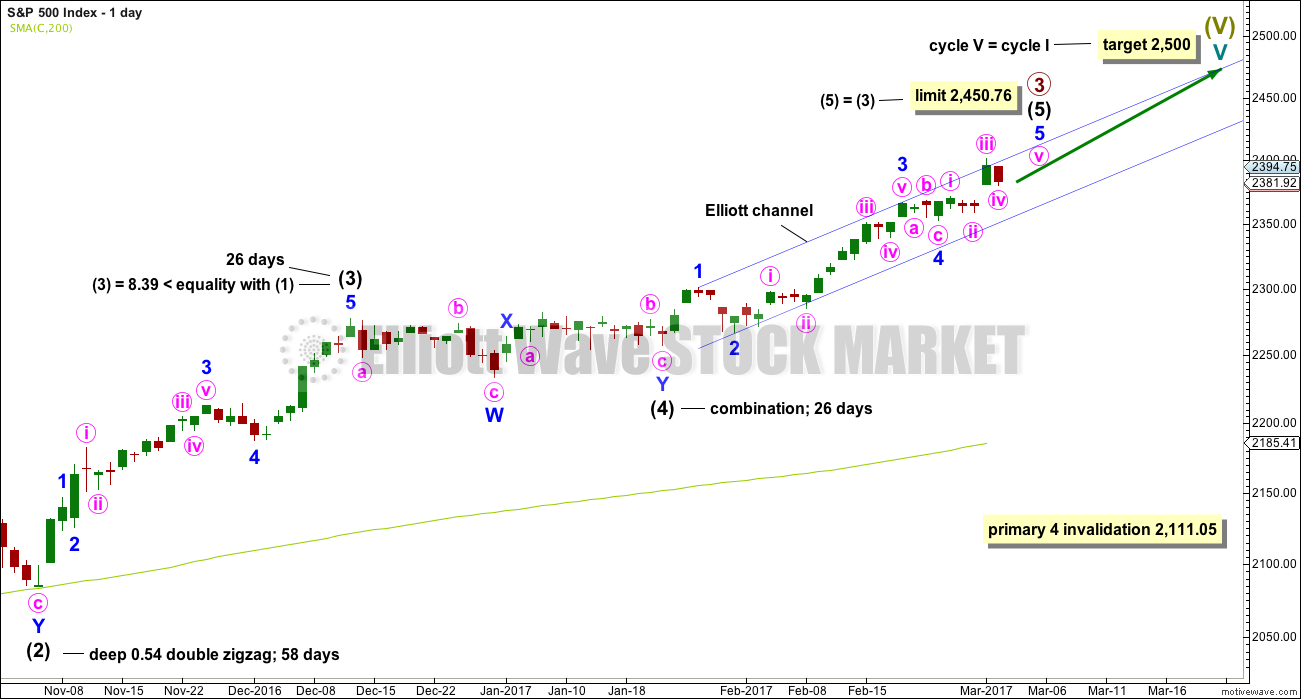
Intermediate wave (4) is a complete combination: zigzag – X – flat. It would have been even in duration with intermediate wave (3), both lasting 26 days.
Intermediate wave (3) is shorter than intermediate wave (1). One of the core Elliott wave rules states a third wave may never be the shortest wave, so this limits intermediate wave (5) to no longer than equality in length with intermediate wave (3) at 2,450.76.
Minor wave 3 has no Fibonacci ratio to minor wave 1. It is more likely that minor wave 5 will exhibit a Fibonacci ratio to either of minor waves 3 or 1.
Minor wave 2 was a deep 0.77 zigzag lasting three days. Minor wave 4 may be a complete single flat correction. There is perfect alternation between minor waves 2 and 4 and they have better proportion now on the daily chart.
Intermediate wave (5) has so far lasted 27 days. At this stage, an expectation of a Fibonacci 34 days total for intermediate wave (5) looks reasonable, so it may now continue for another 7 days or sessions.
The proportion here between intermediate waves (2) and (4) is acceptable. There is alternation. Both are labelled W-X-Y, but double zigzags are quite different structures to double combinations.
The invalidation point is now adjusted significantly. Minor wave 5 is very close to completion; it is possible that it could end tomorrow. When it is complete, then that would complete for this wave count the entire wave of primary 3. The following correction for primary wave 4 should be a multi week pullback, and it may not move into primary wave 1 price territory below 2,111.05.
HOURLY CHART
Click chart to enlarge.
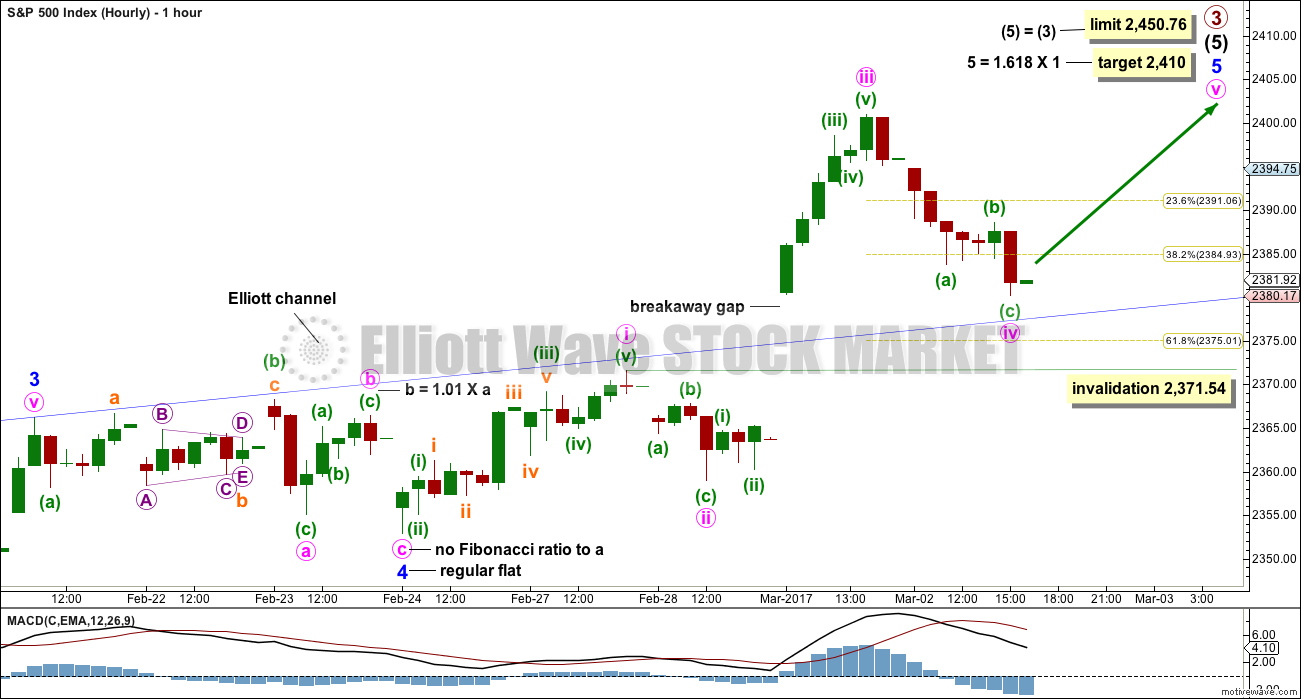
Another breakaway gap should provide support while the trend continues. So far this gap is providing support. If it is closed, then it would be possible that primary wave 3 could be over. That would indicate a substantial trend change.
There is no Fibonacci ratio between minute waves iii and i.
Minor wave 5 has passed equality with minor wave 1 and the structure is incomplete. A new target is calculated using the next likely Fibonacci ratio to minor wave 1.
Minute wave iv may not move into minute wave i price territory below 2,371.54.
At this stage, invalidation of this hourly wave count would indicate primary wave 3 may be over and primary wave 4 may have begun.
ALTERNATE DAILY CHART
Click chart to enlarge.
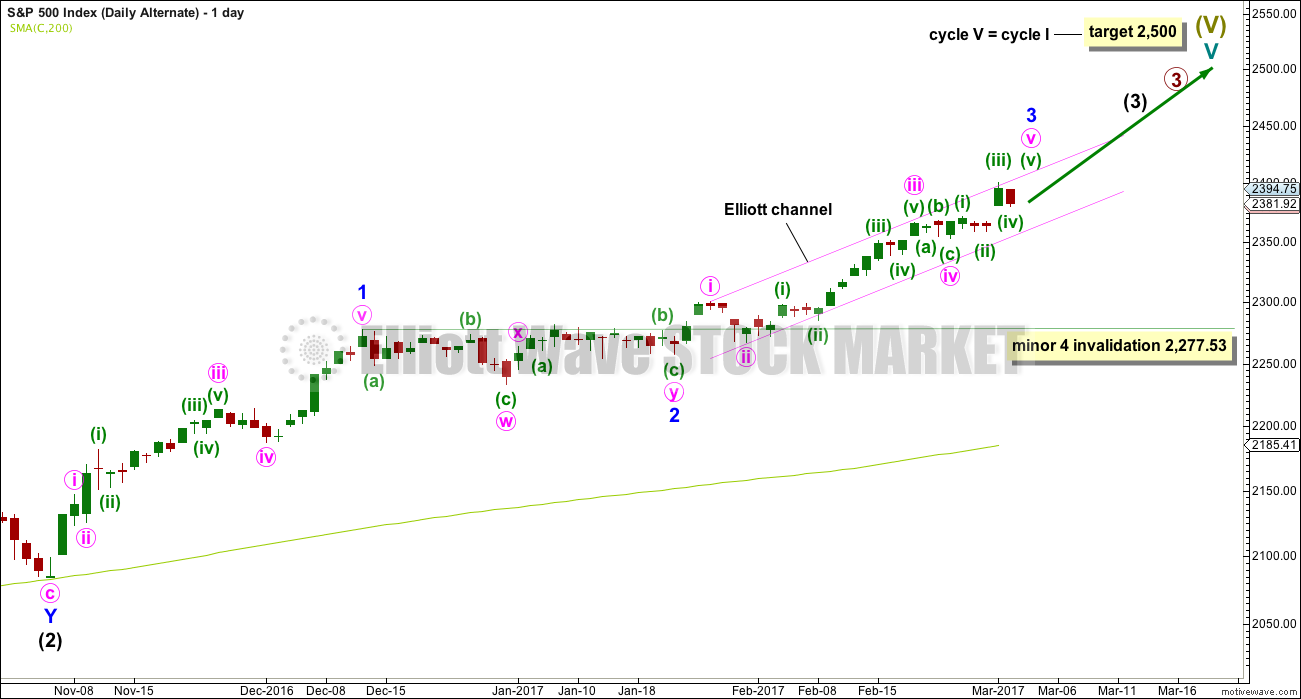
What if recent strong upwards movement was the middle a third wave at three degrees? This is supported by a fairly bullish look for the classic technical analysis chart.
All subdivisions are seen in exactly the same way for both daily wave counts, only here the degree of labelling within intermediate wave (3) is moved down one degree.
This alternate also expects an upcoming correction, but for minor wave 4, that may not move into minor wave 1 price territory below 2,277.53. A new low below this point would confirm the correction could not be minor wave 4 and that would provide confidence it should be primary wave 4.
Both wave counts expect essentially the same direction next, so the hourly chart for this alternate would look the same with the exception of the degree of labelling.
TECHNICAL ANALYSIS
WEEKLY CHART
Click chart to enlarge. Chart courtesy of StockCharts.com.
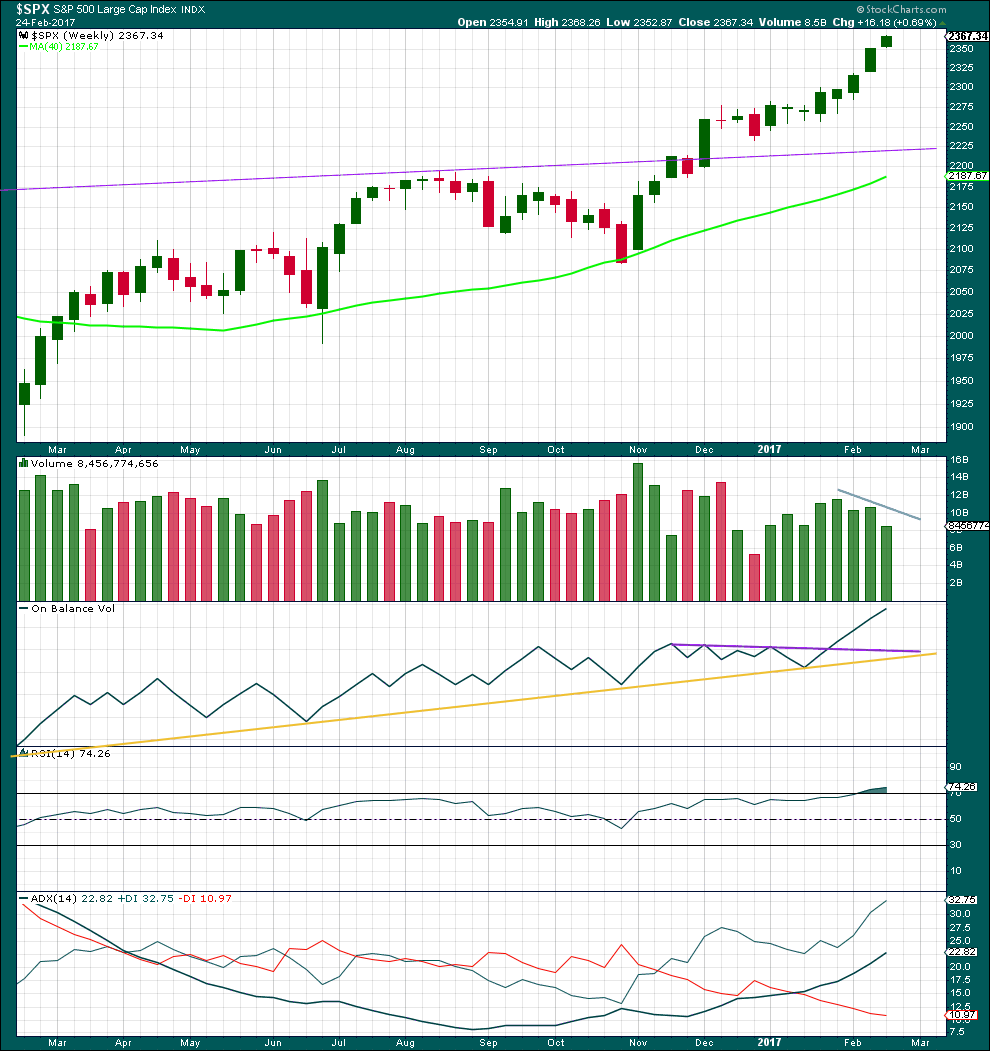
There are now eight green weekly candlesticks in a row. A larger correction may be expected soon, but not quite yet.
There has been some decline in volume over the last three weeks. This trend is showing early signs of weakening.
On Balance Volume remains very bullish.
RSI is overbought, but in a bull market this can remain extreme for a reasonable period of time. If it begins to exhibit divergence with price at the weekly chart level, then a larger correction may be expected to begin. There is no divergence at this time.
This trend is not yet extreme.
DAILY CHART
Click chart to enlarge. Chart courtesy of StockCharts.com.
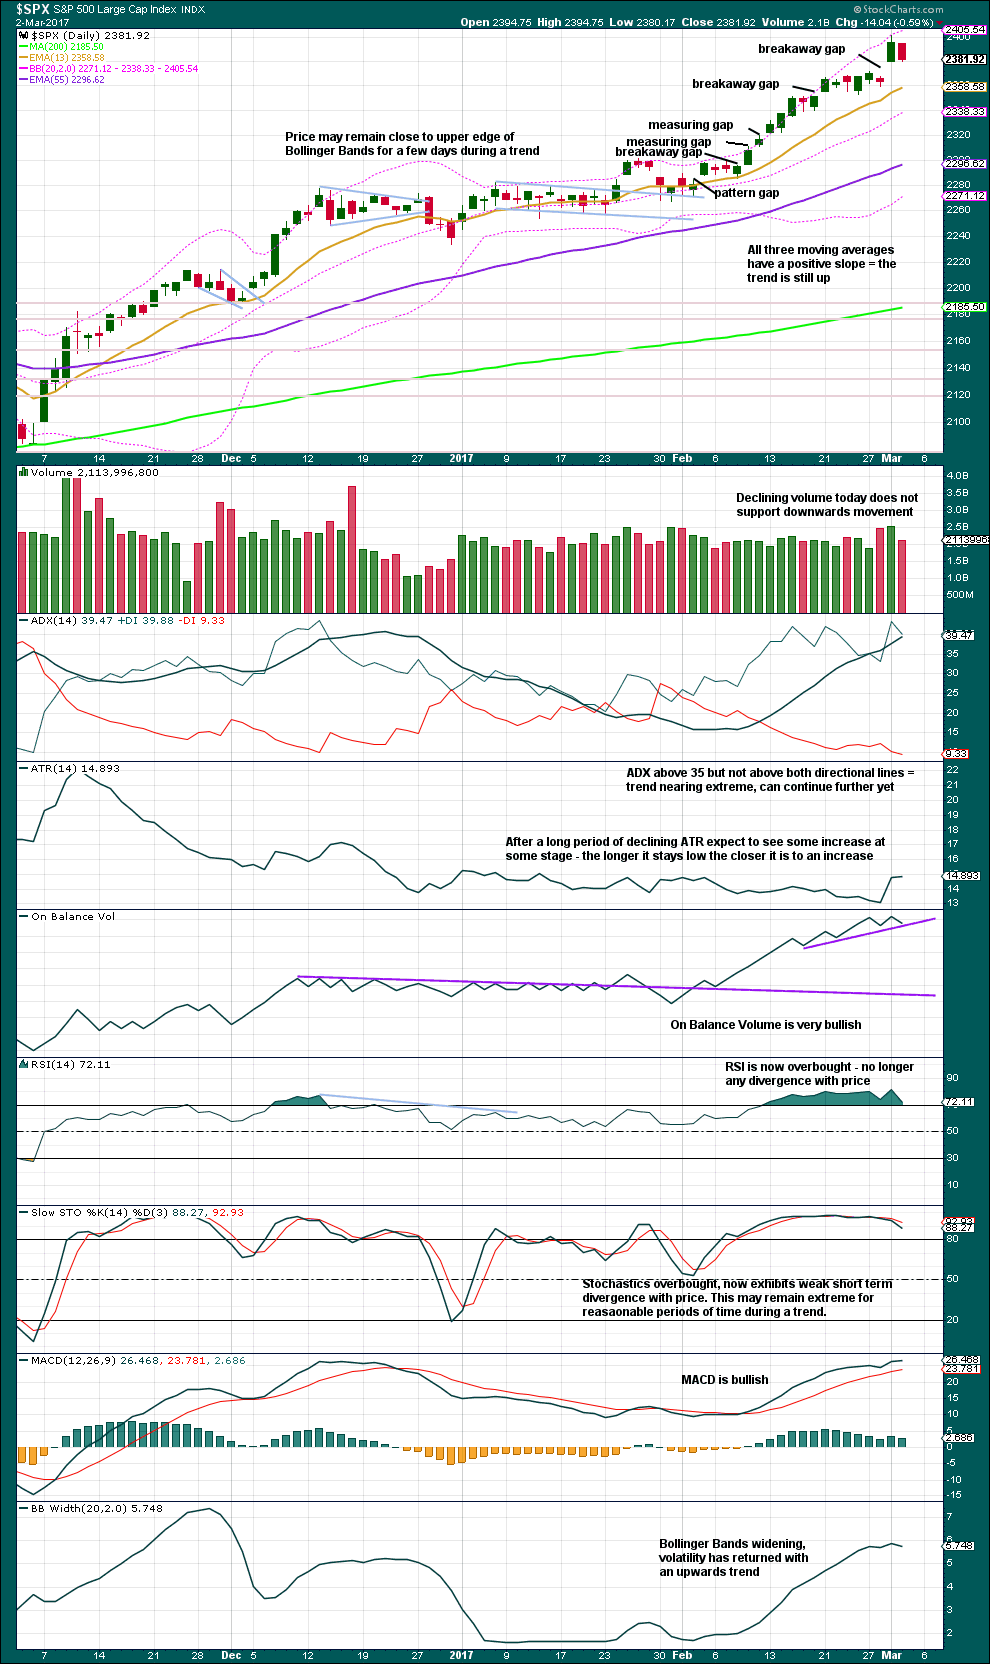
A new trend line is added now to On Balance Volume. If that is breached by more downwards movement tomorrow, it would offer a reasonable bearish signal. In the first instance, expect this line to offer support.
A decline in volume today for a downwards day, after strong volume for yesterday’s upwards movement, indicates today may more likely be a small counter trend pullback.
There is still a bit of room for the upwards trend to continue as ADX is not yet very extreme.
VOLATILITY – INVERTED VIX CHART
Click chart to enlarge. Chart courtesy of StockCharts.com.
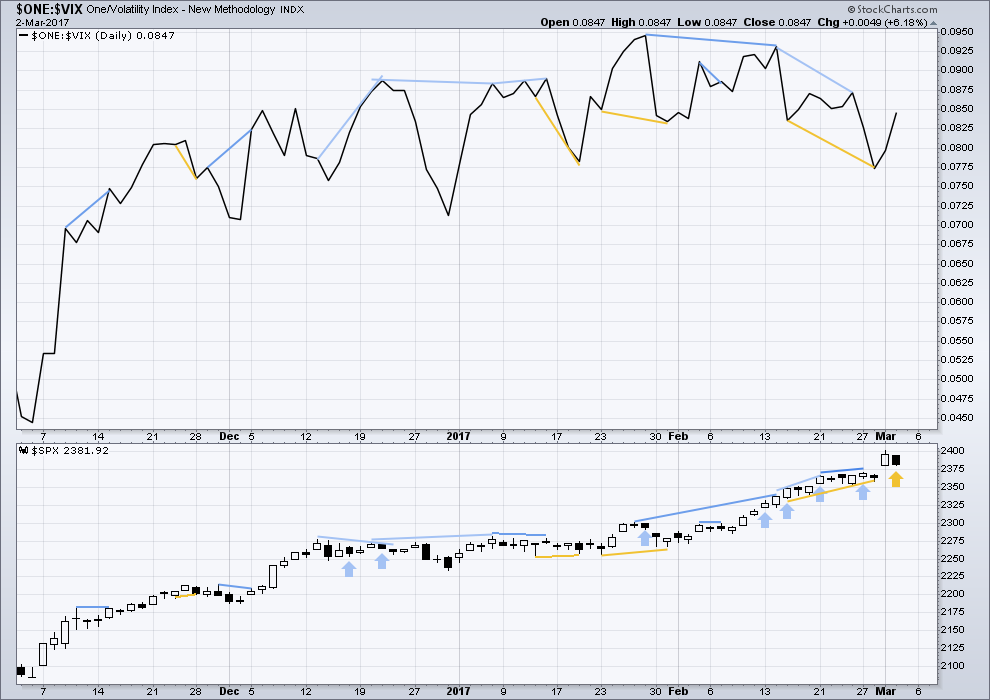
Normally, volatility should decline on rising price. There is double multi day divergence now between price and inverted VIX. This is bearish.
Either VIX is now decoupled from this market, or this persistent divergence will be resolved by primary wave 3 ending sooner than expected and primary wave 4 beginning very strongly. This divergence signals traders to be very cautious; assume the trend remains the same, but if entering the trend be aware for the potential here of a swift drop in price and use stops accordingly. Risk no more than 1-3% of equity.
There is single day divergence between price and inverted VIX today: inverted VIX moved strongly higher while price moved lower today. This divergence indicates there was something possibly wrong with price during today’s session. This divergence is interpreted as bullish. This supports the Elliott wave count, which expects upwards movement tomorrow.
BREADTH – AD LINE
Click chart to enlarge. Chart courtesy of StockCharts.com.
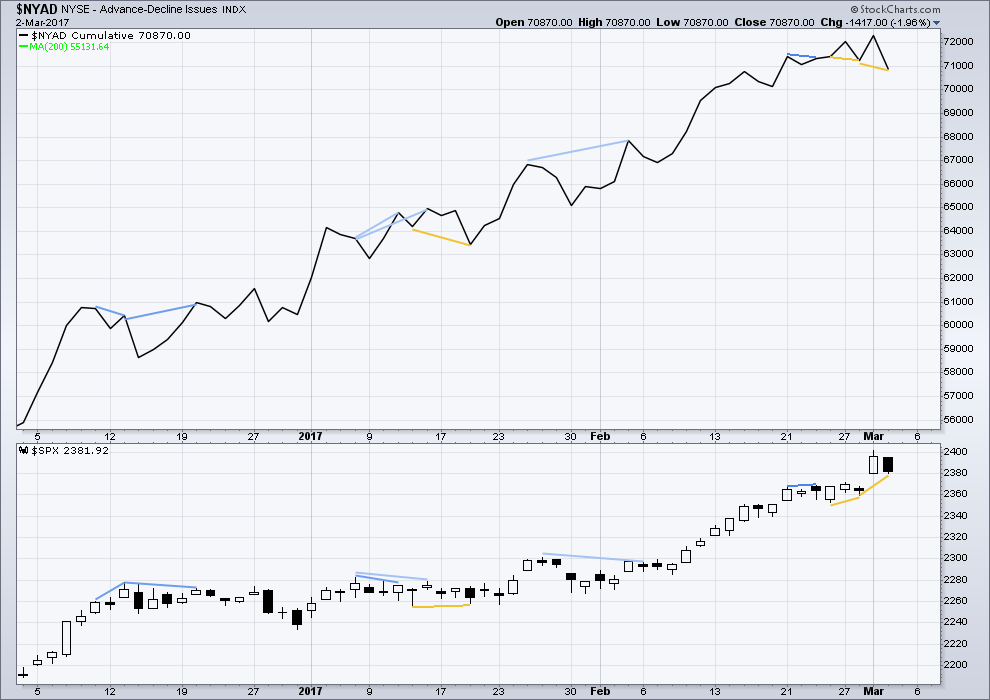
The rise in price has support from a rise in market breadth. Lowry’s OCO AD line also shows new highs along with price. Normally, before the end of a bull market the OCO AD line and the regular AD line should show divergence with price for about 4-6 months. With no divergence, this market has support from breadth.
There is again short term bullish divergence today. The AD line has made a new low below the prior low of the 28th of February, but price has not made a corresponding new low. This divergence indicates weakness in downwards movement today. Tomorrow may be an upwards day.
DOW THEORY
The DJIA, DJT, S&P500 and Nasdaq have made new all time highs in December of 2016. This confirms a bull market continues.
This analysis is published @ 08:56 p.m. EST.
http://www.cnbc.com/2017/03/03/brace-your-portfolio-stocks-are-set-to-pop-and-then-drop-says-strategist-jim-paulsen.html
Signs of a top….school makes 24 million on snap chat ipo……dr Faber is mocked and ridiculed on CNBC when he warns of a market top…..probably be a bull on Barron’s this weekend.
Minute waves ii and iv are both zigzags. There no alternation in depth or structure. Sometimes the S&P does this, I’ve seen it before. It’s not common, but no rules are violated. Alternation is a guideline, not a rule.
The long lower wick on the last hourly candlestick is bullish. Three green candlesticks in a row is Three White Soldiers, bullish. It does look like minute iv is done here. The gap is not fully closed, like the last one.
Minor 5 really does look like it needs one final high, one last wave up, to look right as a five wave impulse.
Failure to fill the open gap from Tuesday after coming down this far has to be viewed as bullish short term. This kind of sideways movement of late has been consolidation ahead of a move higher and that is probably what we have. I will patiently wait for the move up to re-deploy bearish SPY March 31 240/245 call credit spreads. Currently bid at just under a buck, they should go for at least 1.25 on the fifth wave up. Not much to see here I am afraid.
Have a great weekend everybody!!
Fourth wave getting long in the tooth. Ideally we see the possible minuette fifth down complete followed by our final minute fifth up to pull a few more eager beavers into the weekend….
Looks like minute-iv ended at the .618 retracement of minute-iii in 3 clear waves. Another down move from here would look like 5 down – not good for short-term bulls.
Yet another rising wedge on the five minute chart…some kind of fourth still developing?
IWM already into price area of Tuesday’s candle but yet has not technically filled the closing gap from 137.84
have been thinking long and hard about what could possibly be the banksters’ end game.
These clowns may be reckless and ruthless, but they are certainly not retarded. I do not for one second believe they are under the delusion that they can make the market go up indefinitely. No doubt that is exactly what they would like market participants to think but I think they know better. They have seen this movie before. Exactly what then, are they up to you ask? Here is what I think. I think they want to prevent another market crash. As long as they can keep the crowd optimistic by relentlessly buying the dips, they not only convince the crowd to join in (low volume calls into question their success in that regard) they can avoid panic selling, as well as aggressive short selling. This allows them to unwind their leveraged positions slowly over time, and manage an “orderly” decline in the markets. We have seen this happen in the past. This will work as long as folk holding long positions don’t notice or realize instead of a market crash, what we have is a long, slow, steady decline off the market top. I am not sure how such a theory would work out in terms of the EW count but we have certainly seen some long and drawn out waves in the markets of late, which I think reflects the “managed” psychology. Of course, any type of so called “Black Swan” event would throw this theory off the 99th floor to its certain doom…
Vernon Smith was the first economist to find a bubble in an experimental market. One surprising finding of the experiment was that a bubble was more likely when short selling is made difficult. The other traits such as availability of margin, higher ratio of inexperienced players and lottery characteristics of a security may have been expected, but the short selling one looks a bit surprising.
When the Chinese stock market crashed after it’s high in June 2015 I watched their government do anything and everything it could to try and stop price from falling. They utterly failed, it kept falling.
So with that example and Smiths experiment in mind, I have a theory.
My theory is that when central banks and governments interfere in a market they exasperate the normal market behaviour. They make it more extreme.
The banksters have been interfering in the US, Europe and probably other parts of the globe too. It seems to be the fashion. So far they’re stretching this bull beyond normal limits it seems, into the realm of euphoria which is not supported by underlying facts. This cannot go on forever.
Simple physics says the higher it goes the harder it falls, it will have a greater distance over which to accelerate.
My theory is that when the fall starts (and they can’t prevent it) they’ll interfere even more. Maybe they’ll outlaw short selling, maybe they’ll make all kinds of stupid rules like you can’t trade with stops… whatever they do will make it worse. They’ll want to halt the decline, but their interference will engender more fear. IMO.
So, in short, my answer to your musing Verne is that I think when it crashes it’s going to be spectacular, and they will make it more so while trying to hold it up.
Bless you my child! I like your theory much better than mine. Great for volatility! 🙂
Yep. I think we’ll have a wild ride!
Laura’s fourth wave invalidation number of 2371.54 approaches…will it hold?
Small bites are being taken out of the open gap. Let’s see how far it goes…
When it comes to gaps, a small bite is pretty much the same as swallowing the whole enchilada…a breakaway gap should not get a second look…the banksters are going to have to pump harder it appears… 🙂
The last breakaway gap was from 2,351.16 to 2,355.23.
Minor 4 did move into it somewhat, as low as 2,352.87, but it didn’t fully close that gap.
We may see a similar situation here again.
This breakaway gap was from 2,371.54 (I’m taking it as the price extreme in the last consolidation) to 2,380.33. So far minute iv has moved partially into that gap, but not closed it.
So that seems to be the situation ATM.
At what point does one conclude that what is being presented to us visually has been totally divorced from reality? VIX again down in a sluggish market. I really don’t at all like what I am seeing and far worse, I don’t understand it. Moving to the sidelines for now….
I am waiting here on the sideline to greet you my friend. I too am concerned with what appears to be a parabolic rise. Earlier today you stated that parabolic rises usually do not end well. I cannot remember any parabolic rise (or fall) that did not collapse onto itself. The health of the bull is dependent upon some relief, letting a bit of air out of the balloon before it pops. We need a month long consolidation or correction.
Rodney, this next fed hike, I think the market will take it in its stride. No selloff.
further Im leaning too a 4 too 6 week consolidation. I hope Im wrong as we need a reset too the mean. Its now out of control. I completely don’t understand any of it.
What I will share with you all is from august too election day I made serious money lets say a extremely modest home. I shorted the market for so long. However I now have been sqeezed out of every position, I had.
Im sitting on the sidelines until I see deep red starting from asia through too london the going on towards New york. I just don’t understand nada anymore.
Too tired of seeing 0.5 per cent moves on a daily basis, northbound
This website is somewhat of a revelation for me. Thank god lara and all the other users that post as I am learning per the minute
I have to confess I have been wrong about this market many times in the past. It has powered higher despite my misgivings and I have literally had to force myself to execute bullish trades. My great concern now is that instead of a correction, we get a detonation. What on earth is wrong with simple good old impulsive waves? 🙂
So nice to have some company! 🙂
Exactly! The impulsive buying of the PPT is counterproductive.
I have packed my camping equipment, won’t be back until I see a reset
The month of March is notorious for ushering in significant trend changes. I think the key number to watch is 2364.64 I have literally never seen as many gaps up at the open as we have seen the past few weeks -totally unprecedented. Either we are starting a monster new bull run or we are ending one. I think odds favor the latter. I am expecting the gap from Wednesday’s close could provide some insight about what to to expect going forward. If it gets filled tomorrow we could be done with this impulsive wave up. How swiftly and decisively remaining open gaps are filled will I think speak volumes about what is unfolding. This last move up was parabolic and these seldom end well. They are generally terminal moves. Trade safe!
Verne
As crazy as this sounds I don’t think any serious selling will occur. I still think another run towards 2450. Time will tell tho
One thing is clear. The banksters are buying. They continue to be mortally terrified of any significant decline as they are fully aware of the fragility of the bubble they have inflated. Another interesting statistic I recently came across is that these clowns are legally permitted to leverage as high as 35:1! At least that is what they actually disclose. It goes a long way toward explaining the remarkable continued levitation on such little volume. They are now trying to arrest a decline of what is clearly a parabolic rise and I for one am intensely curious to see how long they can delay it. The wave count calls for a a bit more upward movement and I sure hope we get it. These guys are all in and my expectation is that they will make a valiant effort to keep things elevated over the weekend so they can pump futures for a bit more breathing room. If we get a truncation today or some kind of bearish engulfing candle, especially if it is huge, it would suggest the cabal is running out of steam. They will attempt to keep Wenesday’s gap from being filled at all costs. Let’s see how they fare. They cannot afford to see a big decline this early as no one is really selling the market; it would be falling under its own bloated ennui…
Verne honestly and I am aware of Lara’s take on this. Social mood versus politics but I am a believer in the sense that this market is waiting for these tax proposals. The middle class will stand to benefit apparently but if ze fuhrer brings in the repatriation tax. This bubble as you allude too which I agree will be bigger than ben hue. I’m really not expecting and sell of any volume until after the summer. Yes it sounds crazy. Yes I agree the market is totally broken and I do hope for normality but I think if it was going too sell off the big guys would have sold out a long time ago. I read an article that money is still on the sidelines from fixed income. It’s then if the big boys in fixed income go for rotation into equities then really god help the world.
things that make you go Hmmm,, futures not looking very healthy, that invalidation point not far away if this holds up..
three in a row,, woo hoo
Triple drat!