
A downwards day was expected for Tuesday’s session.
There are only now two hourly Elliott wave counts.
Summary: The situation is unclear: volume is bearish short term while divergence between price and VIX, and price and the AD line, is bullish short term.
Assume more downwards movement as most likely to a target at 2,354. But if price makes a new high above 2,367.79, then expect more upwards movement with an increase in momentum to a target about 2,382*edit: 2,397.
New updates to this analysis are in bold.
Last monthly and weekly charts are here. Last historic analysis video is here.
MAIN ELLIOTT WAVE COUNT
WEEKLY CHART
Click chart to enlarge.
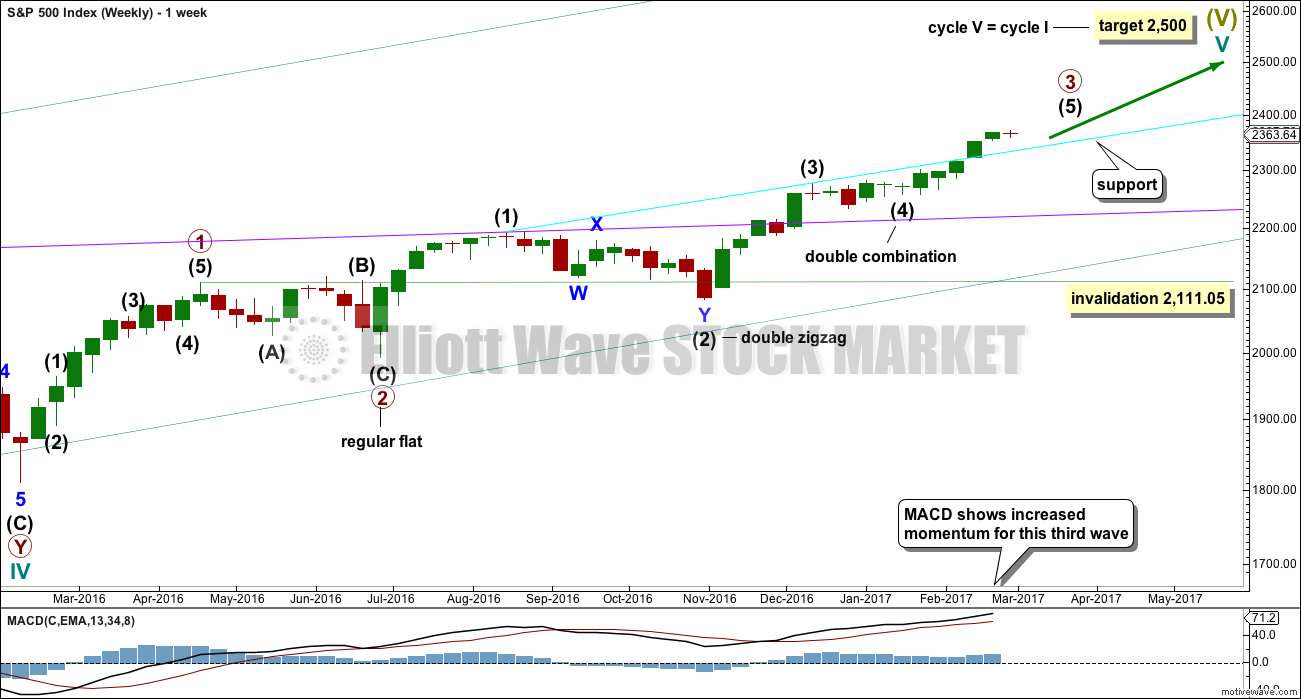
Cycle wave V is an incomplete structure. Within cycle wave V, primary wave 3 may be relatively close to completion.
When primary wave 3 is complete, then the following correction for primary wave 4 may not move into primary wave 1 price territory below 2,111.05.
Primary wave 2 was a flat correction lasting 47 days (not a Fibonacci number). Primary wave 4 may be expected to most likely be a zigzag, but it may also be a triangle if its structure exhibits alternation. If it is a zigzag, it may be more brief than primary wave 2, so a Fibonacci 21 sessions may be the initial expectation. If it is a triangle, then it may be a Fibonacci 34 or 55 sessions.
Primary wave 3 is now close to complete.
DAILY CHART
Click chart to enlarge.
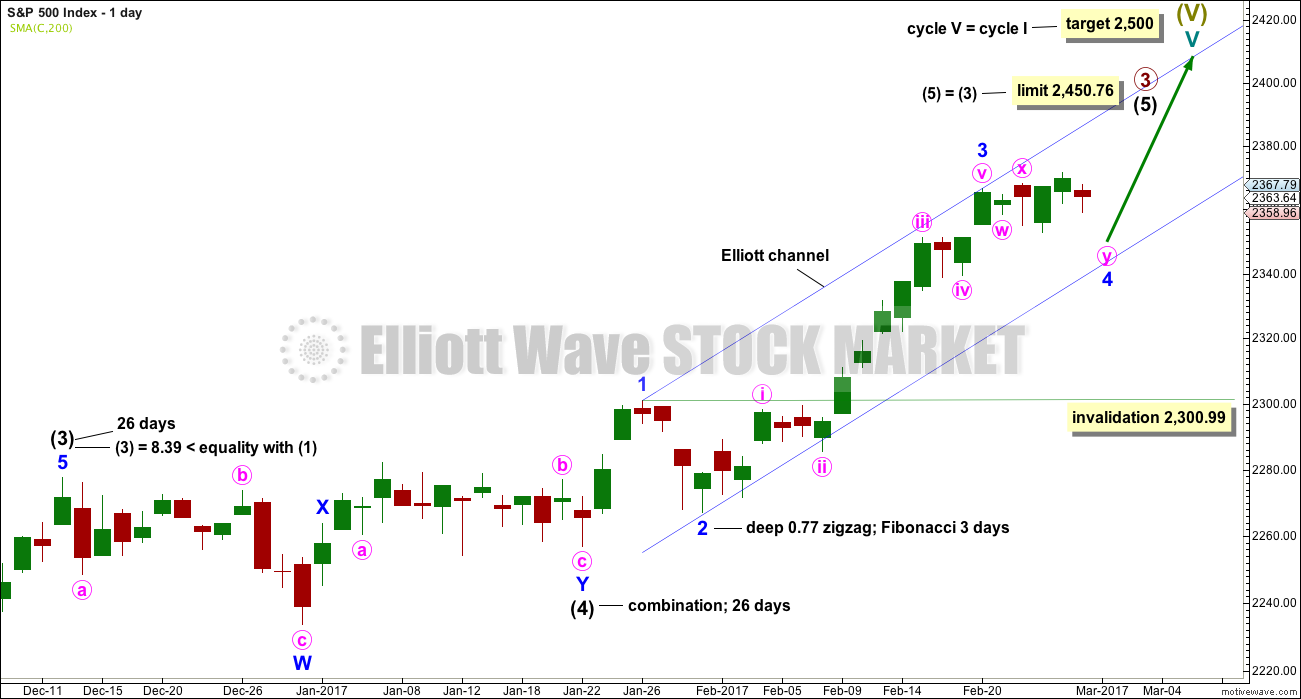
Intermediate wave (4) is a complete combination: zigzag – X – flat. It would have been even in duration with intermediate wave (3), both lasting 26 days.
Intermediate wave (3) is shorter than intermediate wave (1). One of the core Elliott wave rules states a third wave may never be the shortest wave, so this limits intermediate wave (5) to no longer than equality in length with intermediate wave (3) at 2,450.76.
Minor wave 3 has no Fibonacci ratio to minor wave 1. It is more likely that minor wave 5 will exhibit a Fibonacci ratio to either of minor waves 3 or 1.
Minor wave 2 was a deep 0.77 zigzag lasting three days. Minor wave 4 may be an incomplete double flat correction (first hourly chart) or it may be a complete single flat correction (alternate hourly chart). There is perfect alternation between minor waves 2 and 4 and they have better proportion now on the daily chart.
Intermediate wave (5) has so far lasted 25 days. If it is incomplete, then it is not going to be shorter in duration than intermediate wave (3). It does not have to, but it must be shorter in length. At this stage, an expectation of a Fibonacci 34 days total for intermediate wave (5) looks reasonable, so it may now continue for another 9 days or sessions.
The proportion here between intermediate waves (2) and (4) is acceptable. There is alternation. Both are labelled W-X-Y, but double zigzags are quite different structures to double combinations.
Minor wave 4 may be still incomplete. It may not move into minor wave 1 price territory below 2,300.99.
HOURLY CHART
Click chart to enlarge.
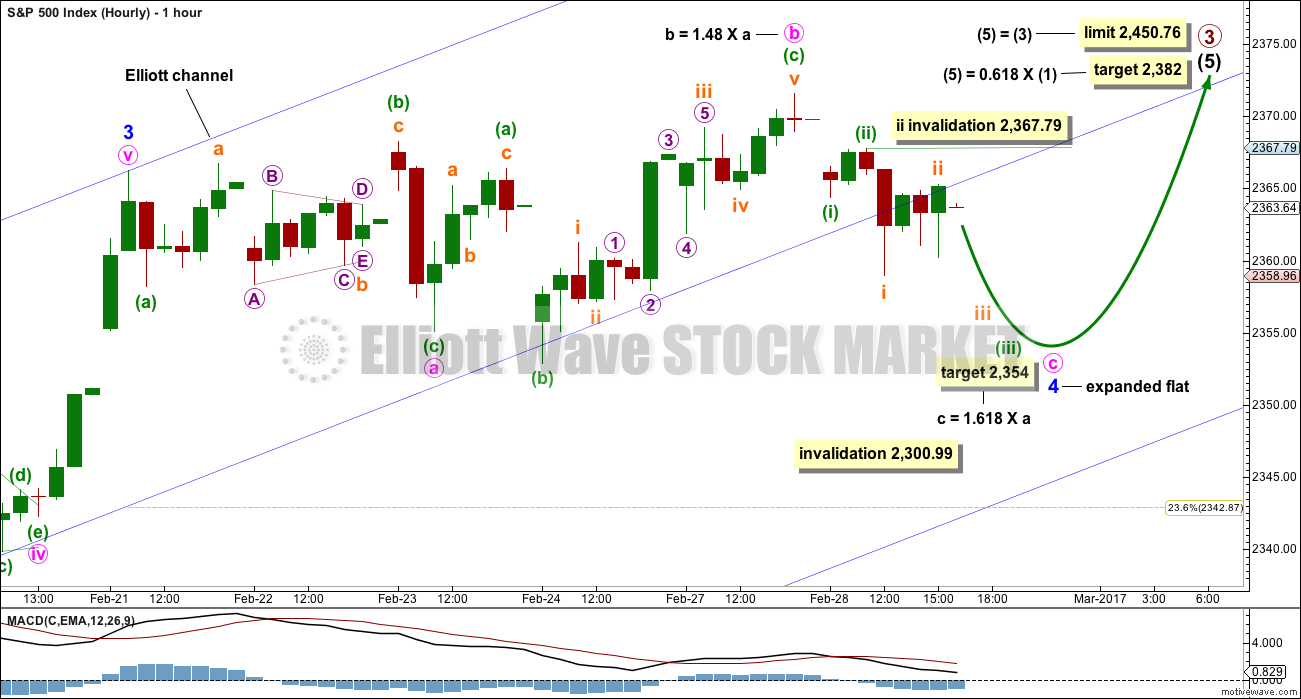
The structure of minor wave 4 is relabelled. It will fit as a more simple expanded flat. Because this has a good fit and because it is a much more common structure than a double flat, this is more likely.
This allows for a new target calculation that would see price continue to find support at the gap, which may have been a breakaway gap after the last consolidation. If support continues here, then it would be correctly labelled as a breakaway gap (these are usually not filled). But if price closes the gap, then it would more correctly be labelled an exhaustion gap. It may be either at this stage.
The target expects to see the most common Fibonacci ratio for minute wave c to minute wave a. The target would see minute wave c move below the end of minute wave a, avoiding a truncation and a very rare running flat. The target would see minute wave c not make a new price extreme below the end of minuette wave (b) within minute wave b, and that’s okay because it would not technically be a truncation. Sometimes B waves have price extremes within them.
Minute wave b is longer than the common length of up to 1.38 the length of minute wave a, but within the allowable limit of up to 2 times the length of minute wave a.
When minor wave 4 is complete, then the target for primary wave 3 may be calculated at minor degree as well. At that stage, it may widen to a small zone or it may change.
Within minute wave c, the correction for submineutte wave ii may not move beyond the start of subminuette wave i above 2,367.79. If that happens before downwards movement, then this main wave count would be invalidated and the alternate hourly wave count below should be used.
ALTERNATE HOURLY CHART
Click chart to enlarge.
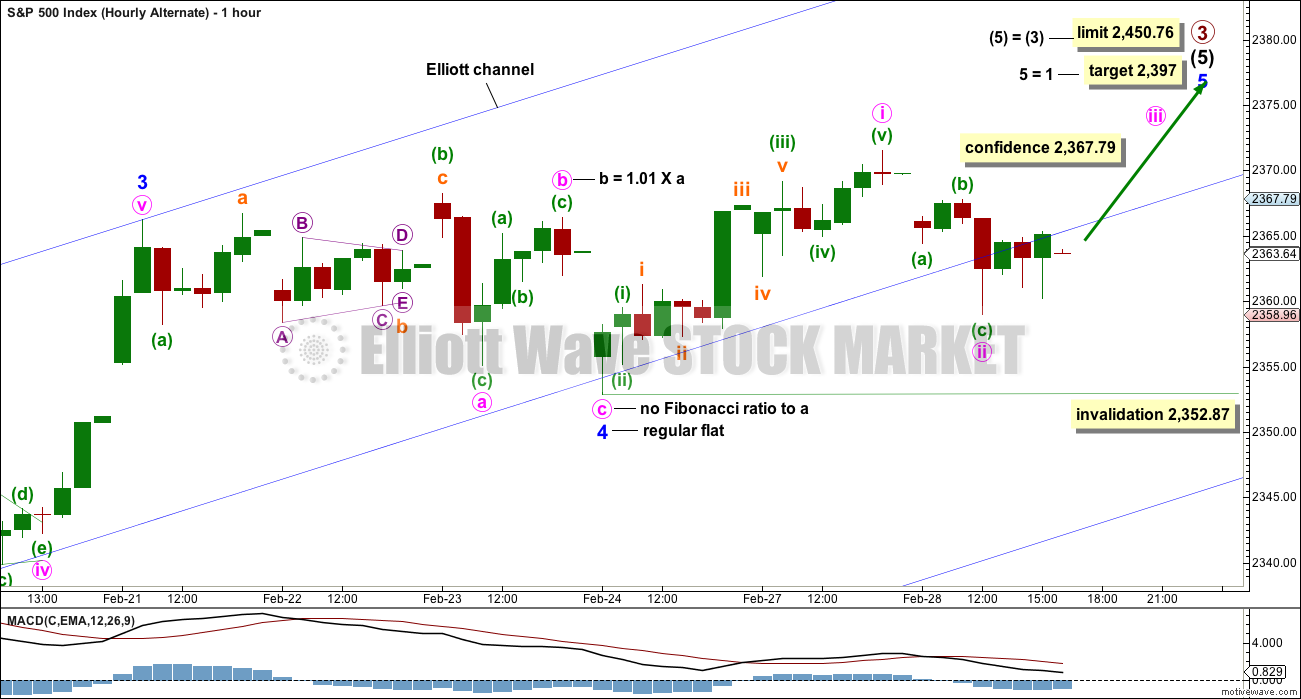
Alternatively, it is possible that minor wave 4 could be a completed regular flat.
Within the regular flat, minute wave a is a three, itself a flat correction. Minute wave b is a zigzag. Minute wave c moves below the end of minute wave a.
Minute wave ii looks like it may be a complete zigzag. This wave count now expects to see an increase in upwards momentum tomorrow. If minute wave ii continues lower as a double zigzag, then it may not move beyond the start of minute wave i below 2,352.87.
TECHNICAL ANALYSIS
WEEKLY CHART
Click chart to enlarge. Chart courtesy of StockCharts.com.
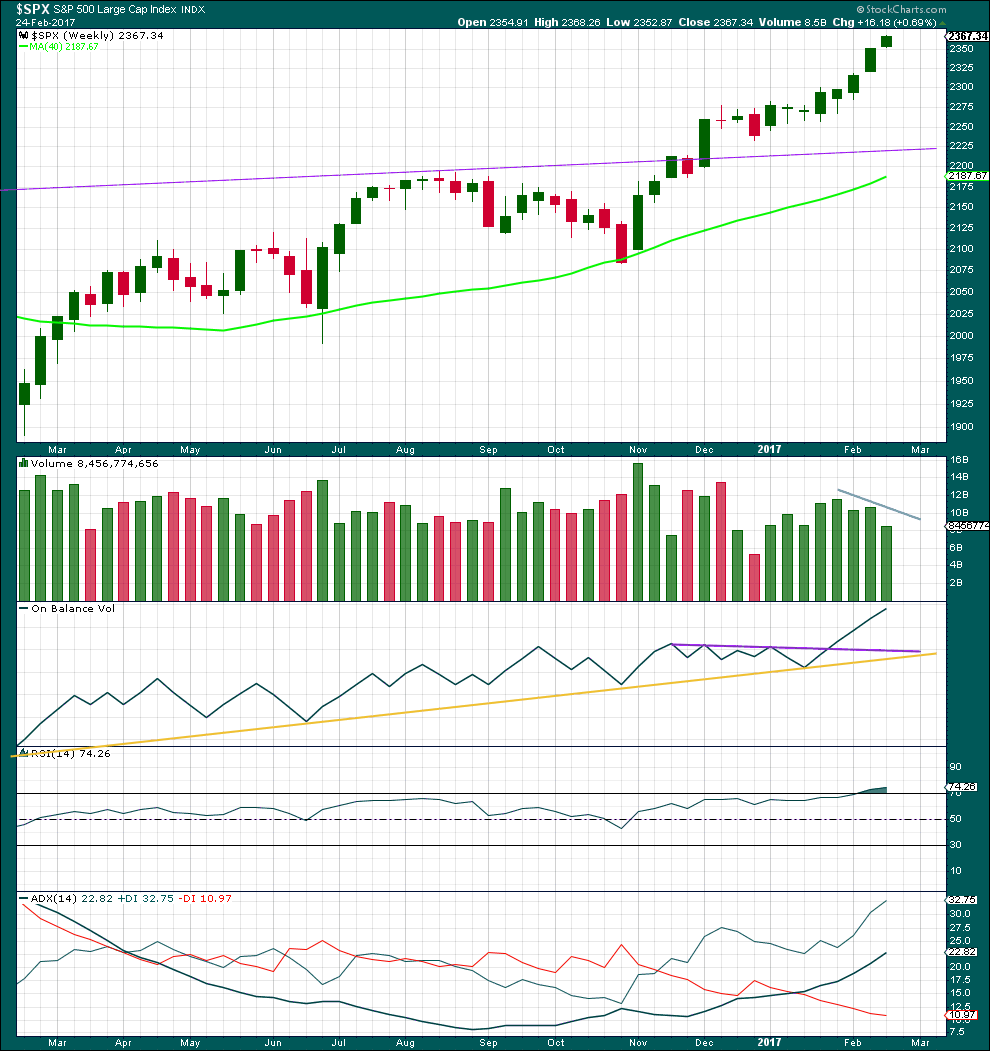
There are now eight green weekly candlesticks in a row. A larger correction may be expected soon, but not quite yet.
There has been some decline in volume over the last three weeks. This trend is showing early signs of weakening.
On Balance Volume remains very bullish.
RSI is overbought, but in a bull market this can remain extreme for a reasonable period of time. If it begins to exhibit divergence with price at the weekly chart level, then a larger correction may be expected to begin. There is no divergence at this time.
This trend is not yet extreme.
DAILY CHART
Click chart to enlarge. Chart courtesy of StockCharts.com.
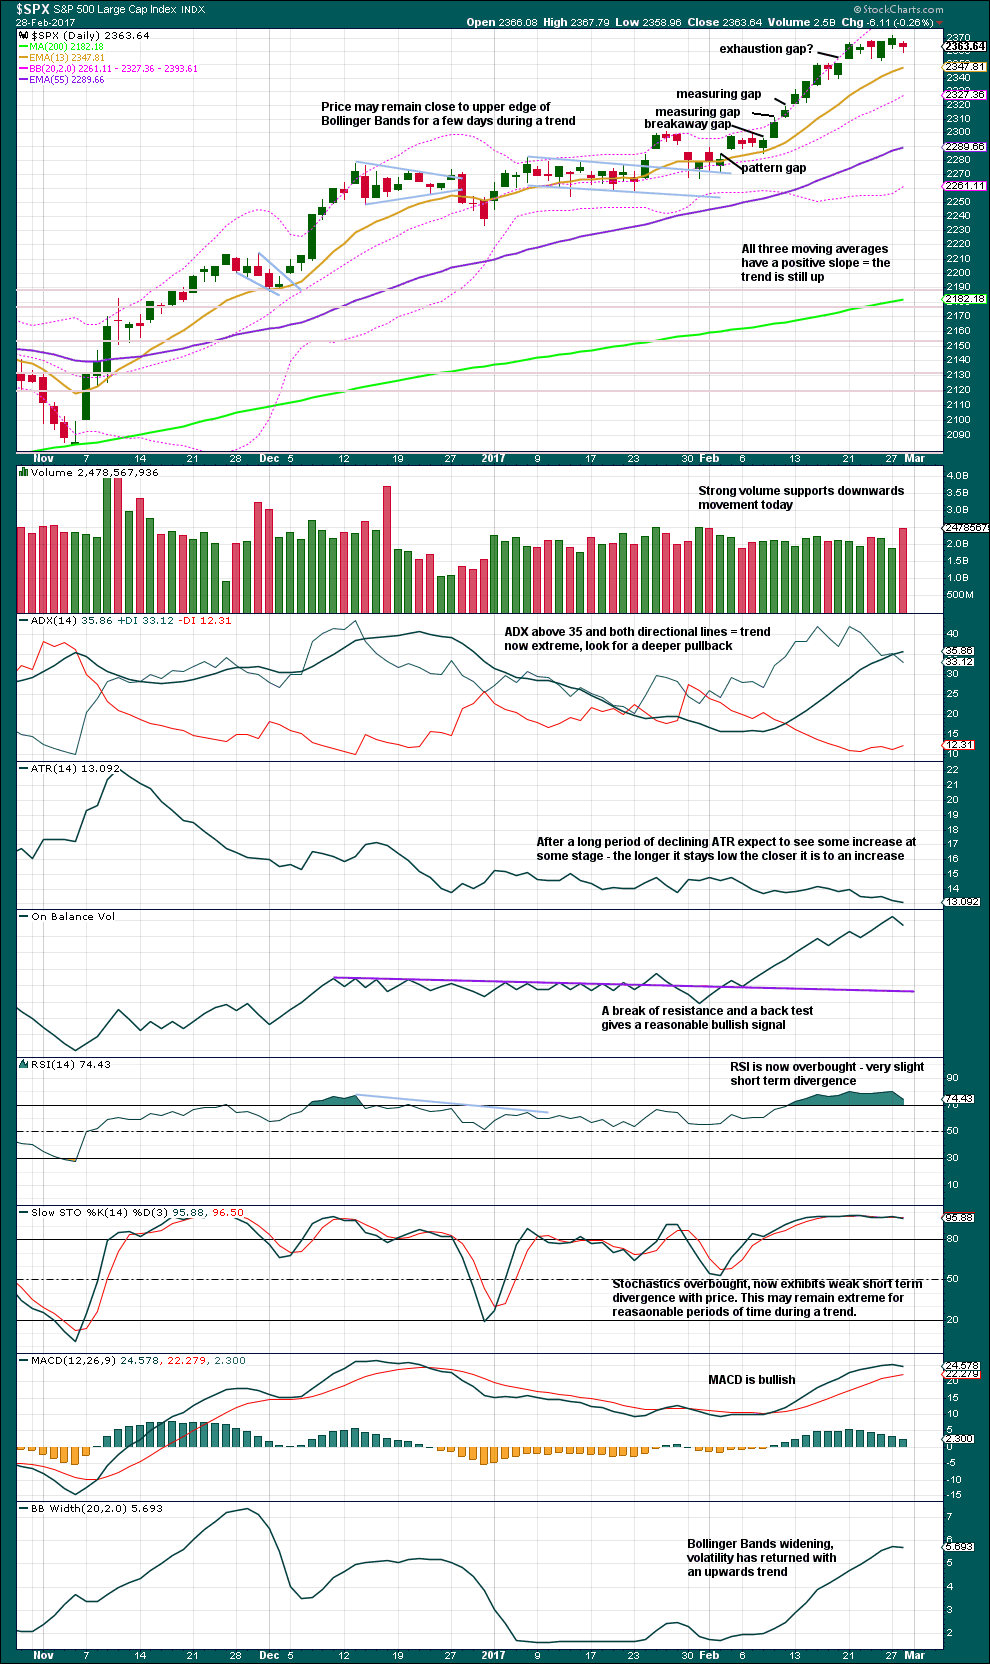
Price moved lower today, with a lower low and lower high, to close red. A strong increase in volume supports the downwards movement. This is bearish.
ADX, RSI and Stochastics are all extreme. The classic technical analysis picture looks to be more bearish than bullish short term and this favours the main hourly wave count.
Initially, look for price to find support at the Fibonacci 13 day moving average.
At this stage, the last gap may be either an exhaustion gap or breakaway gap. If it is closed tomorrow, then it would be an exhaustion gap. Next support would be about 2,340.
VOLATILITY – INVERTED VIX CHART
Click chart to enlarge. Chart courtesy of StockCharts.com.
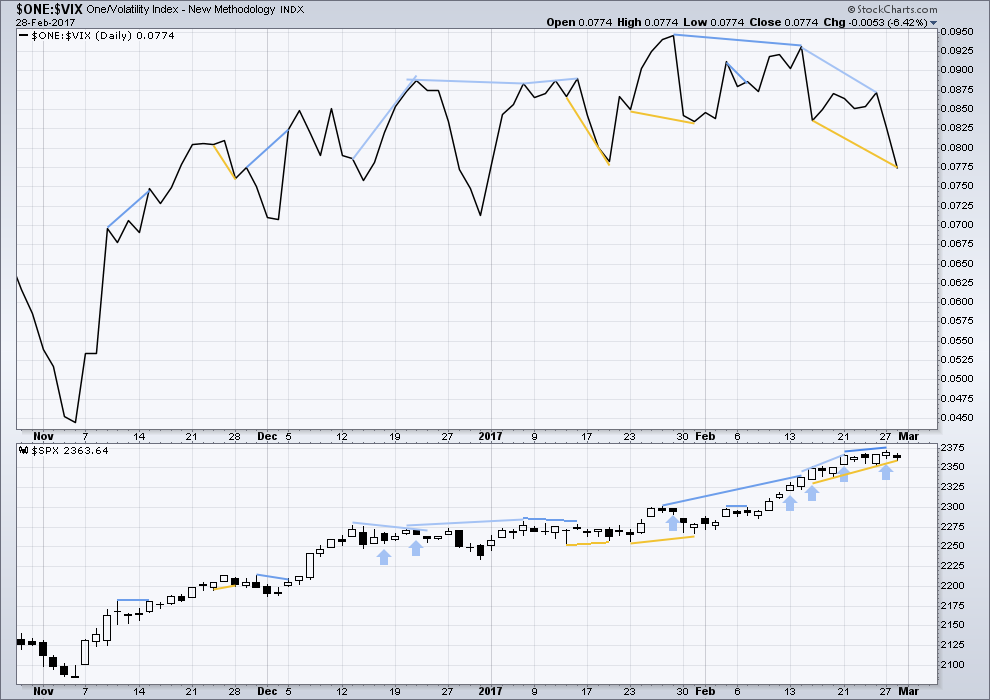
Normally, volatility should decline on rising price. There is double multi day divergence now between price and inverted VIX. This is bearish.
Either VIX is now decoupled from this market, or this persistent divergence will be resolved by primary wave 3 ending sooner than expected and primary wave 4 beginning very strongly. This divergence signals traders to be very cautious; assume the trend remains the same, but if entering the trend be aware for the potential here of a swift drop in price and use stops accordingly. Risk no more than 1-3% of equity.
Recent strong bearish divergence between price and VIX has now been followed by one downwards day. However, this is not a strong downwards day and more downwards movement may be required to resolve this bearish divergence.
There is today short term bullish divergence between price and VIX: price moved lower and volatility increased, but volatility is now stronger than it was on the 15th of February while price has not made a low below the 15th of February.
There are three prior instances of hidden bullish divergence noted on this chart for recent movement. Two of these three were followed by upwards movement. This divergence may work more often than it does not work, but it will not always correctly predict the next direction for price.
BREADTH – AD LINE
Click chart to enlarge. Chart courtesy of StockCharts.com.
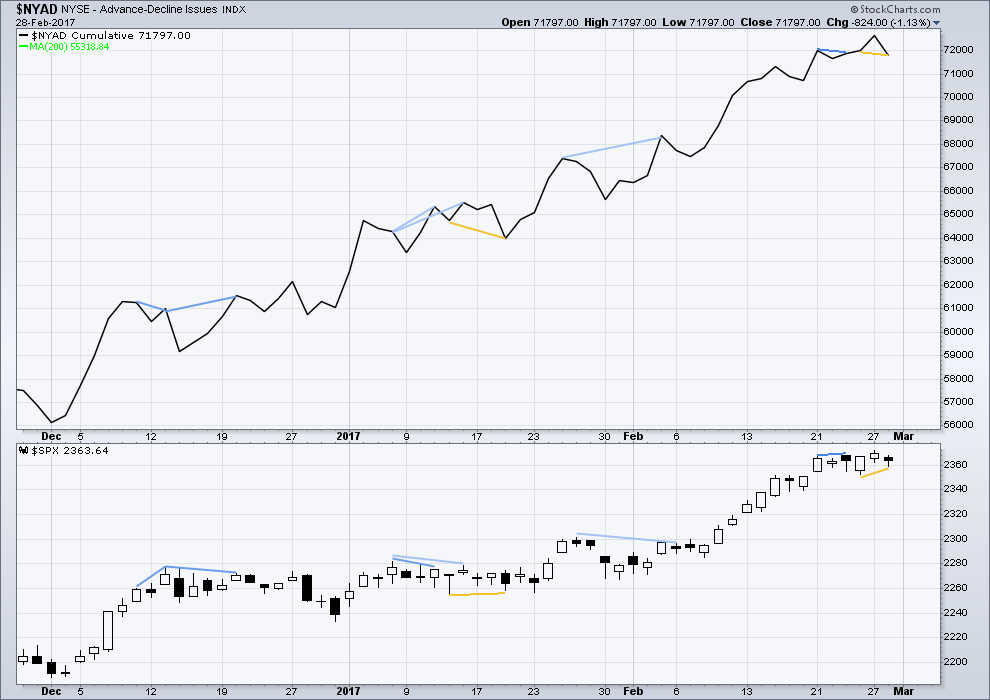
The rise in price has support from a rise in market breadth. Lowry’s OCO AD line also shows new highs along with price. Normally, before the end of a bull market the OCO AD line and the regular AD line should show divergence with price for about 4-6 months. With no divergence, this market has support from breadth.
There is new short term divergence today between the lows of the 24th of February and today’s low. Price made a higher low today, but the AD line made a lower low. This is hidden bullish divergence.
There is only one other instance on this chart of hidden bullish divergence and it was followed by upwards movement.
Divergence today between the AD line and price, and VIX and price, favours the alternate hourly Elliott wave count. Volume however favours the main Elliott wave count.
DOW THEORY
The DJIA, DJT, S&P500 and Nasdaq have made new all time highs in December of 2016. This confirms a bull market continues.
This analysis is published @ 07:42 p.m. EST.
Vern,
I believe Lara has Primary 2 labeled as a simple zig-zag. If I am correct, alternation means we will have a longer, choppy, sideways to down, mess with plenty of alternates. It could take several months to run its course. But the parabola swings in two directions and we might see the biggest and fastest move first.
Well, the alternate had confidence at the gap up. Another breakaway gap!
What to make of continued divergence with price and VIX? This is extremely strange behaviour. Should I ignore it? It does seem to be not useful short term. If I ignore it will that come back to get me? Will I regret it? I think I have to keep noting it, and warning it may herald a price shock downwards to come, but for now it’s broken.
Mr Market is broken Doc, he may need assistance 🙁
Anyway, the target at 2,397 was inadequate. It’s been passed already and minor 5 looks incomplete. Fifth waves most commonly have ratios to first waves. The most common is equality with the first, the next common is 1.618 X the first so that’s the next target calculation.
Today’s gap may be used as support, bring stops up to the lower edge at 2,371.54. This will also be the invalidation point for todays hourly EW count.
Note: my label for minute iii and iv ended needs to be moved. I don’t think they’re in the right place. Ignore that bit please.
Thanks Lara. I do like hearing your comments on inverted VIX and such. Even if broken now, indicators often return to former usefulness. As noted below, I took nice profits today. We may get 20 or more points up yet on the SPX, but the possibility of a big / volatile move to the downside has made me quite nervous the last few days. I am glad to be out with nice profits. I have pushed my luck too many times only to lose a lot of profits. Each time I tell myself I will not do that again. Today is one time I remained faithful to that pledge. Thanks for all your efforts.
If we cross SPX 2400 only to fail a day or so later, it can be a long drop to solid support. The same is true for DJIA and the 21,000 marker. If it gets rejected, it can easily be 1000 points down to support at 20,000!
My the little bullocks are frisky!
This is the kind of manic move up I was hoping to see. A few more days like this and we have a genuine parabola on our hands.
The continued divergence with VIX suggests the upcoming top is HUGE!
Will ya take a look at the massive monthly, weekly and daily SVXY divergence with price in the indices? Jiminy Crickets!!
I am loaded to the gills with volatility. I guess you can call me “Volatility Verne” Holding actual instrument shares instead of options in case the party continues awhile. I will continue to accumulate as we go higher. Congrats on your winnings Rod! I hope to report similar news in a few weeks from now!! 🙂
The window for a big pull back is closing rapidly! Closes within 10 trading days of March 1st.
If it closes… then DOW straight up to 40,000 over the next several years!
The BIG Cycle BEAR will go into hibernation for the remainder of my life at the close of this window!
Hi Joe. What window of opportunity are you considering?
This us why I mentioned the repatriation tax
I will be closing my long positions in my short term (trading) account by the end of the day. I have my sell order in a couple of points above current prices. If they do not get hit, I will change to market order by one hour before closing. I think we may drift a bit higher today. So I’ll give it some room to move up. But I do not want to look a gift horse in the mouth and end up giving back any of the gift.
As of 1:25 PM of the SPX trading day, I have all exited long positions in both short and long term accounts. The short term account received a 6.5% boost while the much larger long term (non-leveraged) account has a nice 3% total account gain. I am happy and thankful for Lara’s analysis and commentary.
Now I start looking for the beginning of a sizable move down (3% – 7%). Volatility should pick up greatly. But it will be a Primary 4th wave. 2nd and 4th waves are much more difficult to trade than 1st, 3rd and 5th waves.
Yep. Especially if the move includes triangles and combinations. Here’s hoping for a nice simple Zig Zag. We will probably get a monstrous expanded flat. Just as long as vols heads North I don’t care too much about the wave particulars!
Anybody remember what primary two looked like?
Hi Everyone/Lara
I may have it incorrect, however if your calling for this 5th wave too complete at 2500, can it be altered higher as if trump introduces a repatriation tax which will bring that is currently off shore back on shore it has the potential too push it higher Correct ? I hate asking this question as I don’t want too mix politics with technicals . However I feel its a fair question
Nino
I won’t mix politics with technicals. Trump is part of social mood, and it is social mood which drives markets. Not politicians or their decisions.
I know this is a very unpopular view, but it’s at the core of the “why” to Elliott wave.
I’m not going to adjust targets or wave counts based upon what a politician might or might not do, and the effect that may or may not have.
This analysis is technical. I use Fibonacci ratios and numbers, and technical indicators and volume.
I respect your take Lara. Great work
Just FYI all members over here at EWSM: there’s another Trading Room post over at EWG.
There are a couple of bits which are hidden for members only, which I’ll copy over here so no one here misses out.
I can see possible set ups for Copper and USD Index.
Trading advice for Copper (to be read in conjunction with the post here):
“If entering short here, stops may be set just above the last high on the 13th of February at 2.823. Give the market room to move, and be prepared to have an underwater position for one to three days. A target may be 1.937, in the first instance, although this may be too optimistic. If price moves down and away strongly, then move stops to breakeven to reduce risk. Always follow my two Golden Rules.”
Trading advice for USD Index:
” If entering long here, stops may be set either just a little below the trend line (with the risk of a whipsaw stopping the position out before price turns back up) or more properly just below 99.23. Allow the market some room to move because the trend line may not be perfect. Adjust position size down if setting stops further away, so that the Golden Rules are met. Initial profit target may be 105.98.”
Lara, I must say you’re crushing it throughout this very odd, and risky time. The narrowing of alternates and confirming or non-confirming display of evidence is very objective and well defined. Many members likely do not fully grasp the value you’re able to provide. Cheers, I’m off to get shacked in Barbados for two weeks!!
I certainly appreciate Lara’s analysis and the value of her work. The extra stuff is all value added over an above my expectations.
LOL cheers Chris and Rodney 🙂
So far in my Trading Room the only call that may be considered not good enough (and where I’ve had three small losses trying to find my entry) is USDJPY.
Everything else has been spot on. So far. So yeah, pretty happy with that.
Get one for me Chris. Barbados is one of the most beautiful places, I’ll surf there one day. For now, I’ll surf vicariously through you 🙂 May your waves be AWESOME
One note: Today daily VIX closed well above its Bolinger Band. This can happen a day or two or a bit more. But it usually does not stay there very long.
Lara,
You mention “But if price makes a new high above 2,367.79, then expect more upwards movement with an increase in momentum to a target about 2,382”. If this case, it should be alternate hourly scenario instead of main hourly scenario. But you mark the target of alternate hourly scenario about 2,397 (instead of 2,382) for Int 5, and the target of main hourly scenario about 2,382. Do I misunderstand some details?
No, you understand perfectly. I have made a mistake.
Thank you very much David for pointing it out. I’ll fix now.
I seize the opportunity to be first to comment,, my comment is,,, Hi !!
Drat! Beaten again.
Hi Doc 🙂