
A downwards day was not expected for Friday. The slight new lower high and lower low essentially moved price sideways for the session.
Summary: A consolidation may end Monday with a short wave down to end below 2,352.87. Thereafter, the upwards trend should resume. The target is again 2,382, but this may change when minor wave 4 is over and it can be calculated at minor degree. This bull market is still healthy and looks likely to continue for a few months at least. Corrections present an opportunity to join the trend.
New updates to this analysis are in bold.
Last monthly and weekly charts are here. Last historic analysis video is here.
MAIN ELLIOTT WAVE COUNT
WEEKLY CHART
Click chart to enlarge.
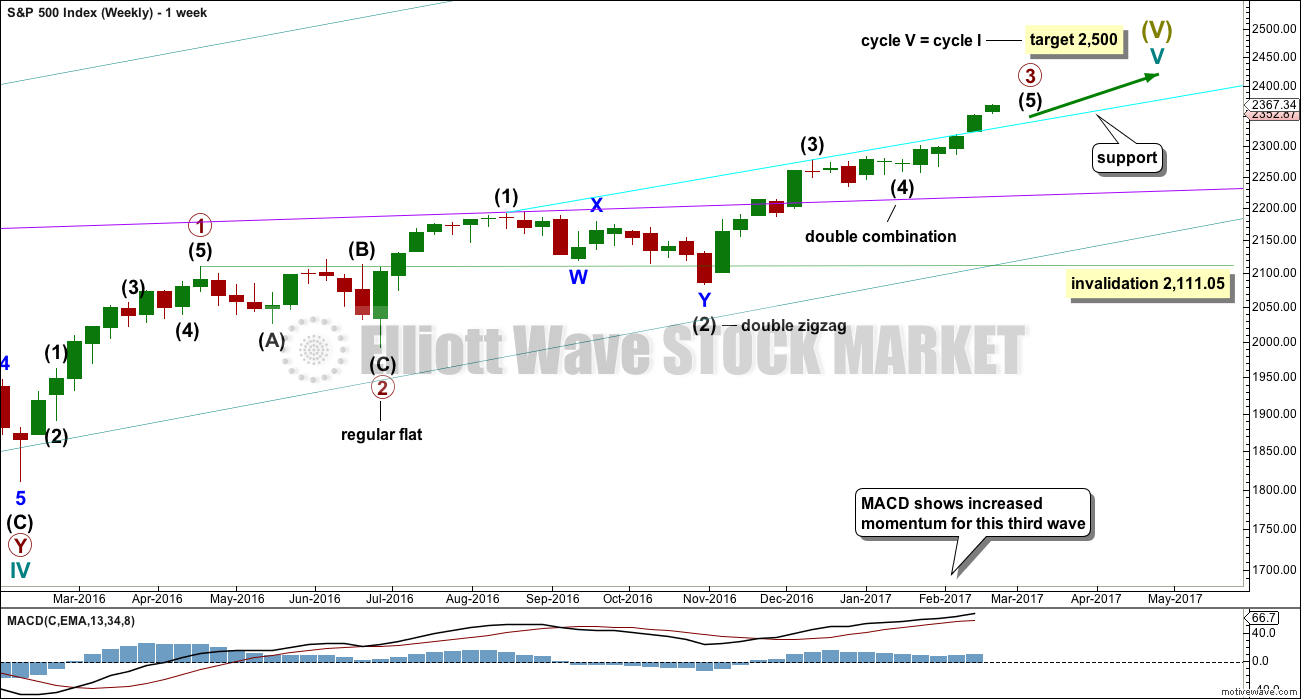
Cycle wave V is an incomplete structure. Within cycle wave V, primary wave 3 may be relatively close to completion.
When primary wave 3 is complete, then the following correction for primary wave 4 may not move into primary wave 1 price territory below 2,111.05.
Primary wave 2 was a flat correction lasting 47 days (not a Fibonacci number). Primary wave 4 may be expected to most likely be a zigzag, but it may also be a triangle if its structure exhibits alternation. If it is a zigzag, it may be more brief than primary wave 2, so a Fibonacci 21 sessions may be the initial expectation. If it is a triangle, then it may be a Fibonacci 34 or 55 sessions.
Primary wave 3 is still incomplete.
DAILY CHART
Click chart to enlarge.
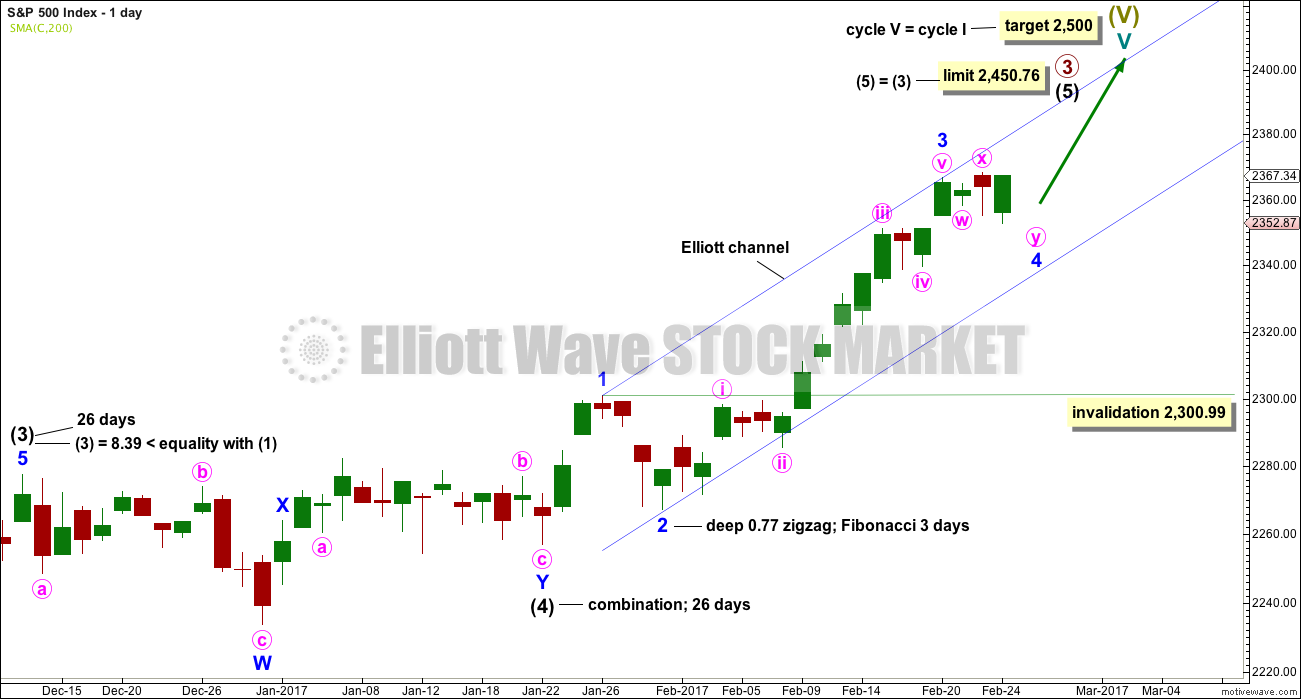
Intermediate wave (4) is a complete combination: zigzag – X – flat. It would have been even in duration with intermediate wave (3), both lasting 26 days.
Intermediate wave (3) is shorter than intermediate wave (1). One of the core Elliott wave rules states a third wave may never be the shortest wave, so this limits intermediate wave (5) to no longer than equality in length with intermediate wave (3) at 2,450.76.
Minor wave 3 has no Fibonacci ratio to minor wave 1. It is more likely that minor wave 5 will exhibit a Fibonacci ratio to either of minor waves 3 or 1. The target assumes it will exhibit the most common Fibonacci ratio.
Minor wave 2 was a deep 0.77 zigzag lasting three days. Minor wave 4 today shows more clearly on the daily chart. It may have completed as a very common expanded flat correction. There is perfect alternation between minor waves 2 and 4 and they have better proportion now on the daily chart.
Intermediate wave (5) has so far lasted 23 days. It may be expected to be shorter both in length and duration compared to intermediate wave (3). At this stage, an expectation of a Fibonacci 34 days total for intermediate wave (5) looks reasonable, so it may now continue for another 11 days or sessions.
The proportion here between intermediate waves (2) and (4) is acceptable. There is alternation. Both are labelled W-X-Y, but double zigzags are quite different structures to double combinations.
Minor wave 4 is still incomplete. It may not move into minor wave 1 price territory below 2,300.99.
HOURLY CHART
Click chart to enlarge.
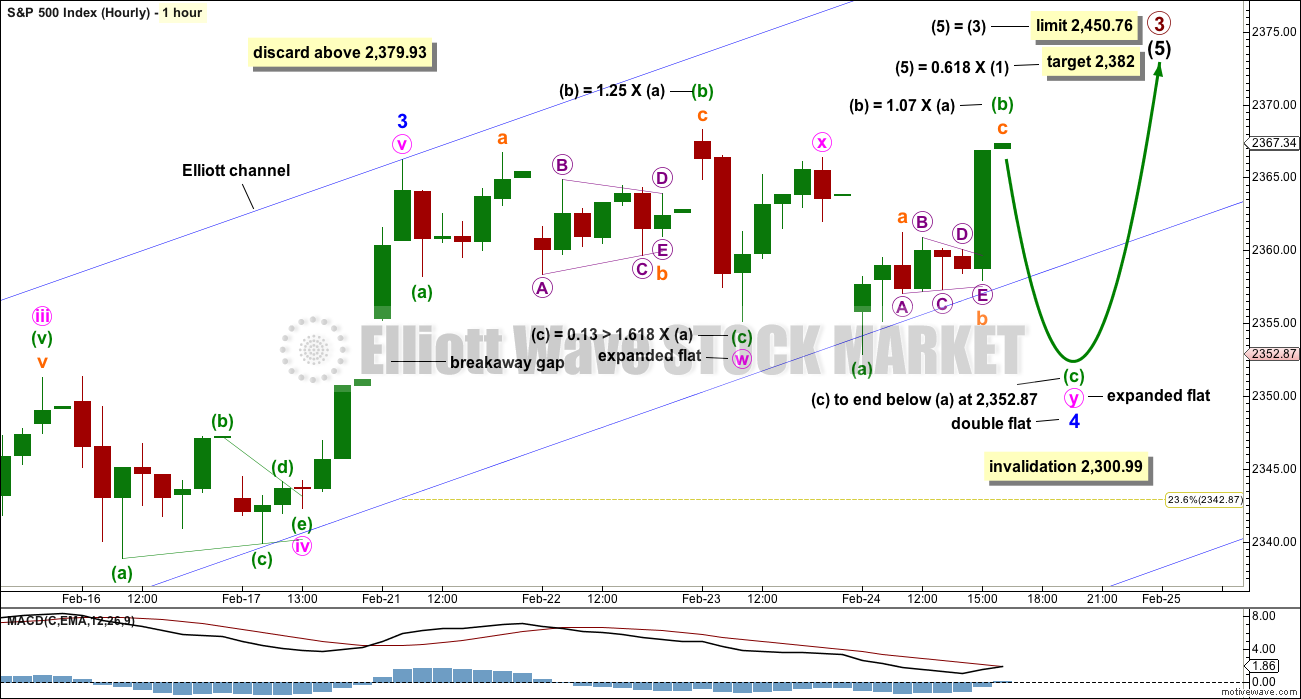
The structure of minor wave 4 continued further sideways invalidating the last published hourly chart.
A double flat may be unfolding. No target is given for minuette wave (c) down because it is not clear if minuette wave (b) has ended.
Within the second flat of the double labelled minute wave y, minuette wave (b) would be twice the length of minuette wave (a) at 2,379.93. Above that price point the idea of a second flat unfolding would be discarded based upon a very low probability. Unfortunately, this price point may be too high to be useful.
This wave count expects a downwards wave to move below 2,352.87, so that minuette wave (c) moves below the end of minuette wave (a) avoiding a truncation and a very rare running flat.
ALTERNATE HOURLY CHART
Click chart to enlarge.
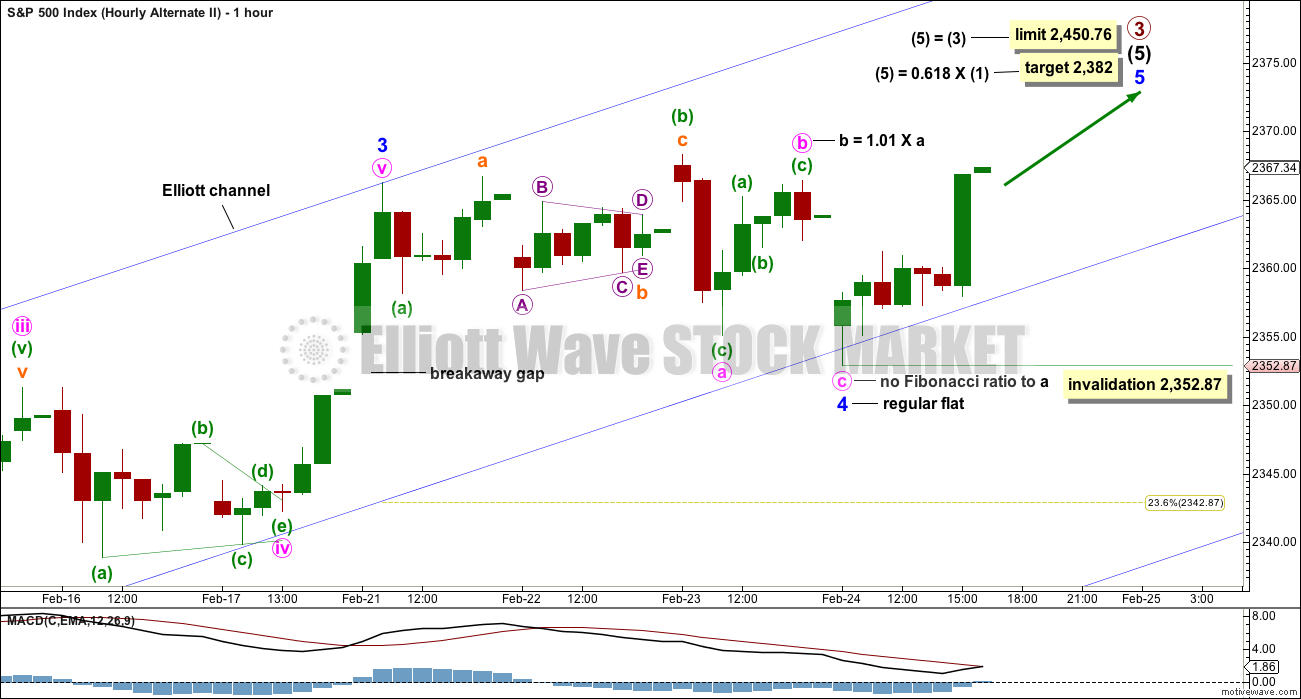
Alternatively, it is possible that minor wave 4 could be a completed regular flat.
Within the regular flat, minute wave a is a three, itself a flat correction. Minute wave b is a zigzag. Minute wave c moves below the end of minute wave a.
If price keeps rising on Monday, then this wave count would be preferred.
At this time, it is my judgement that this alternate wave count is about even in probability with the first hourly wave count.
BEARISH ALTERNATE HOURLY CHART
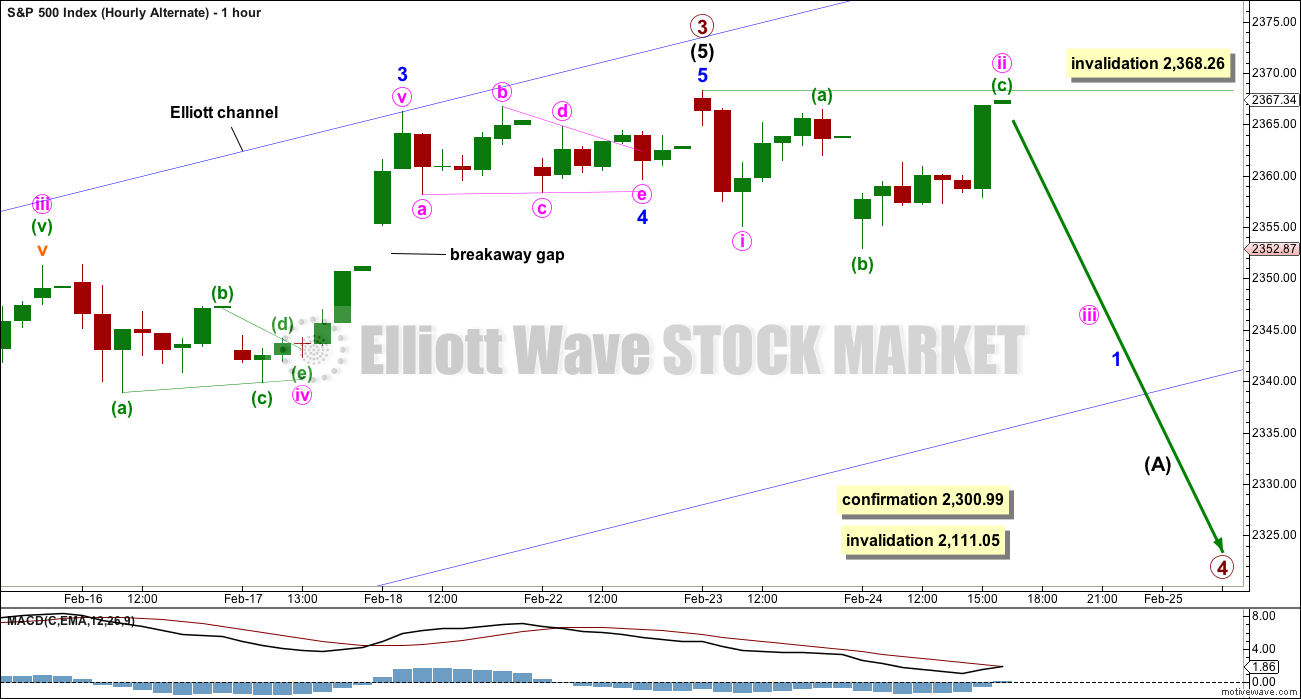
Click chart to enlarge.
It is also possible that primary wave 3 is over and primary wave 4 has just begun. A new high above 2,368.26 would immediately fully invalidate this alternate idea.
This wave count requires a new low below 2,300.99 for confirmation. Prior to that a clear and strong breach of the blue Elliott channel by downwards movement would see this wave count substantially increase in probability to become the main wave count.
At this stage, it is my judgement that this wave count has a very low probability.
TECHNICAL ANALYSIS
WEEKLY CHART
Click chart to enlarge. Chart courtesy of StockCharts.com.
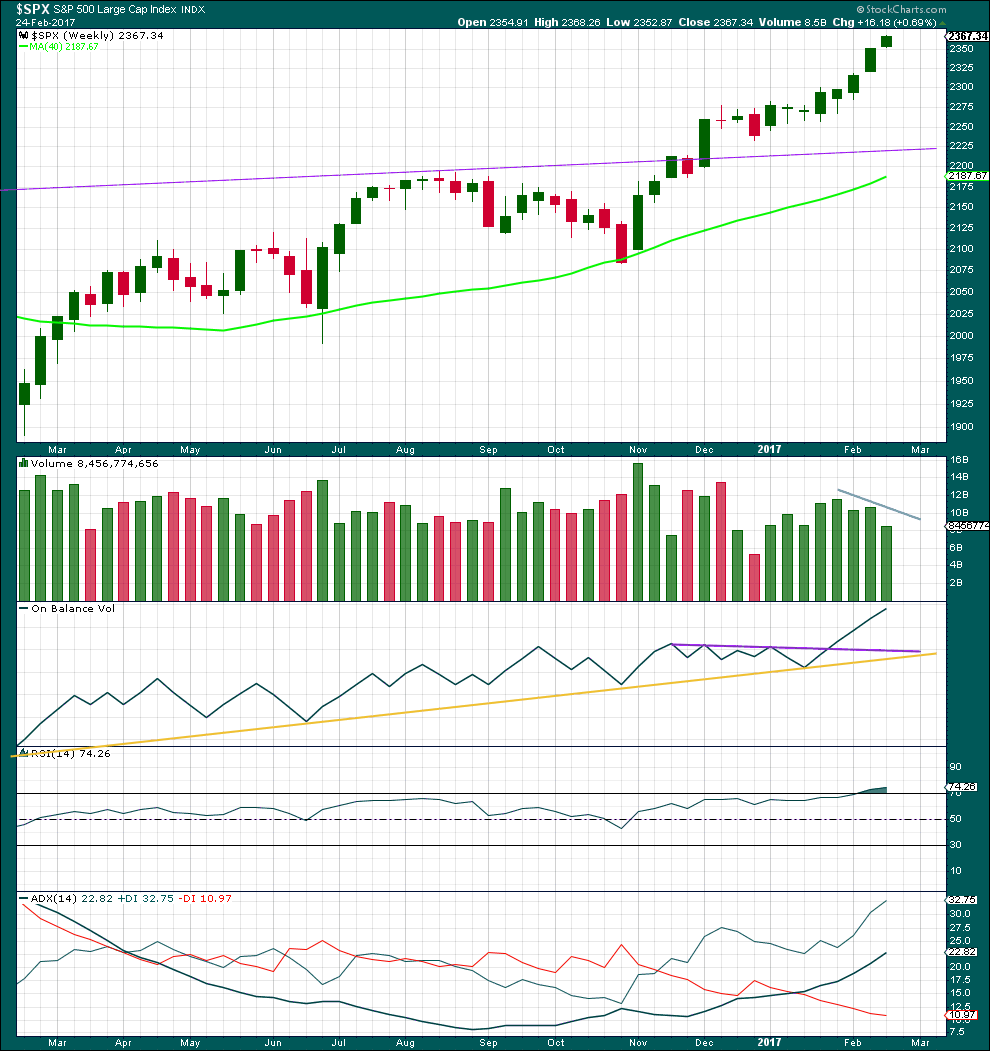
There are now eight green weekly candlesticks in a row. A larger correction may be expected soon, but not quite yet.
There has been some decline in volume over the last three weeks. This trend is showing early signs of weakening.
On Balance Volume remains very bullish.
RSI is overbought, but in a bull market this can remain extreme for a reasonable period of time. If it begins to exhibit divergence with price at the weekly chart level, then a larger correction may be expected to begin. There is no divergence at this time.
This trend is not yet extreme.
DAILY CHART
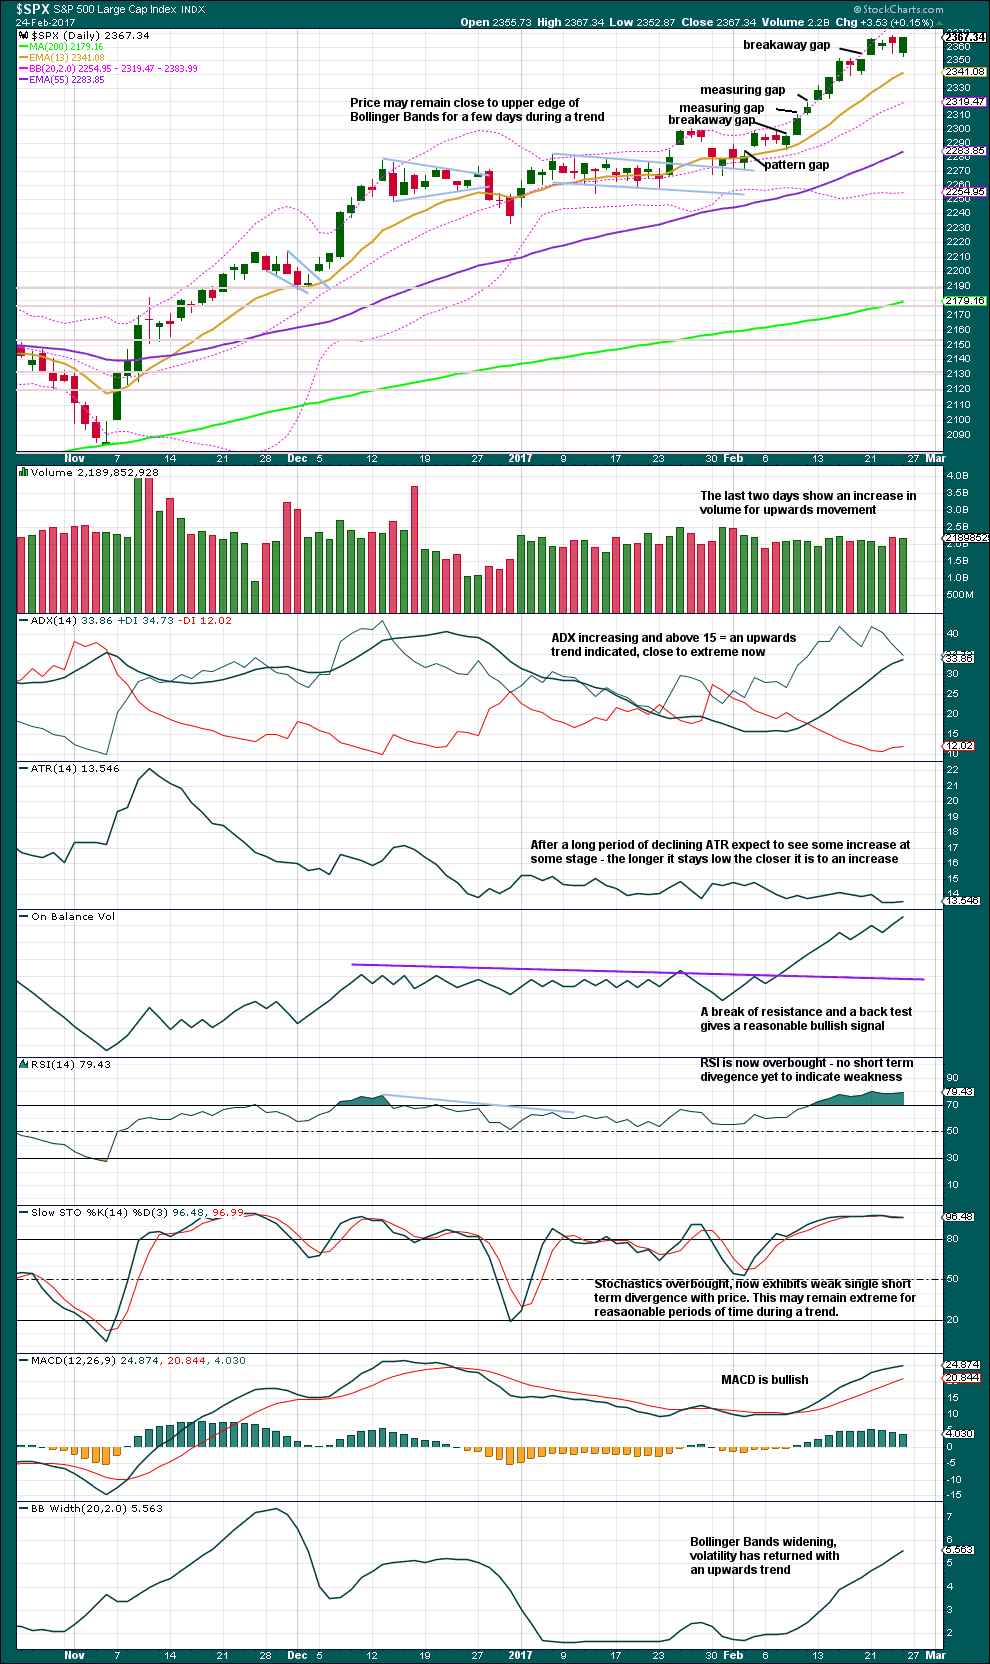
Click chart to enlarge. Chart courtesy of StockCharts.com.
Friday moved price lower with a lower low and lower high, but it closed green and the balance of volume during the session was upwards. This fits the first hourly chart; lighter volume may be a small B wave. The rise in price during Friday’s session was not well supported by volume.
On Balance Volume is very bullish.
There is very slight short term divergence between price and RSI from the high of the 21st of February to Friday’s high. Price has made a very slight new high by 0.63 points, but RSI has made a lower high by 0.98. This divergence should not be given much weight because it is so small. It very slightly favours the first hourly Elliott wave chart.
VOLATILITY – INVERTED VIX CHART
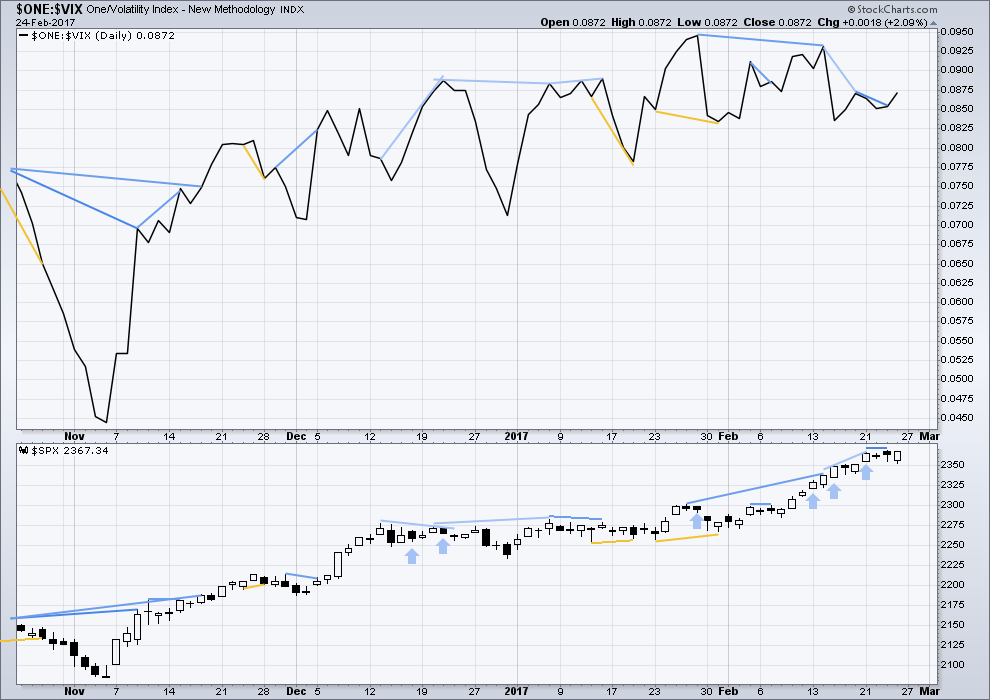
Click chart to enlarge. Chart courtesy of StockCharts.com.
Normally, volatility should decline on rising price. There is triple multi day divergence now between price and inverted VIX. This is bearish.
Either VIX is now decoupled from this market, or this persistent divergence will be resolved by primary wave 3 ending sooner than expected and primary wave 4 beginning very strongly. This divergence signals traders to be very cautious; assume the trend remains the same, but if entering the trend be aware for the potential here of a swift drop in price and use stops accordingly. Risk no more than 1-3% of equity.
Strong warning: Watch the market closely. Be disciplined with stops. Protect profits on long positions. If entering long here, reduce risk to only 1-3% of equity.
BREADTH – AD LINE
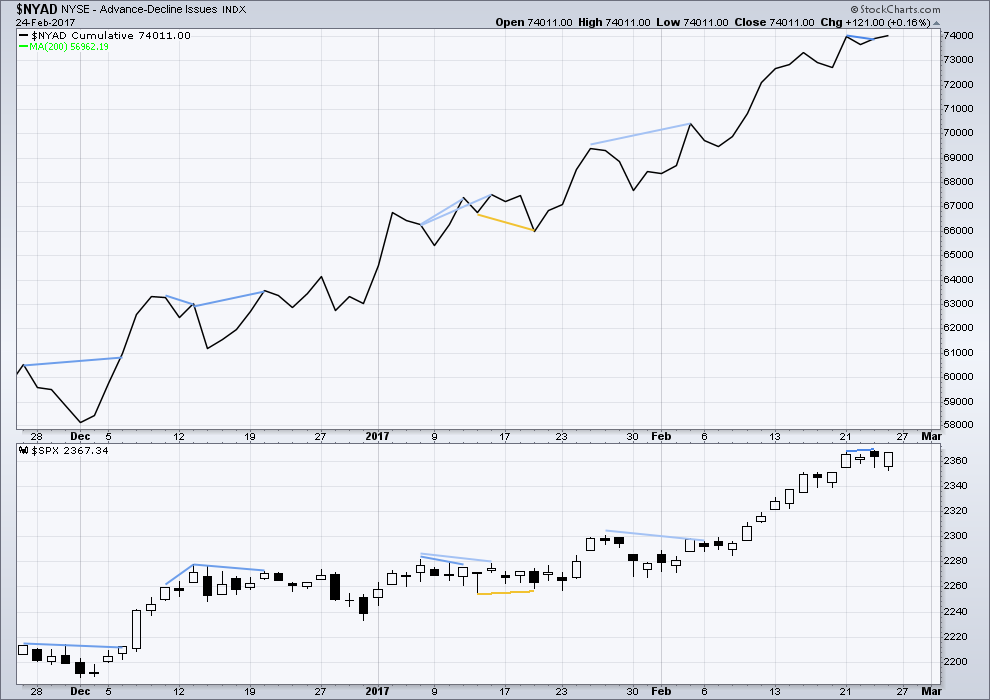
Click chart to enlarge. Chart courtesy of StockCharts.com.
The rise in price has support from a rise in market breadth. Lowry’s OCO AD line also shows new highs along with price. Normally, before the end of a bull market the OCO AD line and the regular AD line should show divergence with price for about 4-6 months. With no divergence, this market has support from breadth.
Short term divergence between price and the AD line noted after Thursday’s session has been followed by what was essentially a downwards day for Friday. This divergence may now be resolved, or it may be followed by yet one more downwards day.
DOW THEORY
The DJIA, DJT, S&P500 and Nasdaq have made new all time highs in December of 2016. This confirms a bull market continues.
This analysis is published @ 03:28 a.m. EST on 25th February, 2017.
Thanks Lara for all your diligent work.
Just a half hour into the trading day, it looks like the bearish hourly alternate has been invalidated by a move above 2368.26. My data shows 2368.50.
Yep. That was nice and quick.